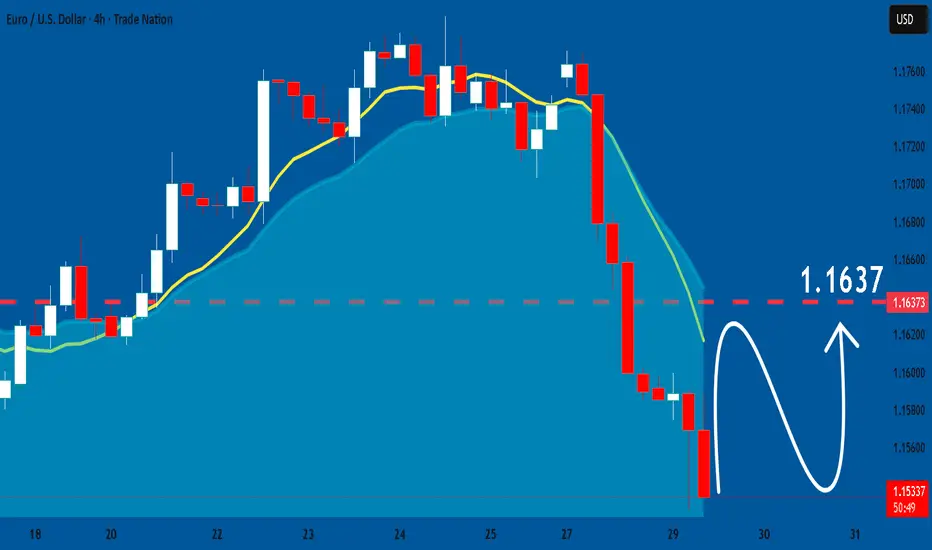
EURUSD Set To Grow! BUY!
My dear followers,
This is my opinion on the EURUSD next move:
The asset is approaching an important pivot point 1.1557
Bias - Bullish
Technical Indicators: Supper Trend generates a clear long signal while Pivot Point HL is currently determining the overall Bullish trend of the market.
Goal - 1.1632
About Used Indicators:
For more efficient signals, super-trend is used in combination with other indicators like Pivot Points.
Disclosure: I am part of Trade Nation's Influencer program and receive a monthly fee for using their TradingView charts in my analysis.
———————————
WISH YOU ALL LUCK
LONG
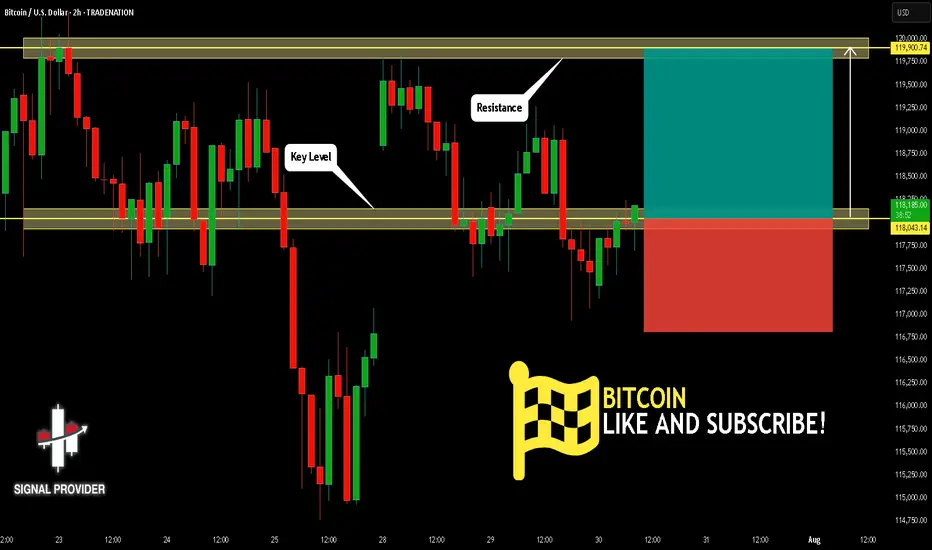
BITCOIN Will Move Higher! Long!
Take a look at our analysis for BITCOIN.
Time Frame: 2h
Current Trend: Bullish
Sentiment: Oversold (based on 7-period RSI)
Forecast: Bullish
The price is testing a key support 118,043.14.
Current market trend & oversold RSI makes me think that buyers will push the price. I will anticipate a bullish movement at least to 119,900.74 level.
P.S
The term oversold refers to a condition where an asset has traded lower in price and has the potential for a price bounce.
Overbought refers to market scenarios where the instrument is traded considerably higher than its fair value. Overvaluation is caused by market sentiments when there is positive news.
Disclosure: I am part of Trade Nation's Influencer program and receive a monthly fee for using their TradingView charts in my analysis.
Like and subscribe and comment my ideas if you enjoy them!
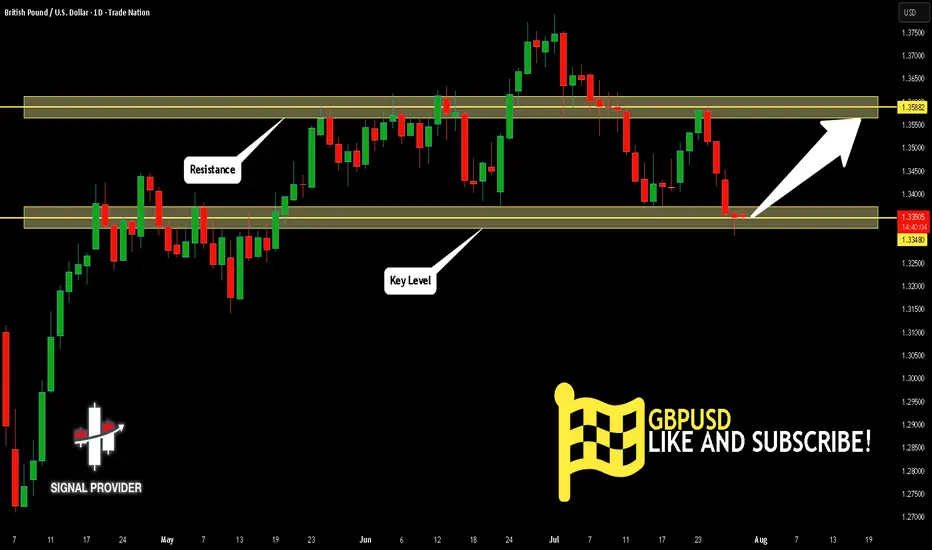
GBPUSD Is Very Bullish! Buy!
Here is our detailed technical review for GBPUSD.
Time Frame: 1D
Current Trend: Bullish
Sentiment: Oversold (based on 7-period RSI)
Forecast: Bullish
The market is testing a major horizontal structure 1.334.
Taking into consideration the structure & trend analysis, I believe that the market will reach 1.358 level soon.
P.S
Overbought describes a period of time where there has been a significant and consistent upward move in price over a period of time without much pullback.
Disclosure: I am part of Trade Nation's Influencer program and receive a monthly fee for using their TradingView charts in my analysis.
Like and subscribe and comment my ideas if you enjoy them!
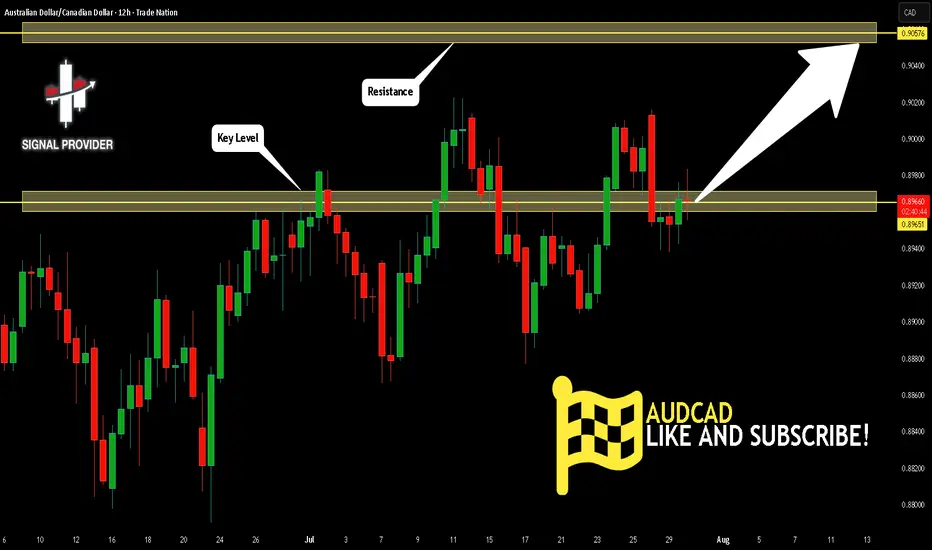
AUDCAD Is Going Up! Long!
Take a look at our analysis for AUDCAD.
Time Frame: 12h
Current Trend: Bullish
Sentiment: Oversold (based on 7-period RSI)
Forecast: Bullish
The market is approaching a key horizontal level 0.896.
Considering the today's price action, probabilities will be high to see a movement to 0.905.
P.S
Please, note that an oversold/overbought condition can last for a long time, and therefore being oversold/overbought doesn't mean a price rally will come soon, or at all.
Disclosure: I am part of Trade Nation's Influencer program and receive a monthly fee for using their TradingView charts in my analysis.
Like and subscribe and comment my ideas if you enjoy them!
Bitcoin Passes Stress TestOn July 25, 2025, Galaxy Digital executed one of the largest Bitcoin sales ever recorded: 80,000 BTC, valued at approximately $9 billion , on behalf of a Satoshi-era investor.
Despite the size, the market absorbed the flow with minimal volatility—Bitcoin dipped from around $119,000 to $115,000, then rebounded above $119,000.
Liquidity Maturity in Motion
Analysts called the trade a significant demonstration of market maturity, noting that 80,000 BTC was absorbed in days with barely a market blip.
Crypto infrastructure has also evolved: algorithmic liquidity providers, institutional desks, and OTC channels handled the load without triggering cascading funding rate hikes or forced liquidations.
Ongoing Risks
Event-Driven Stress: During macro shocks or sharp sell-offs, liquidity may thin, and the same level of absorption might not persist.
OTC vs Exchange: This large sale was managed mostly off-exchange. A similar-sized on-exchange dump could still trigger stop-run cascades.
Retail Complacency Risk: The stability seen now can be deceptive, as retail may misinterpret low volatility as a safe leverage zone, only to be caught off-guard.
Projections:
Watching the 23.6% fib retracement level in line with the $116,600 price level. Anticipate the resistance level of $120,000 to be retested.
If price breaks above $120,000, we could see a significant move toward $130,000
The $9B BTC sale went through without materially impacting price is considered a milestone in crypto market evolution. It reflects institutional-grade liquidity and sentiment maturity.

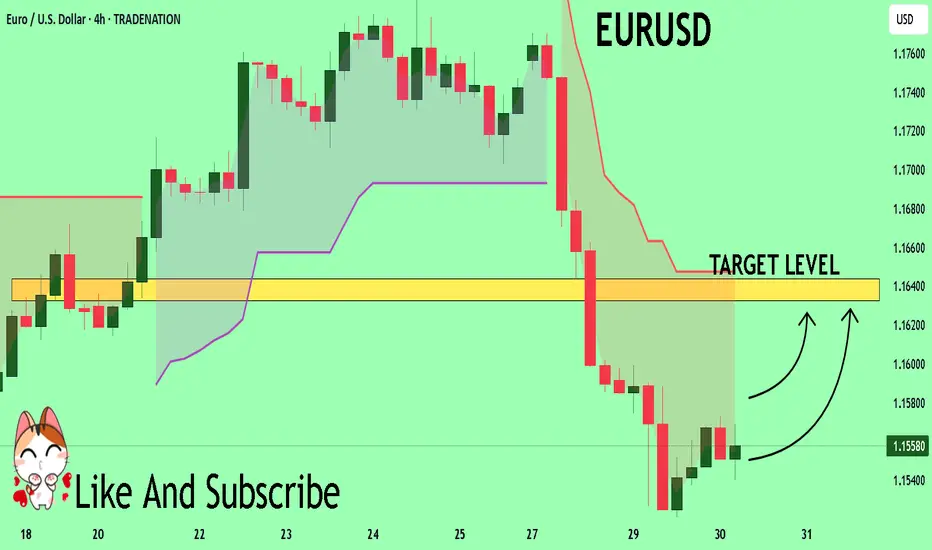
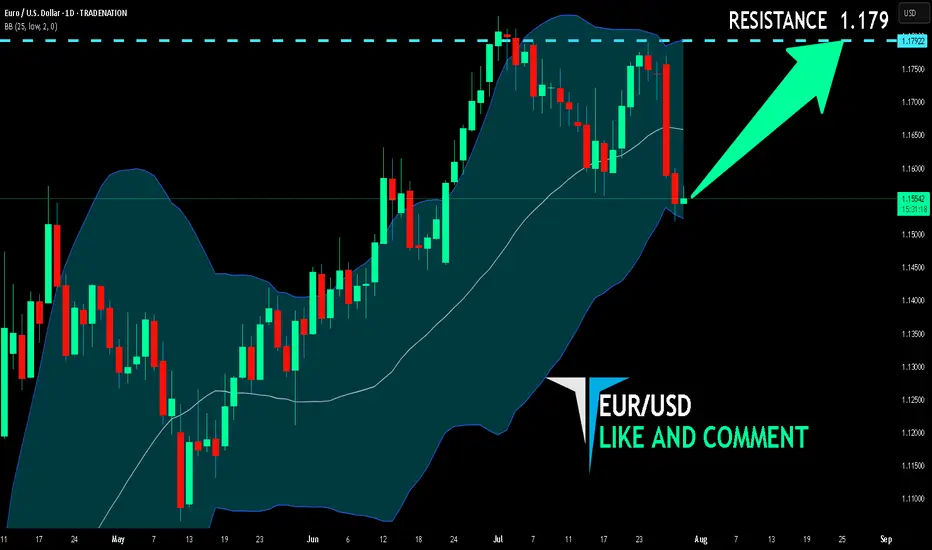
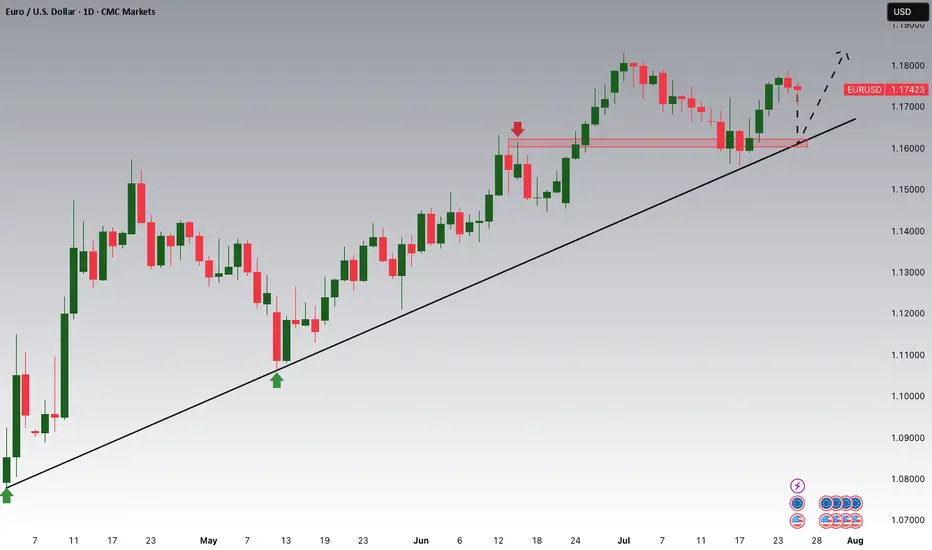
EUR/USD BULLISH BIAS RIGHT NOW| LONG
Hello, Friends!
EUR/USD pair is in the uptrend because previous week’s candle is green, while the price is obviously falling on the 1D timeframe. And after the retest of the support line below I believe we will see a move up towards the target above at 1.179 because the pair is oversold due to its proximity to the lower BB band and a bullish correction is likely.
Disclosure: I am part of Trade Nation's Influencer program and receive a monthly fee for using their TradingView charts in my analysis.
✅LIKE AND COMMENT MY IDEAS✅
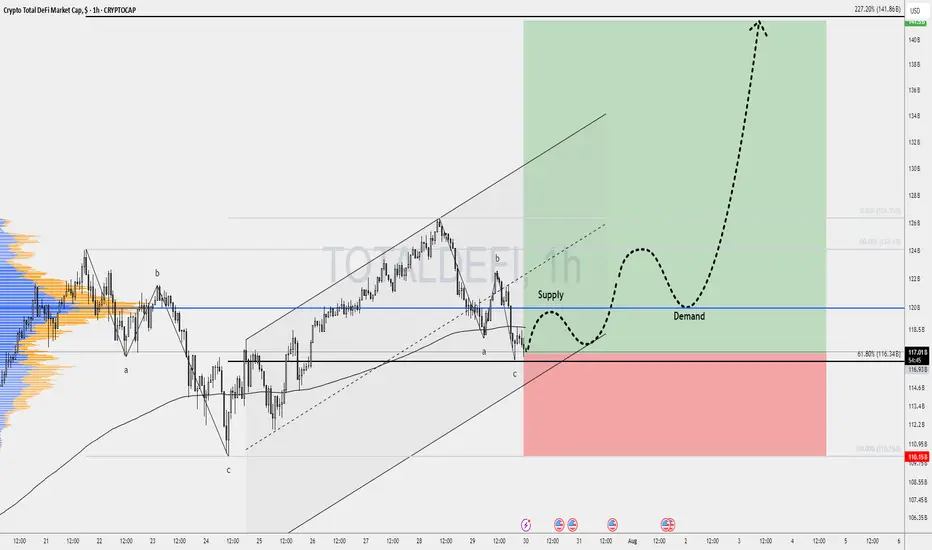
DeFi’s Make-or-Break MomentThe spotlight today is on TOTALDEFI, an index that could become one of the most exciting charts in the crypto market.
While many altcoins look heavy under selling pressure, TOTALDEFI is holding firmly at the 61.8% Fibonacci support near 116B. This zone is often a turning point where strong reversals begin. If the level continues to hold, we might see a 20% move to the upside, signaling renewed strength in the DeFi sector.
This price action could be a sign that decentralized finance projects are ready to lead the next market phase.
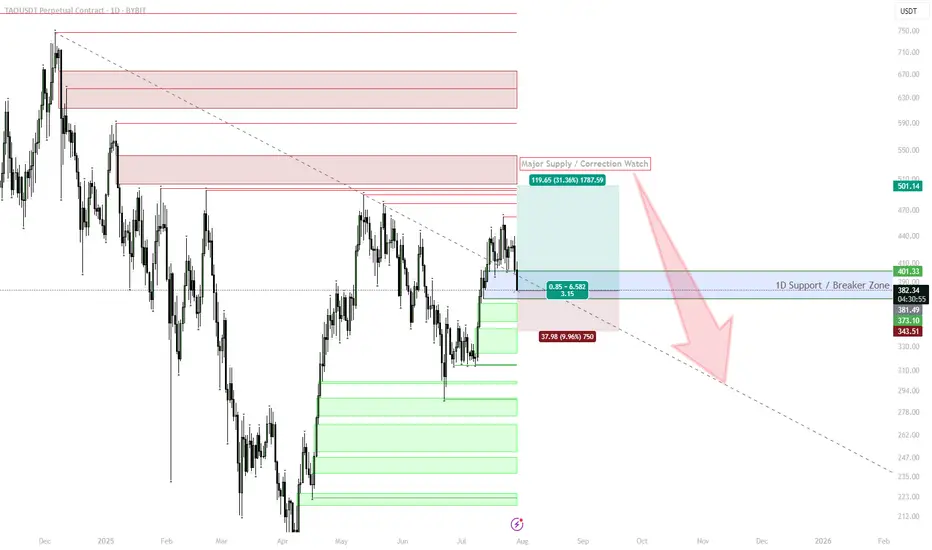
TAO | #1D — One More Leg Up Before Major CorrectionStep-by-Step Scenario:
Current Context:
Price is consolidating above the 373–382 support (blue box) after a strong impulse from June lows. This zone aligns with a major HTF demand and retest of the recent breakout.
Expected Move:
Base Case: Holding the 373–382 zone triggers a new leg higher toward the $500 supply area.
Upside Target: $500+ (main target), with interim resistance at $440–460.
Trigger: Look for strong 1D closes above 401 for confirmation, or a quick dip and reclaim of 382 for entries.
Timing:
Expect the final move up to play out into late August. Watch for momentum and trend exhaustion as we enter September.
Major Correction Risk:
If price stalls or forms an SFP at $500 or in upper supply, look to reduce exposure and prepare for a multi-week/month correction.
Breakdown below 373 (especially daily close) invalidates the bullish scenario and may accelerate a correction back to 320–260.
Why:
The market structure remains bullish above support.
Still running on strong narrative/momentum, but approaching key supply zones and cycle timing.
Macro risk: Many alts (including TAO) could top as Q3 ends, mirroring historical cycles.
FARTCOIN | #3D — Swing Long from SupportFARTCOIN just tapped into a key 3D support zone after a sweep below prior range lows. The rejection from 1.65–1.45 weekly resistance has set up a fresh entry at demand, with risk well-defined.
Step-by-Step Price Scenario:
Support Confirmation: Price swept the range lows and rebounded from 1.12–1.22 demand. This area is now critical for bulls to hold.
Entry Logic: Accumulation within the blue box is favored for a swing long. Stop loss placed below $1.00 (invalidating the idea if broken).
First Objective: Look for price to reclaim 1.22, with a move toward the weekly S/R at 1.45 as first resistance.
Main Target: If momentum follows through, next key target is 1.65 (D3 SFP), with a possible extension to $2.74 (measured move).
Risk: Breakdown below $1.00 negates the idea and opens the door to much deeper downside (next demand block $0.60–0.80).
Why:
The setup offers a high R:R, with clear invalidation. Reclaiming 1.22 after a sweep typically triggers fast mean reversion, especially on volatile alts. Watch for signs of strength — strong candle closes above 1.22 or a quick retest.

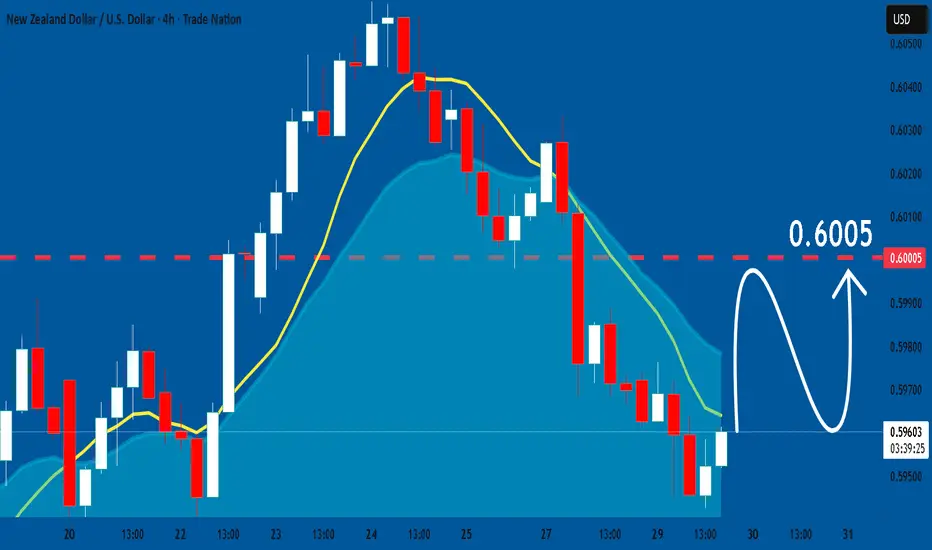
NZDUSD: Market Sentiment & Price Action
Looking at the chart of NZDUSD right now we are seeing some interesting price action on the lower timeframes. Thus a local move up seems to be quite likely.
Disclosure: I am part of Trade Nation's Influencer program and receive a monthly fee for using their TradingView charts in my analysis.
❤️ Please, support our work with like & comment! ❤️
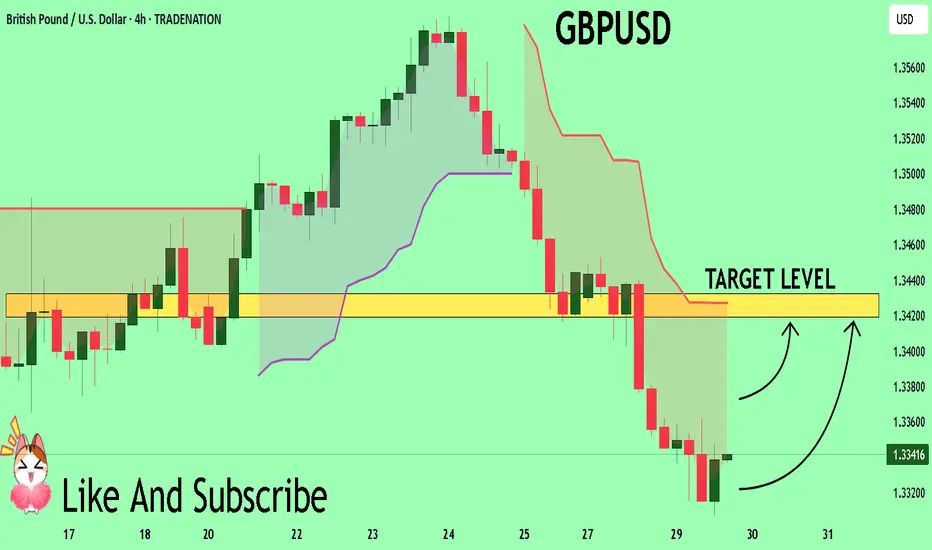
GBPUSD Will Explode! BUY!
My dear friends,
Please, find my technical outlook for GBPUSD below:
The instrument tests an important psychological level 1.3339
Bias - Bullish
Technical Indicators: Supper Trend gives a precise Bullish signal, while Pivot Point HL predicts price changes and potential reversals in the market.
Target - 1.3419
About Used Indicators:
Super-trend indicator is more useful in trending markets where there are clear uptrends and downtrends in price.
Disclosure: I am part of Trade Nation's Influencer program and receive a monthly fee for using their TradingView charts in my analysis.
———————————
WISH YOU ALL LUCK
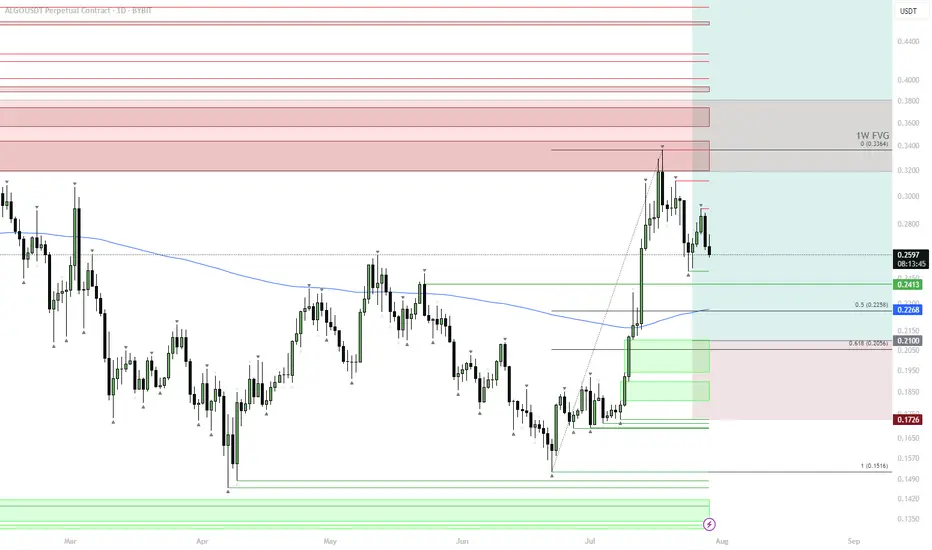
ALGO | #1D — Building the Spot Position LowerALGO has completed its first local move and is now retracing toward key support levels. The price remains under the 200DMA and is heading into the first cluster of demand zones.
Step-by-Step Price Scenario:
Initial Support: Watch the 0.2413–0.2268 zone — this is the first area to scale in spot buys.
Main Accumulation: If price drops deeper, the main spot buy window is $0.22–0.20 (0.5–0.618 retracement of the recent rally and the main demand block).
Invalidation: Breakdown below $0.1726 would invalidate the spot strategy and suggest deeper downside.
Bullish Confirmation: A strong reaction from either of these support levels, followed by reclaiming the 200DMA, would set up the next move toward $0.33–$0.35.
Why this plan:
Buying spot on pullbacks into HTF demand with clear invalidation below keeps risk defined, and the current market structure allows for compounding if the trend resumes.
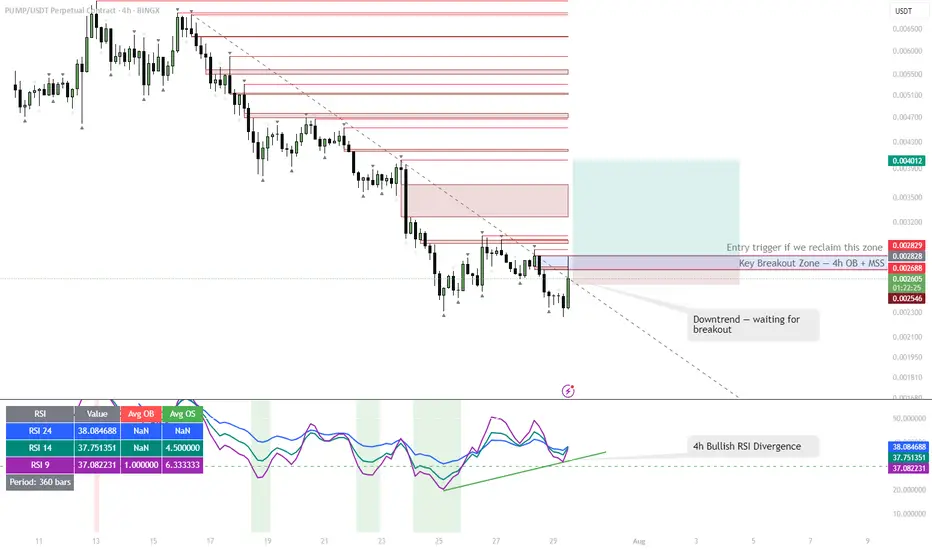
PUMP | #4h #long — Watching for Breakout Confirmation Early signals for a reversal, but not rushing in.
Some clear bullish divergence on the 4h RSI — first positive sign after an extended downtrend. Price can pop from here, but my plan is to wait for a break and hold above the 4h Order Block + MSS zone (red box) before taking any long entry.
Confirmation is key — I only want to get involved if we reclaim this area with momentum.
Scenario:
If we get a strong breakout and close above the red OB + MSS zone, that’s the first entry trigger for a potential trend reversal.
Until then — standing aside, letting the setup prove itself.
Reasoning:
Bullish RSI divergence often marks the beginning of a reversal, but without a structural breakout, the move can easily fail.
Patience pays off in these high-risk, low-liquidity coins.
EURUSD: Bullish Continuation is Expected! Here is Why:
Remember that we can not, and should not impose our will on the market but rather listen to its whims and make profit by following it. And thus shall be done today on the EURUSD pair which is likely to be pushed up by the bulls so we will buy!
Disclosure: I am part of Trade Nation's Influencer program and receive a monthly fee for using their TradingView charts in my analysis.
❤️ Please, support our work with like & comment! ❤️
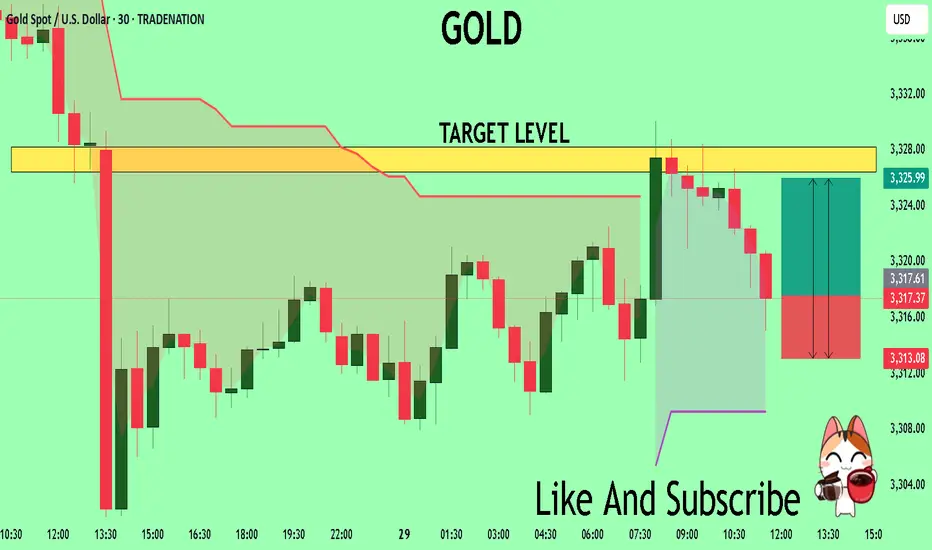
GOLD The Target Is UP! BUY!
My dear subscribers,
This is my opinion on the GOLD next move:
The instrument tests an important psychological level 3317.7
Bias - Bullish
Technical Indicators: Supper Trend gives a precise Bullish signal, while Pivot Point HL predicts price changes and potential reversals in the market.
Target - 3326.4
My Stop Loss - 3313.0
About Used Indicators:
On the subsequent day, trading above the pivot point is thought to indicate ongoing bullish sentiment, while trading below the pivot point indicates bearish sentiment.
Disclosure: I am part of Trade Nation's Influencer program and receive a monthly fee for using their TradingView charts in my analysis.
———————————
WISH YOU ALL LUCK
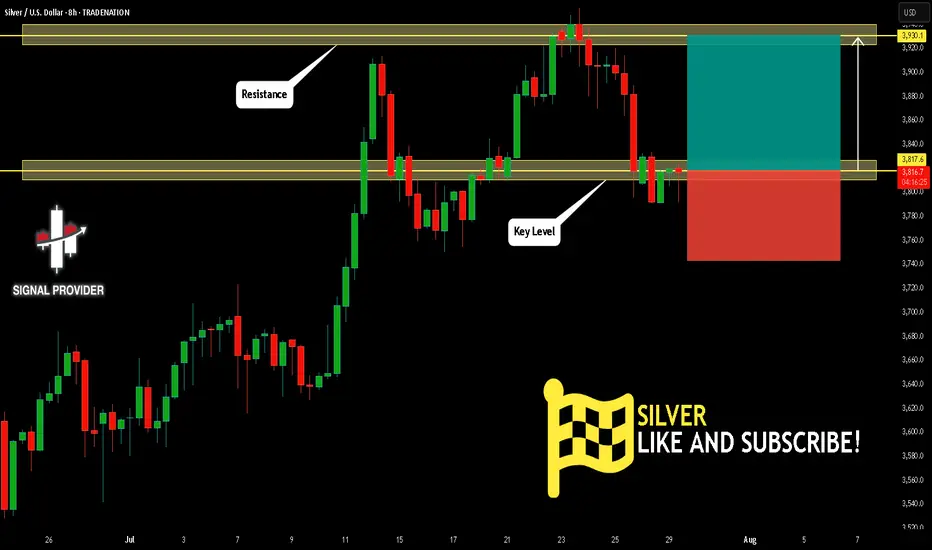
SILVER Will Grow! Buy!
Please, check our technical outlook for SILVER.
Time Frame: 8h
Current Trend: Bullish
Sentiment: Oversold (based on 7-period RSI)
Forecast: Bullish
The market is approaching a significant support area 3,817.6.
The underlined horizontal cluster clearly indicates a highly probable bullish movement with target 3,930.1 level.
P.S
The term oversold refers to a condition where an asset has traded lower in price and has the potential for a price bounce.
Overbought refers to market scenarios where the instrument is traded considerably higher than its fair value. Overvaluation is caused by market sentiments when there is positive news.
Disclosure: I am part of Trade Nation's Influencer program and receive a monthly fee for using their TradingView charts in my analysis.
Like and subscribe and comment my ideas if you enjoy them!
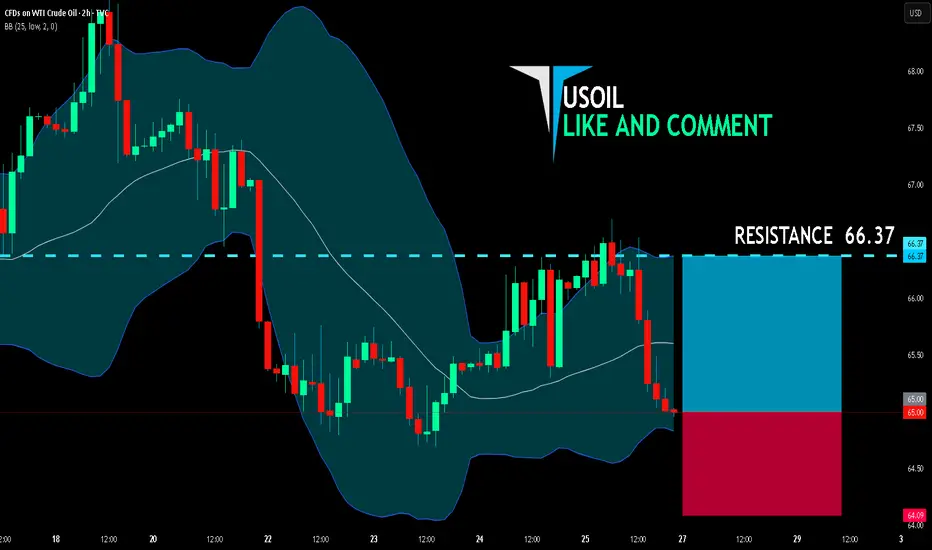
USOIL LONG FROM SUPPORT
USOIL SIGNAL
Trade Direction: long
Entry Level: 65.00
Target Level: 66.37
Stop Loss: 64.09
RISK PROFILE
Risk level: medium
Suggested risk: 1%
Timeframe: 2h
Disclosure: I am part of Trade Nation's Influencer program and receive a monthly fee for using their TradingView charts in my analysis.
✅LIKE AND COMMENT MY IDEAS✅
#011: Long Investment Opportunity on GBP/CAD
After weeks of compression, GBP/CAD is showing clear signs of institutional accumulation. The price recently released a false bearish breakout below 1.8400, followed by a reabsorption and spike with decreasing volumes: a typical "retail flush" structure.
Added to this are clear macro elements:
The pound is supported by a still-tight monetary policy, with the BoE maintaining a hawkish tone.
The Canadian dollar is suffering from declining oil expectations and the risk of a more rapid rate cut by the BoE.
📉 What happened?
The market attempted to "clear" the 1.838–1.840 zone with a rapid, unfollow-through bearish move. This behavior, combined with the Open Interest reading and retail positioning, suggests an institutional entry intention in the area between 1.8375 and 1.8365.
📈 Positioning
A Buy Limit was placed at 1.83740, with a wide Stop Loss at 1.82890, outside any visible hunting zone, and a Take Profit at 1.86280, where profit-taking has historically occurred on similar patterns.
🎯 Main motivations for long
Accumulation visible with stop-hunt below support at 1.8400
Net long GBP futures position
Retail short above 70%, a typical reversal signal
No significant volume obstacles until 1.8620
Psychological resistance already tested (1.846, 1.850)
⏳ Estimated timeframe
The setup could develop over several days, with the first movement as early as today (Friday) and completion by mid-next week. The intention is to follow the banking flow, without anticipating or reacting to emotional price movements.

EURUSD Potential UpsidesHey Traders, in today's trading session we are monitoring EURUSD for a buying opportunity around 1.16 zone, EURUSD is trading in an uptrend and currently is in a correction phase in which it is approaching the trend at 1.16 support and resistance area.
Trade safe, Joe.
Perfect Sync: V Reversal Meets Bull Flag
Two clean and classic technical structures:
✅ V-Reversal Formation
✅ Bull Flag – still active and building pressure
After a sharp reversal, the price entered a bullish continuation phase.
Currently moving within the flag structure toward its upper edge.
If we see a breakout to the upside, the move could match the flagpole length, which aligns well with the target from the V-reversal pattern.
📍 Bullish scenario remains valid as long as we stay within structure.
📉 Breakdown below $570 invalidates this setup.
🧠 Important Reminder:
Enter only after a confirmed breakout.
✅ Apply strict risk management
✅ Never risk more than 1% of your capital on a single position.
Everything’s clear. No noise. Just wait for confirmation — let the market come to you.

HYPE | #12h #long — Major Reversal Setup from 200 EMA & DemandStarted building a position around 42.7 due to the under/over of the H4 EMA 200 and the prior consolidation high. However, there's an untapped H4 demand zone beneath — if we get a flush into that area and then reclaim 41.2 and the H4 EMA 200, I'll be adding to my position.
Invalidation:
Losing the H4 demand would be my cut-off, potentially opening the door for a sweep of the equal lows near 30.
Scenario:
— If the 200 EMA holds or we see #OneMoreLow to trap sellers and reclaim, the setup remains very bullish.
— Targets: At minimum, a stab into ATH, with the potential for a full extension up to 55.3 and beyond.
Reasoning:
This is a classic under/over setup with demand untested and a clear invalidation level. If buyers step in and reclaim key levels, expect explosive continuation.

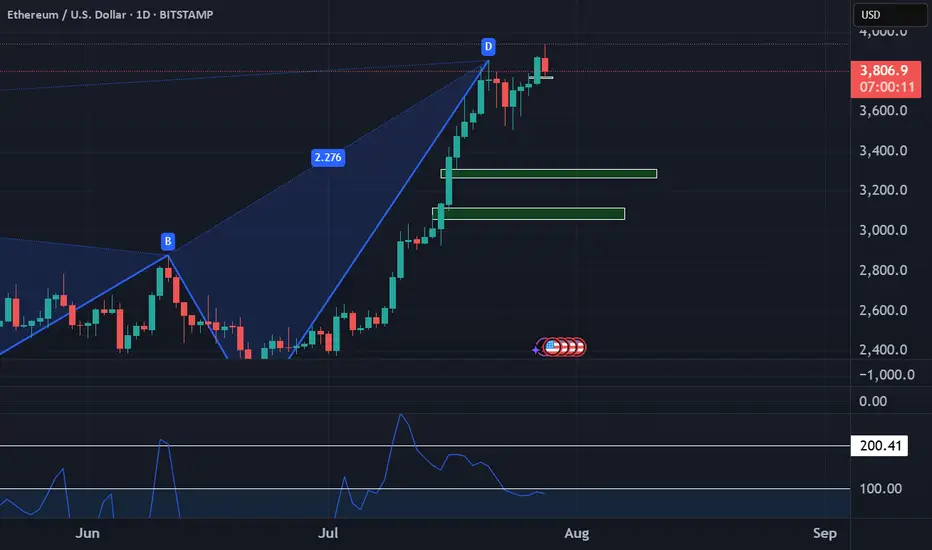
Ethereum bigger pictureToday we are measuring the difference between Ethereum's current price and its average price over a specific period. We see how far the current price deviates from its statistical average. This helps traders identify potential overbought and oversold conditions. Even though institutions and etfs have bought up over 32x the supply of Ether since May, it has showed in the past 36 Days with ether running over 80%, we look at reducing exposure as the risk remains for a correction in the short term.
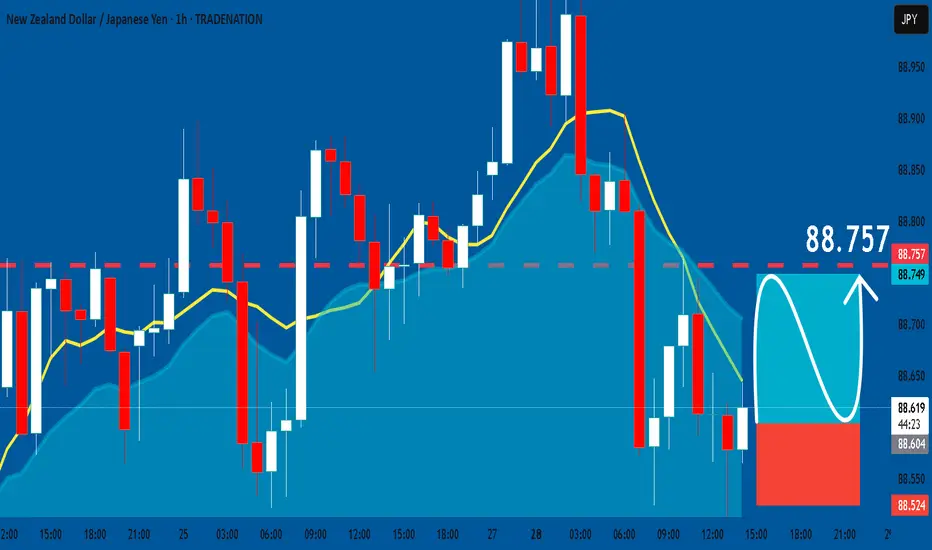
NZDJPY: Free Trading Signal
NZDJPY
- Classic bullish pattern
- Our team expects retracement
SUGGESTED TRADE:
Swing Trade
Buy NZDJPY
Entry - 88.612
Stop - 88.524
Take - 88.757
Our Risk - 1%
Start protection of your profits from lower levels
Disclosure: I am part of Trade Nation's Influencer program and receive a monthly fee for using their TradingView charts in my analysis.
❤️ Please, support our work with like & comment! ❤️