EURJPY Will Explode! BUY!
My dear subscribers,
My technical analysis for EURJPY is below:
The price is coiling around a solid key level - 171.82
Bias - Bullish
Technical Indicators: Pivot Points Low anticipates a potential price reversal.
Super trend shows a clear buy, giving a perfect indicators' convergence.
Goal - 172.34
About Used Indicators:
By the very nature of the supertrend indicator, it offers firm support and resistance levels for traders to enter and exit trades. Additionally, it also provides signals for setting stop losses
Disclosure: I am part of Trade Nation's Influencer program and receive a monthly fee for using their TradingView charts in my analysis.
———————————
WISH YOU ALL LUCK
LONG

GBPAUD Sellers In Panic! BUY!
My dear followers,
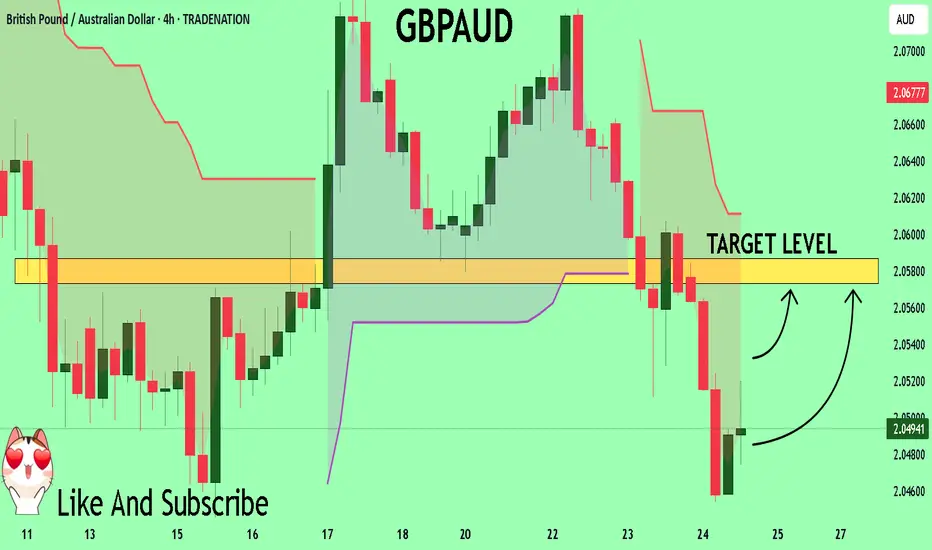
This is my opinion on the GBPAUD next move:
The asset is approaching an important pivot point 2.0491
Bias - Bullish
Technical Indicators: Supper Trend generates a clear long signal while Pivot Point HL is currently determining the overall Bullish trend of the market.
Goal - 2.0573
About Used Indicators:
For more efficient signals, super-trend is used in combination with other indicators like Pivot Points.
Disclosure: I am part of Trade Nation's Influencer program and receive a monthly fee for using their TradingView charts in my analysis.
———————————
WISH YOU ALL LUCK
GBPUSD Massive Long! BUY!
My dear friends,
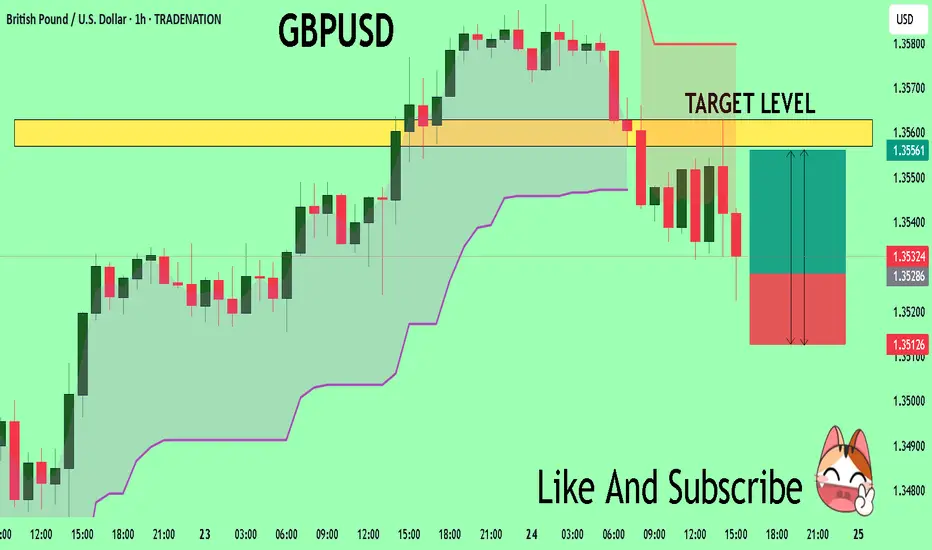
GBPUSD looks like it will make a good move, and here are the details:
The market is trading on 1.3528 pivot level.
Bias - Bullish
Technical Indicators: Supper Trend generates a clear long signal while Pivot Point HL is currently determining the overall Bullish trend of the market.
Goal - 1.3556
Recommended Stop Loss - 1.3512
About Used Indicators:
Pivot points are a great way to identify areas of support and resistance, but they work best when combined with other kinds of technical analysis
Disclosure: I am part of Trade Nation's Influencer program and receive a monthly fee for using their TradingView charts in my analysis.
———————————
WISH YOU ALL LUCK
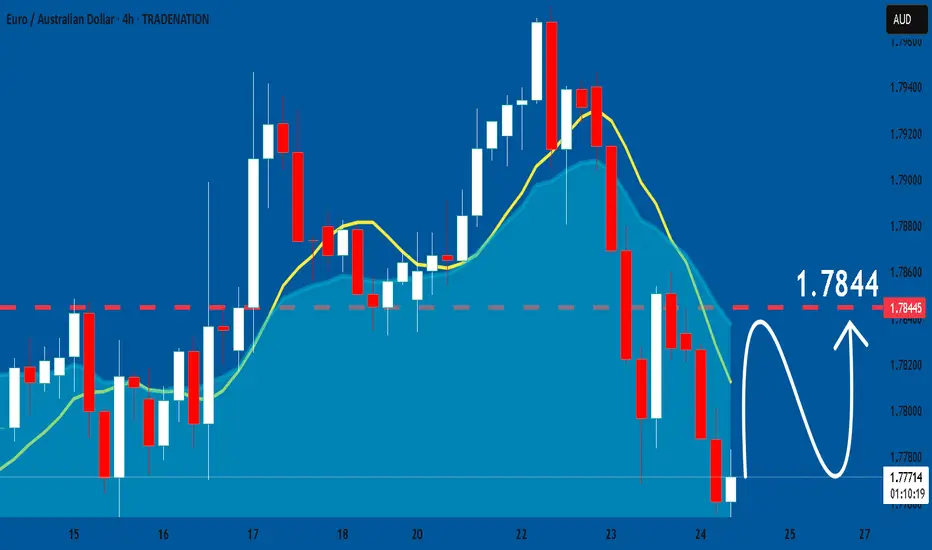
EURAUD: Bullish Forecast & Outlook
Our strategy, polished by years of trial and error has helped us identify what seems to be a great trading opportunity and we are here to share it with you as the time is ripe for us to buy EURAUD.
Disclosure: I am part of Trade Nation's Influencer program and receive a monthly fee for using their TradingView charts in my analysis.
❤️ Please, support our work with like & comment! ❤️
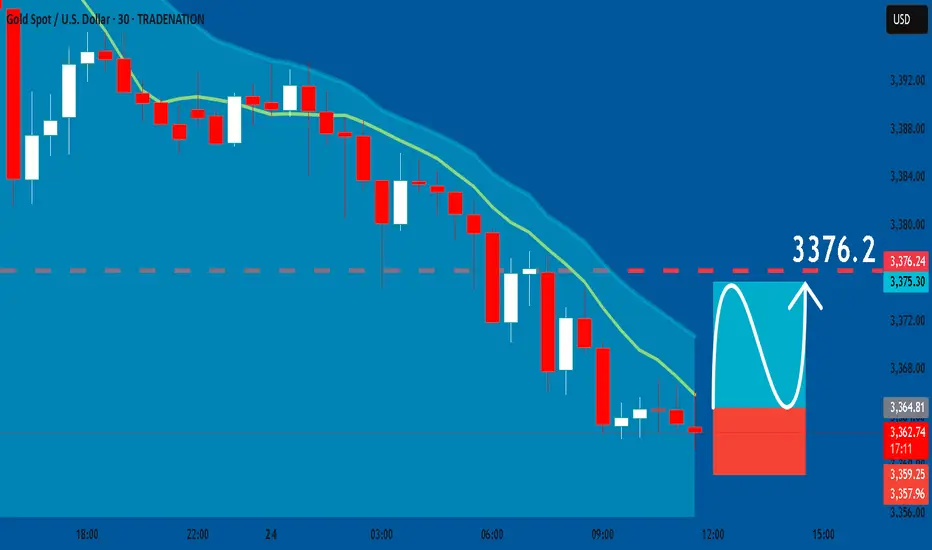
GOLD: Bullish Continuation & Long Signal
GOLD
- Classic bullish formation
- Our team expects growth
SUGGESTED TRADE:
Swing Trade
Buy GOLD
Entry Level - 3364.8
Sl - 3359.2
Tp - 3376.2
Our Risk - 1%
Start protection of your profits from lower levels
Disclosure: I am part of Trade Nation's Influencer program and receive a monthly fee for using their TradingView charts in my analysis.
❤️ Please, support our work with like & comment! ❤️
NC HAMMER CRYPTO find meLooking at omg we see that it is practically dead, however we have seen this before it does a major pump when it gets over the 200EMA like we have seen with XCN… a little goes a long way with this one. ATH roughly $20 currently at $0.20, you do the math on risk vs reward.

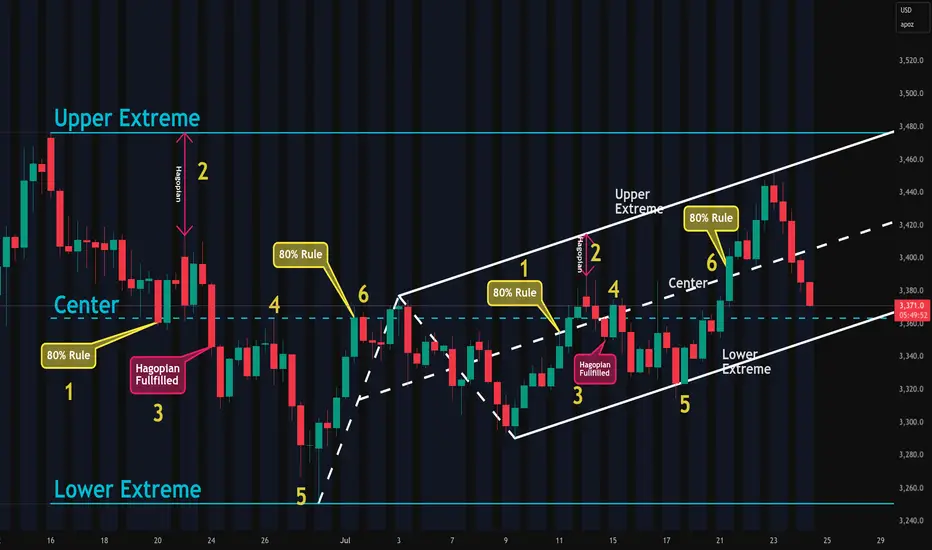
The Edge Of The Fork - The Joker In Your PocketWOW!
\ \ First of all, I want to say THANK YOU for all the boosts, follows, and comments. You guys & gals give me the energy to continue this journey with you.\ \
Today, I want to show you that what we’ve learned with horizontal lines can also be applied to "Medianlines," or Forks.
Listen, I don’t want you to blow your brain with all the rules.
Not at the beginning of this journey, and not later on either.
Don’t ask yourself:
* when to use which Fork
* which swing to measure
* when to trade
* where to set your stop
* what if... bla bla bla
That’s not fun — that’s stress.
I don’t like stress — nobody does.
So let’s just chill and have fun here.
That’s my personal reason for doing all this Trading thing. I want to have fun — the money will take care of itself, just like the destination of a trail takes care of itself, as long as I keep putting one foot in front of the other. And that’s simple, right?
So let’s do it exactly the same way.
Just simple steps, connecting some dots, and BAM! — You’re there before you even know it §8-)
\ Let’s jump to the chart:\
Today, you’ll find out why Medianlines/Forks are a cousin of the horizontal Channel — but NOT the same.
Where are they different?
Forks are different because they’re capable of projecting the most probable path of price. And that’s a HUGE difference.
Yes, you can apply the full rule set of Forks to a horizontal Channel.
But the Channel CANNOT project the most probable path of price.
I hear you, I hear you: "No one and nothing can foresee the future. How is it even possible that Forks can?"
\ Here’s why:\
There’s a thing called "Statistical Importance." And it means that if something happens very often in the same way, we have a higher chance of seeing the same behavior again in the future.
And that’s what the inventor, Allan Andrews, discovered — and he created the rules around his findings.
\ A high probability that price will move in the direction of the projected path, as long as it stays within the boundaries of the Medianlines/Fork.\
That’s the whole "magic" behind Medianlines/Forks.
And the same applies to the "Behavior of Price" within and around Medianlines. That’s really all there is to it.
Look at the chart and compare the Channel and the Fork:
1. Price reaches the Centerline about 80% of the time
2. HAGOPIAN → price goes farther in the opposite direction than where it came from
3. HAGOPIAN’s rule fulfilled
4. Price reaches the Centerline again
5. Price reaches the other extreme
6. Price reaches the Centerline about 80% of the time
You’ll see the same behavior inside the Fork!
That’s beautiful, isn’t it? §8-)
And here’s a little Joker in your pocket — if you know the difference between the Channel and the Forks!
Do you know what it is?
Yep! You’d automatically know the direction to trade — giving you another 10% edge right out of the box — LONG TRADES ONLY. Because the Fork projects the most probable path of price to the upside, not down.
That's all folks §8-)
Like this lesson?
With a simple boost and/or a little comment, you load my Battery so I can continue my next step on the trail with you.
Thank you for spending your time with me §8-)
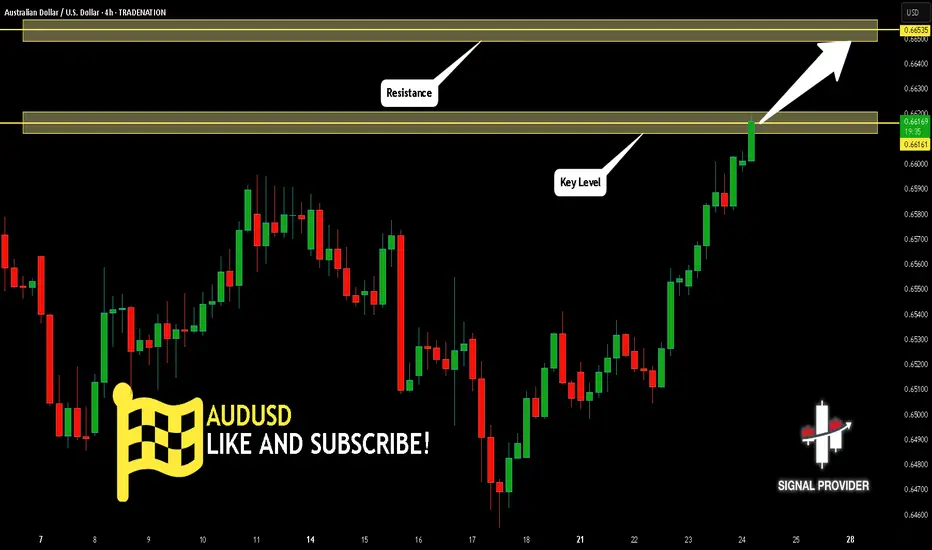
AUDUSD Will Go Up From Support! Long!
Here is our detailed technical review for AUDUSD.
Time Frame: 4h
Current Trend: Bullish
Sentiment: Oversold (based on 7-period RSI)
Forecast: Bullish
The market is on a crucial zone of demand 0.661.
The oversold market condition in a combination with key structure gives us a relatively strong bullish signal with goal 0.665 level.
P.S
Please, note that an oversold/overbought condition can last for a long time, and therefore being oversold/overbought doesn't mean a price rally will come soon, or at all.
Disclosure: I am part of Trade Nation's Influencer program and receive a monthly fee for using their TradingView charts in my analysis.
Like and subscribe and comment my ideas if you enjoy them!
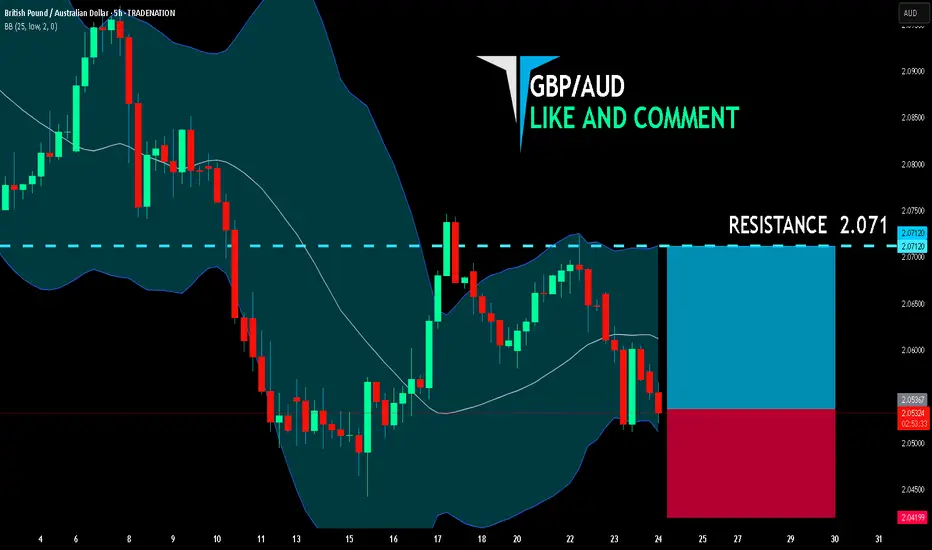
GBP/AUD LONG FROM SUPPORT
GBP/AUD SIGNAL
Trade Direction: long
Entry Level: 2.053
Target Level: 2.071
Stop Loss: 2.041
RISK PROFILE
Risk level: medium
Suggested risk: 1%
Timeframe: 5h
Disclosure: I am part of Trade Nation's Influencer program and receive a monthly fee for using their TradingView charts in my analysis.
✅LIKE AND COMMENT MY IDEAS✅
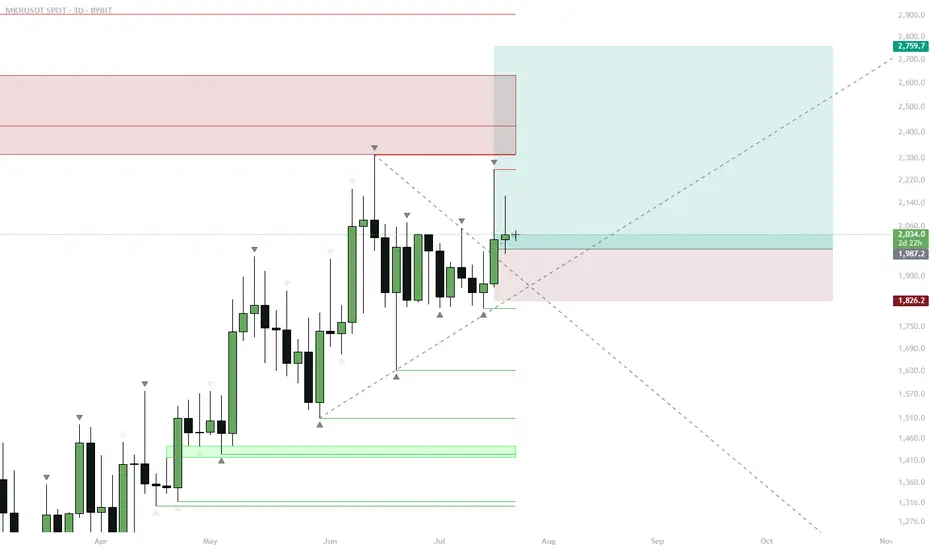
MKR – Bull Pennant Breakout, Eyes on $3000Breakout Confirmation:
MKR has broken out of a daily bull pennant, signaling bullish momentum. The breakout candle reclaimed key HTF S/R (~$1987–$2000 zone) and flipped it to support.
Entry and Risk Zone:
Ideal long entries are on retests of this S/R flip ($1987–$2000). Invalidation below $1826 (recent low and support).
Upside Target:
First target at $2759, full target at $3000 zone, just below the marked supply.
Trade Management:
Trailing stops recommended as price approaches $2750–$2800 to lock in gains.
MKR just broke out of a clean daily bull pennant pattern, confirming a structural shift with a retest and reclaim of high timeframe S/R. This level, previously strong resistance, now acts as support. Combined with the breakout and the momentum from recent market dips, the setup favors continuation to the upside with $2750–$3000 as the likely destination. Failure to hold $1826 invalidates the bullish scenario.
AAVE – Eyeing Reversal From Daily Demand for $400 TargetCurrent Structure:
AAVE recently rejected from 1M S/R at $332.54 and pulled back into a confluence support zone—overlapping 1W order block (OB), 1D OB, and previous resistance now flipped support ($277–$290 zone, marked blue).
Buy Zone:
Watching the blue box area for bullish reversal triggers. This is a high-probability demand zone due to multiple timeframe confluence.
Trigger:
Wait for a bullish reaction/candle confirmation inside the blue zone. Ideal scenario: bullish engulfing, sweep of the low and reclaim, or a strong bounce with rising volume.
Targets:
Primary upside target: retest of the 1M S/R at $332, then continuation toward $400 if momentum sustains.
Invalidation:
If price closes below the 1D OB ($274.84), long setup is invalidated—risk of further downside increases.
AAVE is testing a major support confluence zone, combining weekly and daily order blocks. This area previously acted as resistance and now presents a strong demand zone. If bulls defend this zone and trigger a reversal, there’s a clear runway back to previous highs and potentially $400. This setup offers a favorable risk/reward profile with tight invalidation.

PEPE – Highest Weekly Close in 6 Months: Eyes on New HighsMajor Breakout Level:
Last week’s candle closed above the 1W S/R (~0.000013845), marking the highest weekly close in half a year.
Bullish Structure:
Price reclaimed and closed above a crucial weekly resistance. This flips the structure bullish, increasing odds of continuation.
Next Targets:
Immediate resistance lies near the 1M S/R (around 0.000020193–0.000020272). Break and close above opens way toward the 1.27–1.618 Fib extensions (0.000029793+).
Invalidation:
Failure to hold above the 1W S/R and a weekly close back below (~0.000013845) would invalidate the breakout, putting risk back toward mid-range support (0.000009697).
The weekly close above key resistance signals strong buyer interest and market acceptance of higher prices, especially after a multi-month consolidation. This “highest close in 6 months” is a classic trend continuation setup. The next natural target is the higher time frame resistance (1M S/R), with Fibs aligning to previous price action. Failure to hold the breakout level would suggest a failed move and likely mean-reversion.

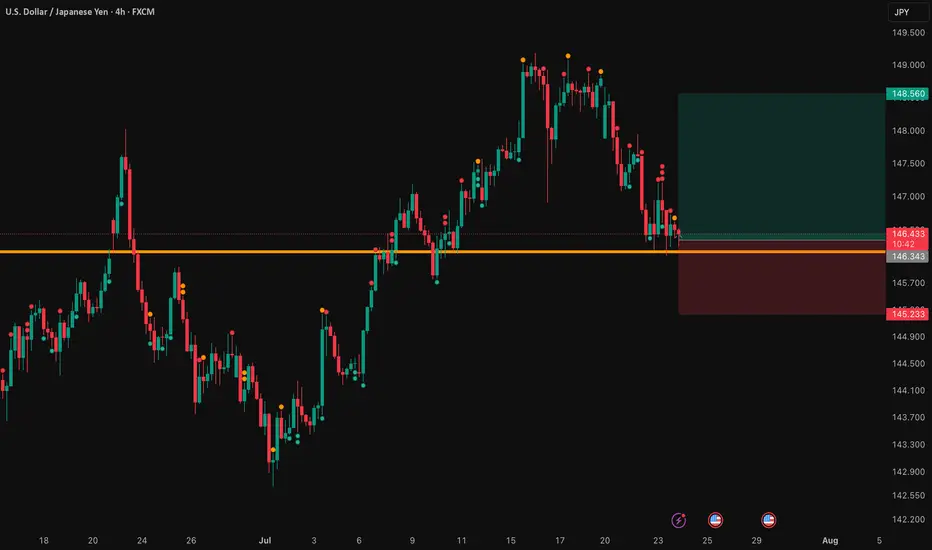
USD/JPY: A Bullish Thesis for Trend ContinuationThis analysis outlines a data-driven, bullish thesis for USD/JPY, identifying a strategic long entry within an established market trend. The setup is supported by a combination of fundamental catalysts and a clear technical structure.
📰 The Fundamental Picture
The primary driver for this trade will be the high-impact US economic data scheduled for release. This release is expected to inject significant volatility into the market. Fundamentally, this trade is a play on the deep policy differences between the US Federal Reserve and the Bank of Japan. While the Fed's future steps are a topic of debate, the Bank of Japan's policy remains one of the most accommodative in the world, creating a long-term headwind for the Japanese Yen. This dynamic provides a strong fundamental basis for relative US Dollar strength against the Yen.
📊 The Technical Structure
Chart analysis reveals that USD/JPY is in a confirmed and healthy uptrend. The current price action indicates a constructive pullback, presenting a strategic opportunity to join the dominant trend at a favorable price. The proposed entry point is positioned at a key technical level that offers a low-risk entry. Technical indicators support the continuation of the trend, suggesting that momentum remains with the bulls.
✅ The Trade Plan
This trade is structured with a clear and favorable risk-to-reward profile, aiming to capitalize on the established trend.
👉 Entry: 146.343
⛔️ Stop Loss: 145.233
🎯 Take Profit: 148.560
⚖️ Risk/Reward Ratio: 1:2
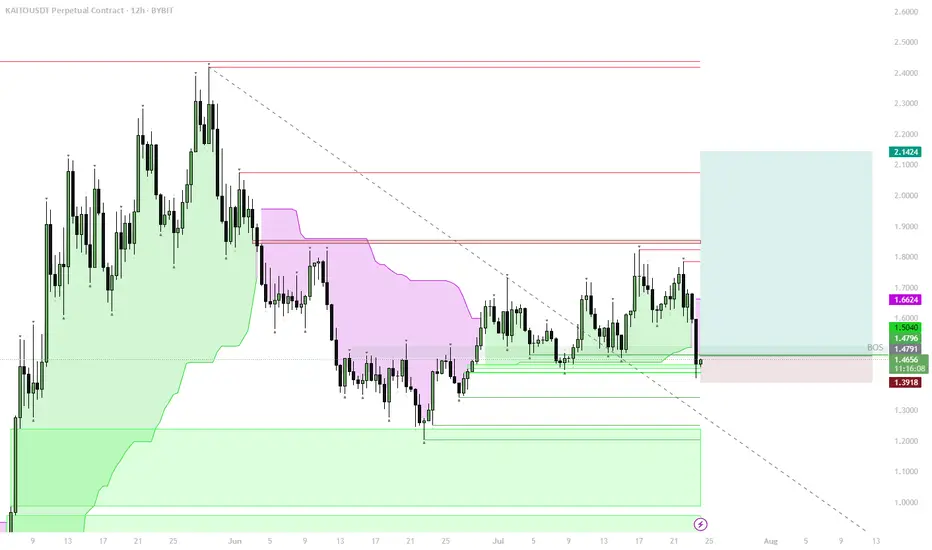
KAITO – Structural Flip, Bullish Accumulation ZoneStructural Shift:
Price reclaimed the key 1D S/R + BOS (Break of Structure) level, signaling a major trend change from bearish to bullish.
Trend Confirmation:
The move above $1.48–$1.50 zone confirms a bullish market structure. This level is now strong support.
Accumulation Opportunity:
The area between $1.65–$1.50 is ideal for spot accumulation, as it aligns with the reclaimed BOS and the lower edge of the bullish structure.
Upside Targets:
If the bullish structure holds, price could target $1.66 (local resistance), with the next targets at $1.85, $2.14, and potentially higher if momentum continues.
Invalidation:
A break and close below $1.48 would invalidate this bullish scenario and signal a return to the previous range.
The reclaim of the BOS level, with a shift above 1D S/R, marks a clear bullish structural flip on the chart. Historically, such shifts create strong accumulation zones just above the reclaimed level, where risk/reward is best for spot buys. Buying into the $1.65–$1.50 range aligns with both trend-following and classic Smart Money concepts: enter after the structural confirmation, not before. Invalidation is clear below $1.48, where structure would flip bearish again.
CRCL – Classic Crypto IPO Fractal in Play?Initial Pump:
Price launched rapidly after listing, forming a local high.
Sideways Phase:
Market settled into a sideways consolidation, typical after the first pump.
Retrace:
A retrace toward the 0.5 Fibonacci zone (~$181.50) is developing. Typical retracement in similar "crypto stonks" ranges from 60-80%.
Accumulation in Demand Zone:
Multiple support levels are stacked between $180–$140, indicating a strong demand zone for accumulation.
True Move Potential:
If the support holds, a new bullish leg could start, targeting Fibonacci extensions ($299, $362, $444). If the support is lost, the next levels are $143 and $100.
This scenario is based on the repeating behavioral fractal seen in high-profile crypto listings: explosive initial move, multi-week consolidation, and a deep retracement before the real trend emerges. Current price is entering the key demand area, which aligns with previous market structure seen on token launches. The risk/reward for new longs becomes attractive here if buyers defend the zone. However, invalidation is clear if price breaks below $140.

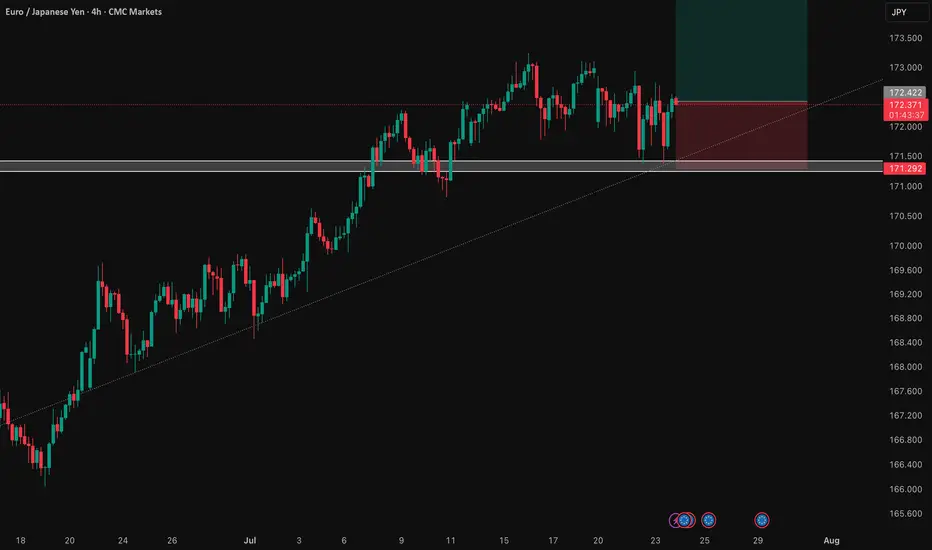
EUR/JPY: Bullish Thesis on Policy DivergenceOur primary thesis is built on a powerful confluence of compelling fundamental drivers and a clear technical structure. We are taking a long position in EUR/JPY with high conviction, anticipating significant upside fueled by a stark monetary policy divergence confirmed by a constructive chart formation.
📰 Fundamental Analysis: The core of this trade is the widening policy gap between the European Central Bank (ECB) and the Bank of Japan (BoJ). While the BoJ is only just beginning to exit its ultra-loose monetary policy, the global environment points toward continued JPY weakness. The upcoming high-impact US news will act as a major catalyst. A "risk-on" reaction to the data would significantly weaken the JPY, providing a strong tailwind for this trade.
📊 Technical Analysis: The chart structure for EUR/JPY is decidedly bullish. The pair has established a clear uptrend, and recent price action indicates a period of healthy consolidation above key support levels. This presents a strategic entry point, as the market appears to be gathering momentum for the next leg higher. The current setup suggests a low-risk entry into a well-defined upward trend.
🧠 The Trade Plan: Based on this synthesis, we are executing a precise trade with a favorable risk profile.
👉 Entry: 172.422
⛔️ Stop Loss: 171.292
🎯 Take Profit: 174.684
⚖️ Risk/Reward: 1:2
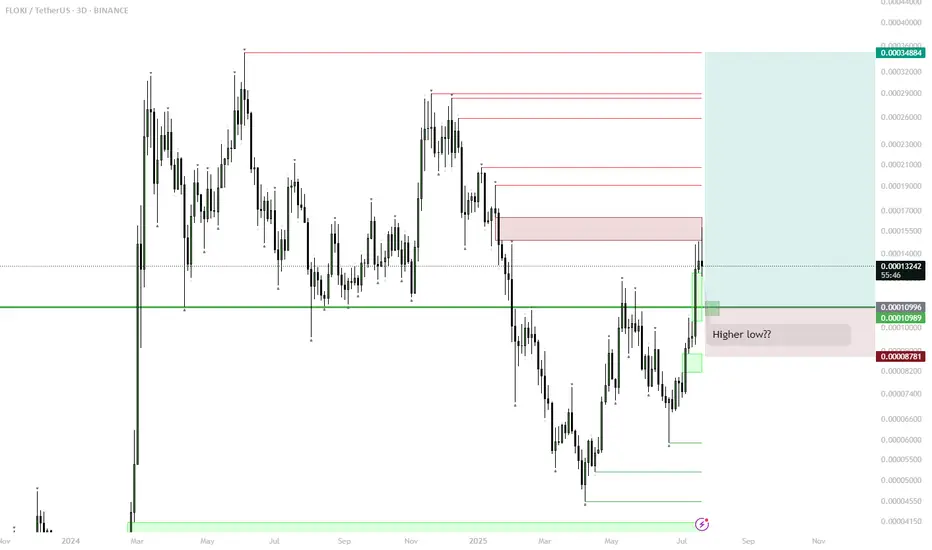
FLOKI – Range Low Setup for Next Big Move? (1D Plan)
FLOKI has reclaimed the key horizontal support, forming a possible higher low.
Currently watching the green box/range low for signs of accumulation (sideways price action) and support confirmation.
If FLOKI establishes a range or shows strength at this zone, look for a long entry with stop below the range.
Upside target is the range high and previous major resistance, offering a potential ~180% move.
Invalidation: clear breakdown and close below the green zone signals failed setup.
FLOKI is showing classic bottoming structure: reclaim of support and formation of a higher low after a prolonged downtrend. Range lows historically have provided major entries for explosive moves. If the green box zone acts as accumulation and price holds, it could set the stage for a rally back to the top of the range as seen before. This setup is favored in meme/altcoin cycles, especially when market sentiment improves. Risk is defined, reward is high.
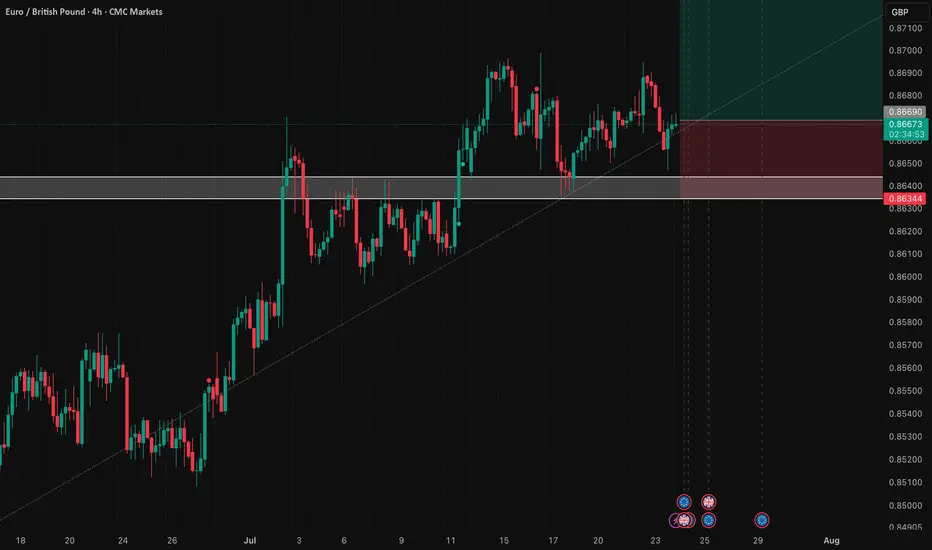
EUR/GBP: Bullish Stance Above 0.8640This signal outlines a tactical long entry on EUR/GBP, positioning for a bullish resolution from today's major fundamental events.
📰 Fundamental Thesis
This position is taken ahead of the two primary market movers: the ECB rate decision and the UK PMI data. The core thesis is that the ECB policy statement will be the dominant catalyst, providing strength to EUR that will outweigh the impact of the UK data release.
📊 Technical Thesis
The trade is defined by a sound technical structure. The stop loss is anchored beneath the critical support zone at 0.8640. The profit target is set to challenge the resistance area just above 0.8722. This setup offers a favorable and clearly defined risk-to-reward profile.
🧠 Risk Management
Execution is timed before extreme event-driven volatility. Adherence to the stop loss is critical to manage the inherent risk of this pre-news strategy.
Trade Parameters
⬆️ Direction: Long (Buy)
➡️ Entry: 0.86690
⛔️ Stop Loss: 0.86344
🎯 Target: 0.87382
✅ Risk/Reward: 1:2
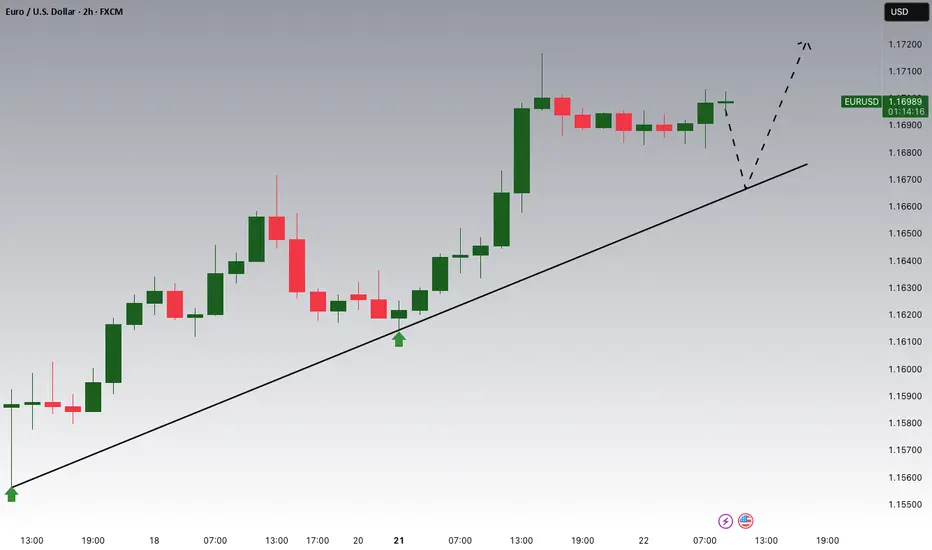
EURUSD Potential UpsidesHey Traders, in today's trading session we are monitoring EURUSD for a buying opportunity around 1.16650 zone, EURUSD is trading in an uptrend and currently is in a correction phase in which it is approaching the trend at 1.16650 support and resistance area.
Trade safe, Joe.
USDCAD: Long Trading Opportunity
USDCAD
- Classic bullish pattern
- Our team expects retracement
SUGGESTED TRADE:
Swing Trade
Buy USDCAD
Entry - 1.3618
Stop - 1.3586
Take - 1.3685
Our Risk - 1%
Start protection of your profits from lower levels
Disclosure: I am part of Trade Nation's Influencer program and receive a monthly fee for using their TradingView charts in my analysis.
❤️ Please, support our work with like & comment! ❤️

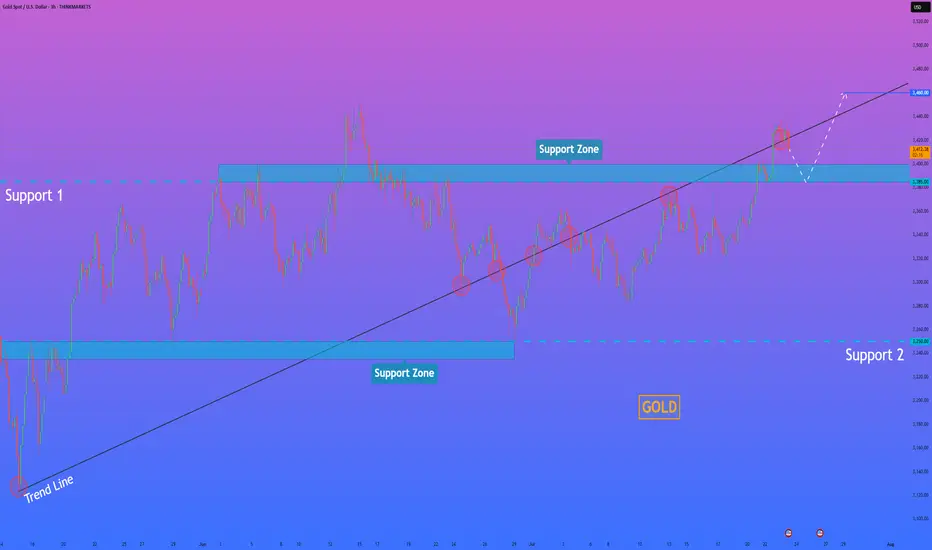
HelenP I. Gold, after small correction, can continue to move upHi folks today I'm prepared for you Gold analytics. If we look at the chart, the dominant feature is a strong, sustained bullish trend defined by a major ascending trend line that has repeatedly served as a reliable foundation for the price, confirming that buyers currently maintain firm control. At present, the price action is consolidating above a crucial horizontal pivot area, the support zone between 3385 and 3400. The significance of this zone is high, as it's a classic polarity point where previous resistance has flipped to become support, suggesting a concentration of buying interest. My core analysis hinges on the scenario of a brief, healthy corrective move down to retest this support zone. I believe this retest is a key market dynamic to confirm buyers' commitment. If the price dips into the 3385-3400 area and is met with a decisive rejection of lower prices, it would provide a powerful signal that the underlying bullish sentiment remains fully intact. A successful defense of this zone would be the primary trigger, creating the momentum for the next upward leg. Therefore, I have set the primary goal for this move at the 3460 level. If you like my analytics you may support me with your like/comment.❤️
Disclaimer: As part of ThinkMarkets’ Influencer Program, I am sponsored to share and publish their charts in my analysis.
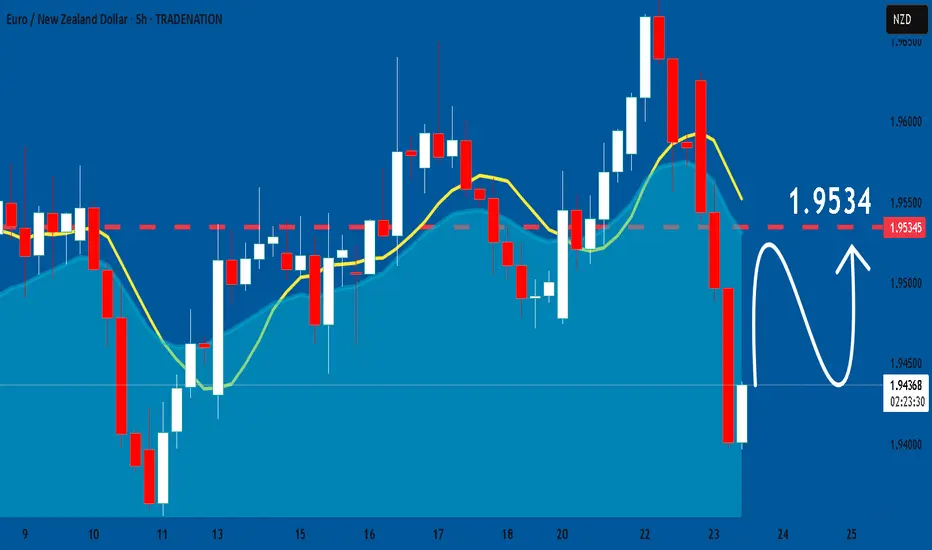
EURNZD: Bulls Will Push Higher
Our strategy, polished by years of trial and error has helped us identify what seems to be a great trading opportunity and we are here to share it with you as the time is ripe for us to buy EURNZD.
Disclosure: I am part of Trade Nation's Influencer program and receive a monthly fee for using their TradingView charts in my analysis.
❤️ Please, support our work with like & comment! ❤️
EURGBP: Will Keep Growing! Here is Why:
The recent price action on the EURGBP pair was keeping me on the fence, however, my bias is slowly but surely changing into the bullish one and I think we will see the price go up.
Disclosure: I am part of Trade Nation's Influencer program and receive a monthly fee for using their TradingView charts in my analysis.
❤️ Please, support our work with like & comment! ❤️
