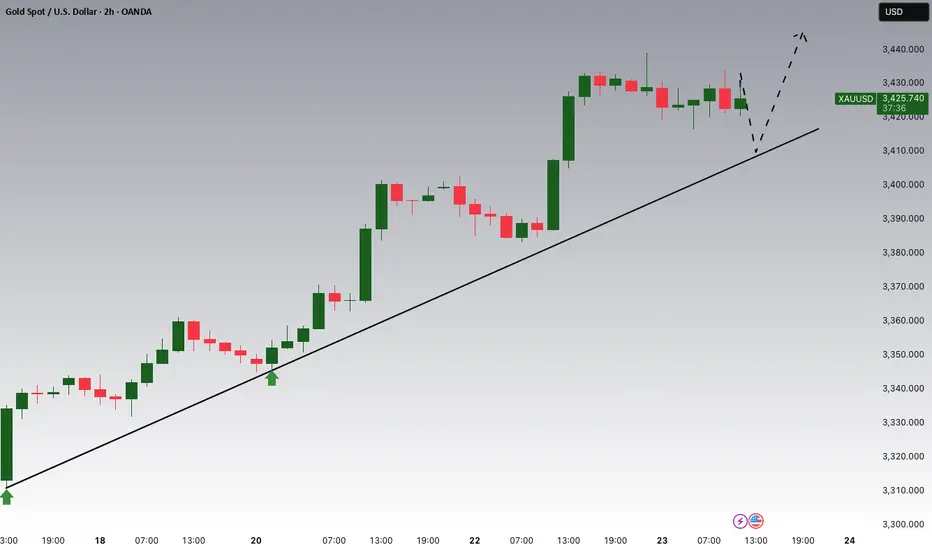
Gold is Targeting Fresh HighsHey Traders, in today's trading session we are monitoring Gold for a buying opportunity around 3,410 zone, Gold is trading in an uptrend and currently is in a correction phase in which it is approaching the trend at 3,410 support and resistance area.
Trade safe, Joe.
LONG
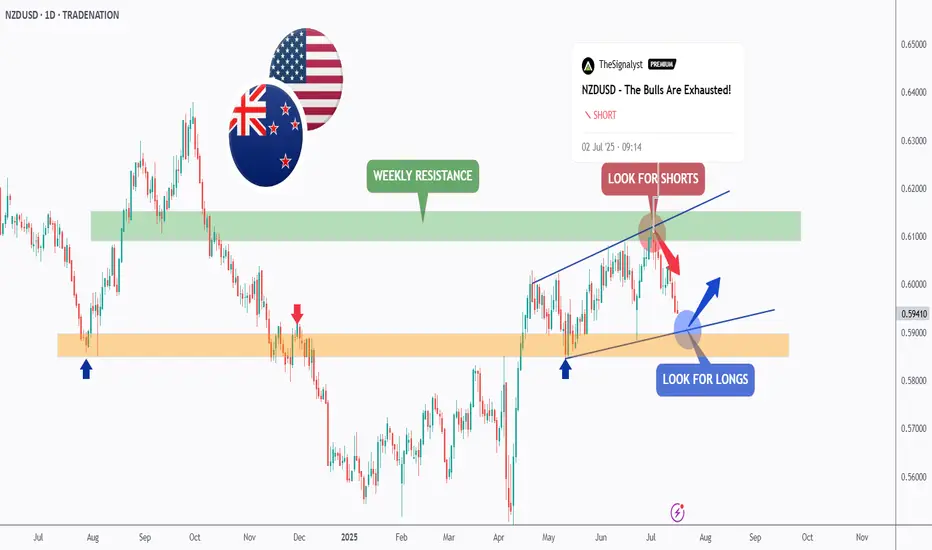
NZDUSD - It is Time!Hello TradingView Family / Fellow Traders. This is Richard, also known as theSignalyst.
As per our last NZDUSD analysis, attached on the chart, it rejected the upper bound of the blue wedge pattern and traded lower.
📈This week, NZDUSD is retesting the lower bound of the wedge.
Moreover, the orange zone is a strong weekly support.
🏹 Thus, the highlighted blue circle is a strong area to look for buy setups as it is the intersection of the lower blue trendline and orange support.
📚 As per my trading style:
As #NZDUSD approaches the blue circle zone, I will be looking for bullish reversal setups (like a double bottom pattern, trendline break , and so on...)
📚 Always follow your trading plan regarding entry, risk management, and trade management.
Good luck!
All Strategies Are Good; If Managed Properly!
~Rich
Disclosure: I am part of Trade Nation's Influencer program and receive a monthly fee for using their TradingView charts in my analysis.
GOLD Will Go Up! Buy!
Please, check our technical outlook for GOLD.
Time Frame: 2h
Current Trend: Bullish
Sentiment: Oversold (based on 7-period RSI)
Forecast: Bullish
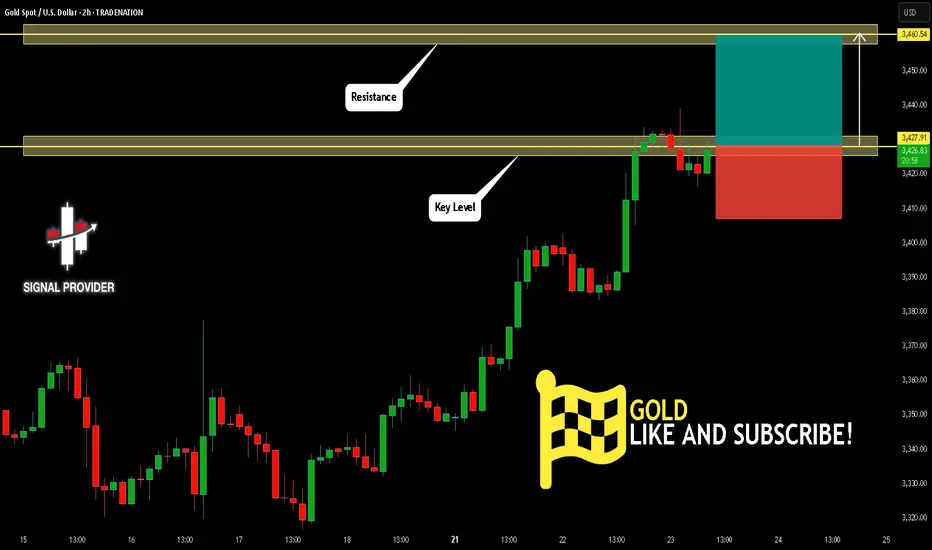
The market is trading around a solid horizontal structure 3,427.91.
The above observations make me that the market will inevitably achieve 3,460.54 level.
P.S
We determine oversold/overbought condition with RSI indicator.
When it drops below 30 - the market is considered to be oversold.
When it bounces above 70 - the market is considered to be overbought.
Disclosure: I am part of Trade Nation's Influencer program and receive a monthly fee for using their TradingView charts in my analysis.
Like and subscribe and comment my ideas if you enjoy them!
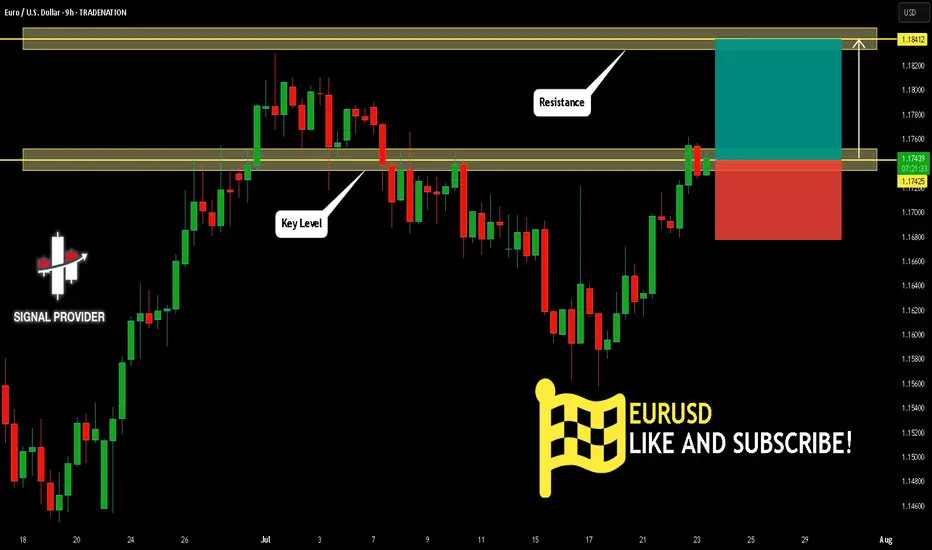
EURUSD Will Move Higher! Long!
Here is our detailed technical review for EURUSD.
Time Frame: 9h
Current Trend: Bullish
Sentiment: Oversold (based on 7-period RSI)
Forecast: Bullish
The market is testing a major horizontal structure 1.174.
Taking into consideration the structure & trend analysis, I believe that the market will reach 1.184 level soon.
P.S
Overbought describes a period of time where there has been a significant and consistent upward move in price over a period of time without much pullback.
Disclosure: I am part of Trade Nation's Influencer program and receive a monthly fee for using their TradingView charts in my analysis.
Like and subscribe and comment my ideas if you enjoy them!
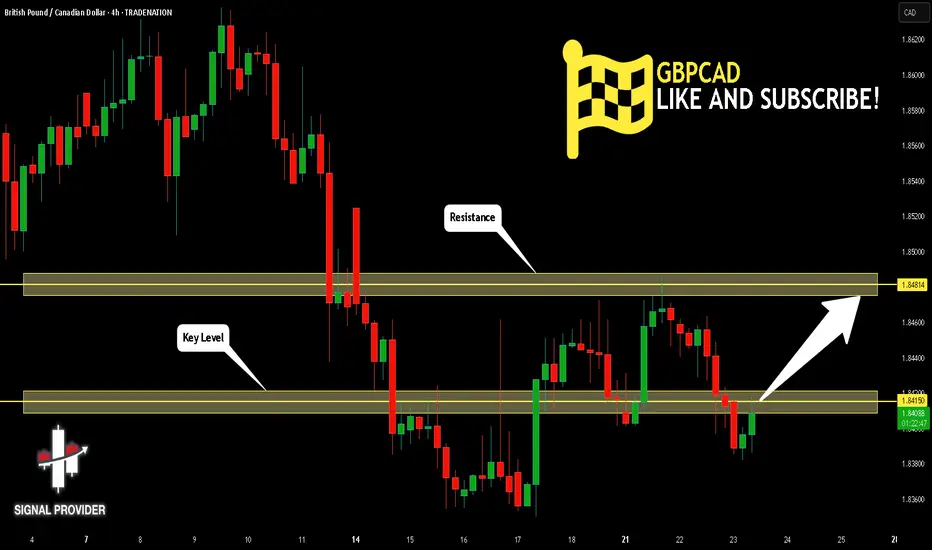
GBPCAD Is Very Bullish! Buy!
Please, check our technical outlook for GBPCAD.
Time Frame: 4h
Current Trend: Bullish
Sentiment: Oversold (based on 7-period RSI)
Forecast: Bullish
The market is approaching a significant support area 1.841.
The underlined horizontal cluster clearly indicates a highly probable bullish movement with target 1.848 level.
P.S
The term oversold refers to a condition where an asset has traded lower in price and has the potential for a price bounce.
Overbought refers to market scenarios where the instrument is traded considerably higher than its fair value. Overvaluation is caused by market sentiments when there is positive news.
Disclosure: I am part of Trade Nation's Influencer program and receive a monthly fee for using their TradingView charts in my analysis.
Like and subscribe and comment my ideas if you enjoy them!
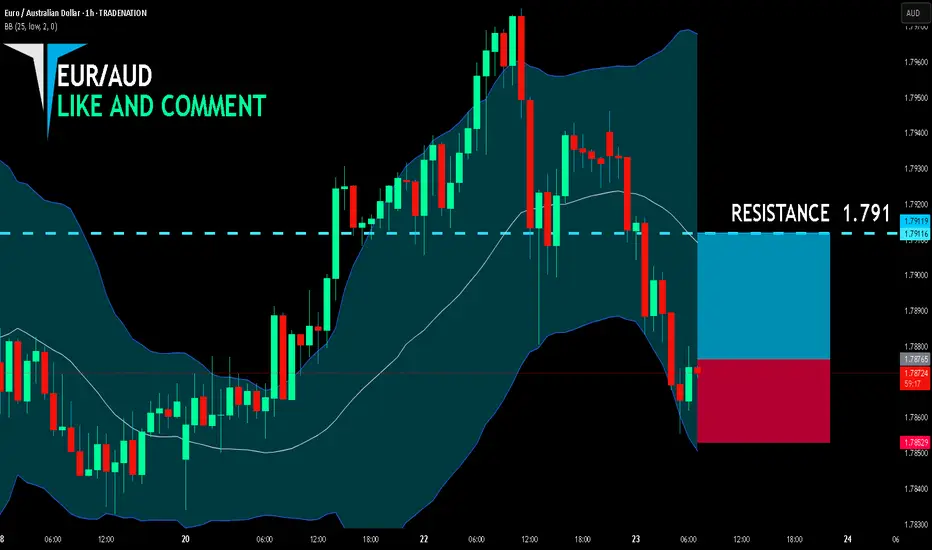
EUR/AUD BUYERS WILL DOMINATE THE MARKET|LONG
EUR/AUD SIGNAL
Trade Direction: long
Entry Level: 1.787
Target Level: 1.791
Stop Loss: 1.785
RISK PROFILE
Risk level: medium
Suggested risk: 1%
Timeframe: 1h
Disclosure: I am part of Trade Nation's Influencer program and receive a monthly fee for using their TradingView charts in my analysis.
✅LIKE AND COMMENT MY IDEAS✅
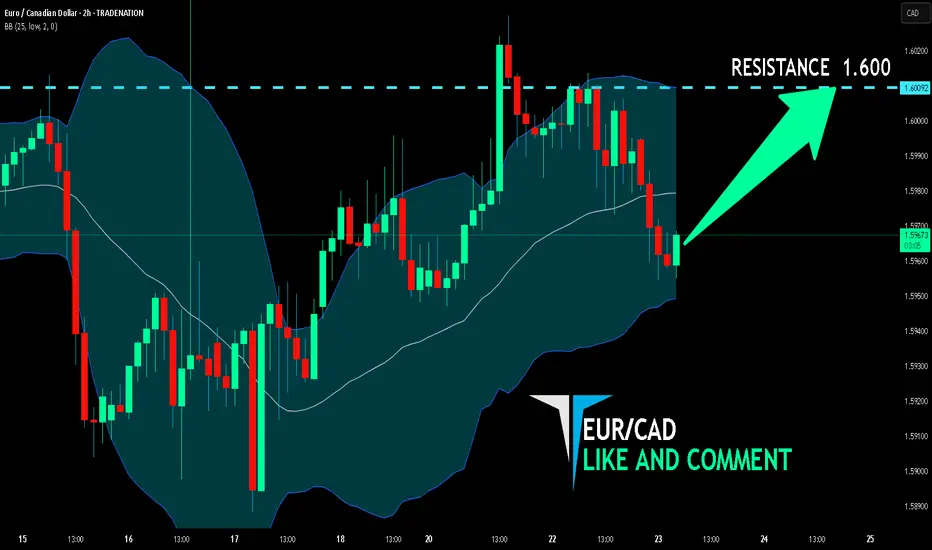
EUR/CAD BULLISH BIAS RIGHT NOW| LONG
Hello, Friends!
Previous week’s red candle means that for us the EUR/CAD pair is in the downtrend. And the current movement leg was also down but the support line will be hit soon and lower BB band proximity will signal an oversold condition so we will go for a counter-trend long trade with the target being at 1.600.
Disclosure: I am part of Trade Nation's Influencer program and receive a monthly fee for using their TradingView charts in my analysis.
✅LIKE AND COMMENT MY IDEAS✅
Gold Approaches Key Resistance Within Bullish Channel – BreakoutCurrent Price Action:
Gold is currently trading at around $3,442, nearing the upper boundary of a well-defined upward-sloping channel. The latest candle shows bullish momentum with a strong close near the daily high, indicating continued buying pressure.
Key Observations:
Trend Structure:
The overall trend remains bullish, with higher highs and higher lows clearly visible.
Price is approaching a critical Fibonacci extension level (1.618), which could act as resistance.
Channel Dynamics:
Price is within a parallel ascending channel.
It is currently testing the upper channel boundary, which may either lead to a breakout or a rejection.
Support & Resistance Levels:
Immediate resistance: $3,442 (Fibonacci extension & channel resistance).
Major resistance: $3,500 (ATH - All-Time High).
Key support levels: $3,275, $3,114, and $3,057 (marked horizontal levels, also align with Fibonacci retracement zones).
Rejection Zones:
Historically, price has reversed at similar extension levels.
If rejection occurs, a pullback to the midline or lower channel boundary is likely.
Forecast:
If the current bullish momentum continues and price breaks above the channel resistance, we could see a move toward the ATH at $3,500 and potentially higher.
However, if the price faces resistance and fails to break above $3,442–$3,450, a short-term pullback to around $3,275–$3,114 is possible. This would offer a healthier correction within the broader uptrend.
The bullish structure remains valid as long as price stays above $3,057.

bch buy midterm"🌟 Welcome to Golden Candle! 🌟
We're a team of 📈 passionate traders 📉 who love sharing our 🔍 technical analysis insights 🔎 with the TradingView community. 🌎
Our goal is to provide 💡 valuable perspectives 💡 on market trends and patterns, but 🚫 please note that our analyses are not intended as buy or sell recommendations. 🚫
Instead, they reflect our own 💭 personal attitudes and thoughts. 💭
Follow along and 📚 learn 📚 from our analyses! 📊💡"

The Great Gas Heist: Load Your Longs Before It Blows💎🚨“Operation Gas Vault: NG1! Breakout Robbery Blueprint”🚨💎
🌟Hi! Hola! Ola! Bonjour! Hallo! Marhaba!🌟
Welcome to all my Market Hustlers & Silent Robbers 🕵️♂️💼💰
Today’s target: NG1! Henry Hub Natural Gas Futures
📍Strategy: A bullish heist mission with a calculated escape plan.
🔥Thief Trading Blueprint: Gas Market Heist🔥
🎯 Entry Gameplan
“The vault cracks open at 3.630 – That’s your cue.”
Wait for resistance breakout 🧱 (around 3.630) – that’s the signal.
Set Buy Stop orders above the Moving Average.
Or, use a layered DCA entry via Limit Orders near swing highs/lows (15m or 30m timeframe).
Thief Tip: Set an alert/alarm so you don’t miss the breakout bang 🔔💥
🛡 Stop Loss Setup (Post-Breakout Only!)
“Don’t be reckless. No SL before breakout — wait for confirmation.”
SL Location: Swing low (4H) near 3.370.
Set SL after breakout happens, not before.
Adjust based on your risk tolerance, lot size & number of open entries.
⚠️ Placing early SL = triggering the trap before the door opens.
🏴☠️ Loot Target 🎯
Take Profit Zone: 4.100
Escape Tip: No need to be greedy. Take profit before the police arrive (resistance)!
🧲 Scalper’s Shortcut
Only go Long – avoid fighting the current.
If you’ve got cash flow, strike early. If not, ride with the swing crew.
Use trailing SL to protect your stack 💼📉
📊 Fundamental Clues Behind the Heist
The gas vault is heating up thanks to:
🔥COT Reports
🛢 Inventory & Storage data
📈 Seasonal trends
💹 Sentiment flows
⚖ Intermarket linkages
Checkk your own global indicators 🌍🔗 – don’t enter blindfolded.
🗞️ News Traps & Position Protection
Avoid new entries during major news releases 📰🚫
Trail stops to guard running positions
Markets react fast. Adapt even faster.
⚠️ Disclaimer: This is educational info, not personal investment advice. Your money, your risk, your decisions.
💥 Support the Robbery Squad 💥
If you vibe with the Thief Trading Style, smash that Boost Button 💖
Grow the gang, expand the vaults, and master this money maze together! 🤑🏆🚀
Stay tuned – another heist plan is on the way.
Until then, trade smart, trade sharp. 👊🕶💼
🔒#NaturalGas #ThiefTrading #BreakoutStrategy #SwingTrade #FuturesHeist #NG1Plan #RobTheMarket

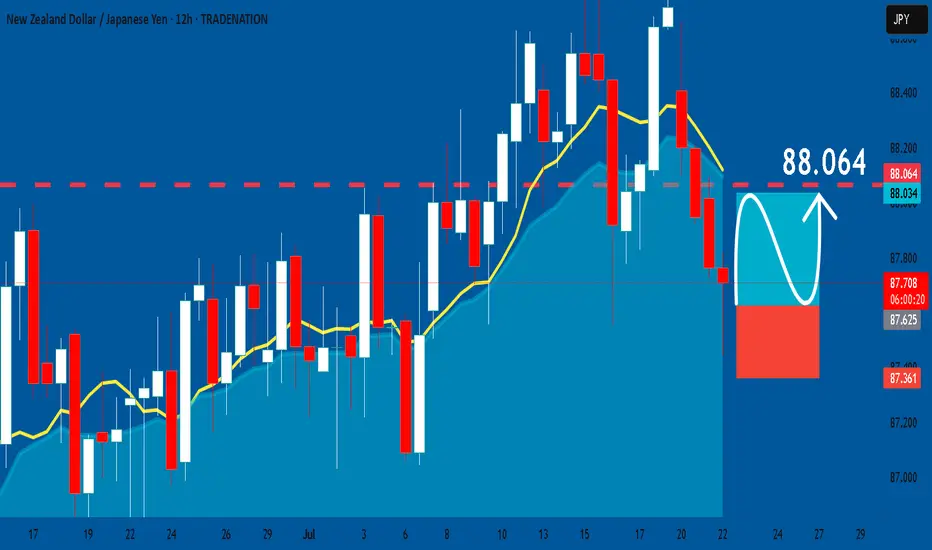
NZDJPY: Long Trade Explained
NZDJPY
- Classic bullish setup
- Our team expects bullish continuation
SUGGESTED TRADE:
Swing Trade
Long NZDJPY
Entry Point - 87.616
Stop Loss - 87.361
Take Profit - 88.064
Our Risk - 1%
Start protection of your profits from lower levels
Disclosure: I am part of Trade Nation's Influencer program and receive a monthly fee for using their TradingView charts in my analysis.
❤️ Please, support our work with like & comment! ❤️
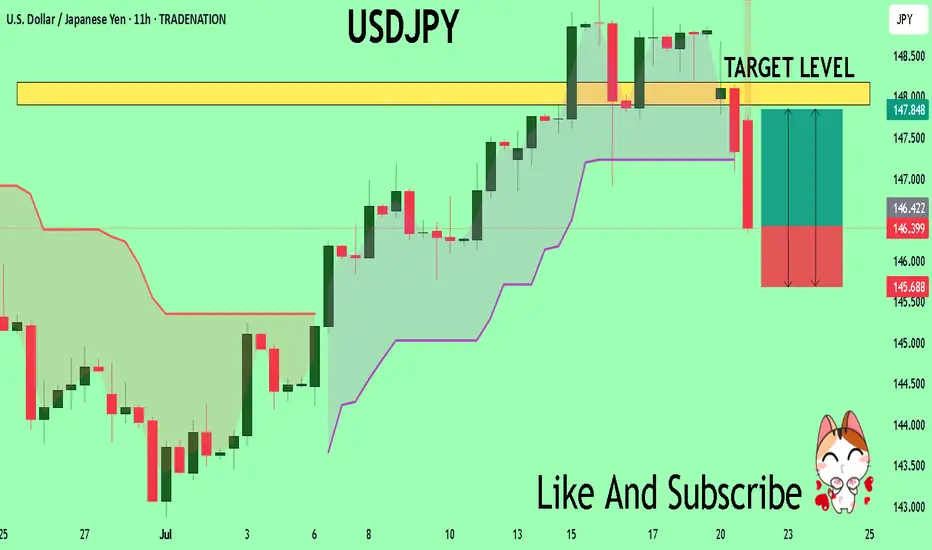
USDJPY Sellers In Panic! BUY!
My dear subscribers,
My technical analysis for USDJPY is below:
The price is coiling around a solid key level - 146.36
Bias - Bullish
Technical Indicators: Pivot Points Low anticipates a potential price reversal.
Super trend shows a clear buy, giving a perfect indicators' convergence.
Goal - 147.90
My Stop Loss - 145.68
About Used Indicators:
By the very nature of the supertrend indicator, it offers firm support and resistance levels for traders to enter and exit trades. Additionally, it also provides signals for setting stop losses
Disclosure: I am part of Trade Nation's Influencer program and receive a monthly fee for using their TradingView charts in my analysis.
———————————
WISH YOU ALL LUCK
ETH — Perfect Long Play: Pullback & 1W Breaker Reclaim
After the strong move, price is likely to retrace as longs get trapped and late buyers take profit.
Best scenario: ETH pulls back to the 1W breaker zone ($3,141–$3,456), which previously acted as resistance and could now flip into support.
Watch for bullish reaction and confirmation in the 1W breaker zone.
If support holds, enter long — targeting a return to the range high and then the liquidity zone ($4,108+).
Invalidation if ETH closes below the 1W breaker or loses range low ($2,876) support.
ETH has rallied hard. After such a move, it’s normal for price to pull back and test old resistance as new support. The ideal long is on confirmation of a bounce from the 1W breaker zone, which keeps risk controlled and sets up for a continuation move higher. This approach avoids FOMO and protects against reversal if the breakout fails.

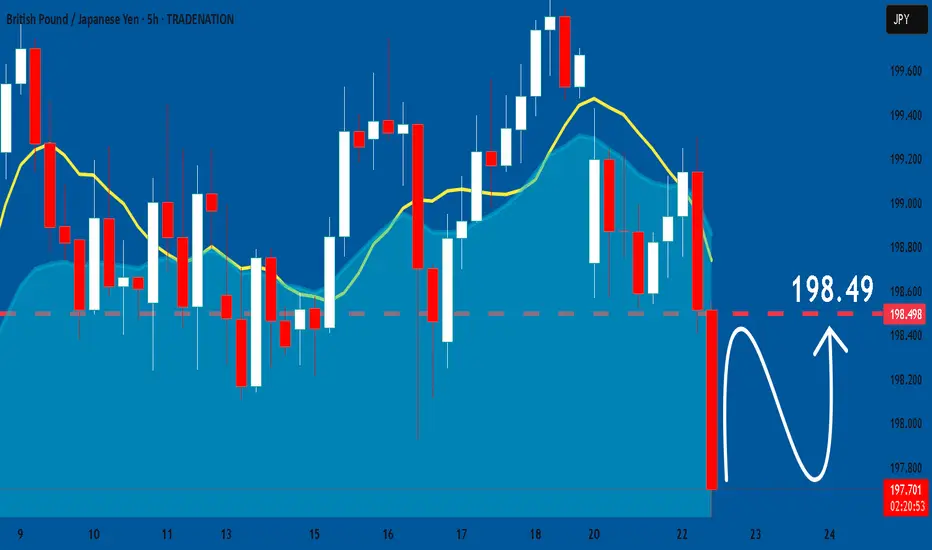
GBPJPY: Swing Trading & Technical Analysis
It is essential that we apply multitimeframe technical analysis and there is no better example of why that is the case than the current GBPJPY chart which, if analyzed properly, clearly points in the upward direction.
Disclosure: I am part of Trade Nation's Influencer program and receive a monthly fee for using their TradingView charts in my analysis.
❤️ Please, support our work with like & comment! ❤️
ENA — Range Deviation & Reclaim: LTF Long Setup
ENA traded in a tight LTF range, then deviated below support, forming a sweep/liquidity grab.
Price quickly reclaimed the range low and retested the FVG (Fair Value Gap) below the range.
This reclaim/flip is a classic bullish reversal setup after a sweep.
Entry on the retest of FVG and previous support, targeting a move back to mid-range and then range highs.
Invalidation below the deviation low (stop).
Price action shows a textbook range deviation and reclaim setup. ENA swept liquidity below the range, trapped shorts, and reclaimed support, forming a bullish reversal signal. The retest of the FVG provided a high-probability entry for a move back to the range highs. This play relies on the principle that deviation and reclaim below a range often leads to a reversal as trapped sellers are forced to cover.

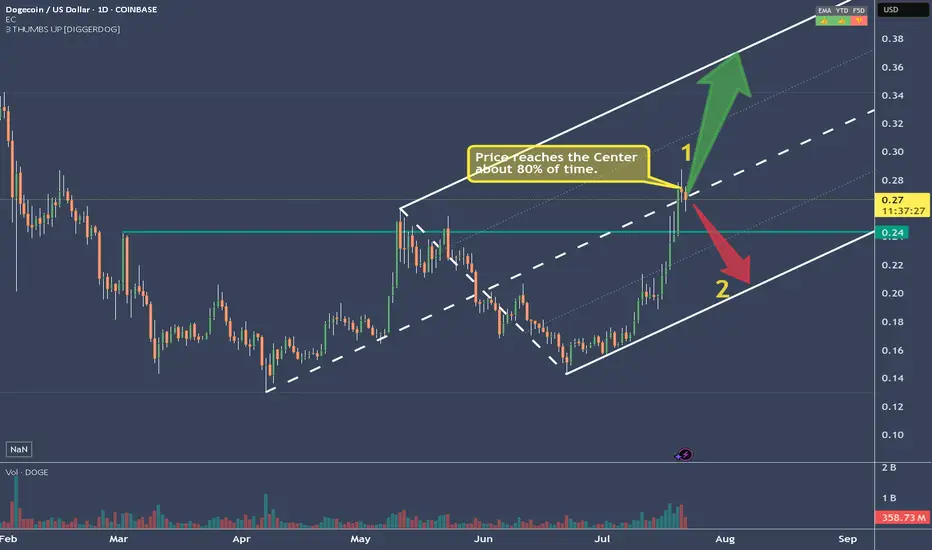
DOGEUSD Has reached it's (first?) targetAfter reaching the Centerline, price eitheradvances to the Upper Extreme (U-MLH), or it reverses and it's target is the L-MLH, the lower Extreme of the Fork.
An Open & Close below the Centerline would indicate further progress to the downside.
A stop above the last high with a target around 2 would be the trade I would take.
80% Of Time - A Trading Edge You Don't Want To MissDo you want to know why trading with median lines, also known as pitchforks, can be so successful? It’s simple:
Prices swing from one extreme back to the middle.
From the middle, they often swing to the other extreme.
What do we see on the chart?
- The upper extreme
- The center
- The lower extreme
So far, so good.
Now let’s follow the price and learn a few important rules that belong to the rulebook of median lines/pitchforks, and with which you can make great trades.
Point 1
The price starts and is sold off down to…
Point 2
...and from there starts to rise again, up to…
Point 3
...which is the center. And here we have a rule that is very important and one that you need to be aware of in trading to be successful:
THE PRICE RETURNS TO THE CENTER IN ABOUT 80% OF ALL CASES
If we know this, then we can stay in a trade with confidence.
Point 4
The price climbed even higher but missed the upper extreme.
This is the “Hagopian Rule” (named after the man who discovered it).
And the rule goes: If the price does not reach the next line (upper extreme, lower extreme, or center), then the price will continue moving in the opposite direction from where it originally came.
Phew...that’s a mouthful ;-)
But yes, we actually see that the price does exactly this.
From point 4, where the price missed the upper extreme, the price not only goes back to the center but continues and almost reaches the lower extreme!
Now if that isn’t cool, I don’t know what is!
And what do we have at point 5?
A "HAGOPIAN"!
What did we just learn?
The price should go higher than the center line.
Does it do that?
Oh yes!
But wait!
Not only does the Hagopian Rule apply. Remember?
"The price returns to the center line in about 80% of the cases."
HA!
Interesting or interesting?
So, that’s it.
That’s enough for now.
Now follow the price yourself and always consider which rule applies and whether it’s being followed.
How exactly do you trade all this, and what are the setups?
...one step at a time.
Don’t miss the next lesson and follow me here on TradingView.
Wishing you lots of success and fun!

ETHUSD - Decision TimeWhat do make of the current situation?
What if you are long?
Here's what to expect:
a) support at the U-MLH, further advancing up to the WL
b) open & close within the Fork. If so, there's a 95% Chance of price dumping down to the Centerline.
Taking 50% off the table is never bad.
50% money in the pocket if price falls down to the Centerline.
Or if it advances up to the WL, you still have 50% that generates profits.
Either way, you have a winner on your hands.
Don't let it dig into a Looser!

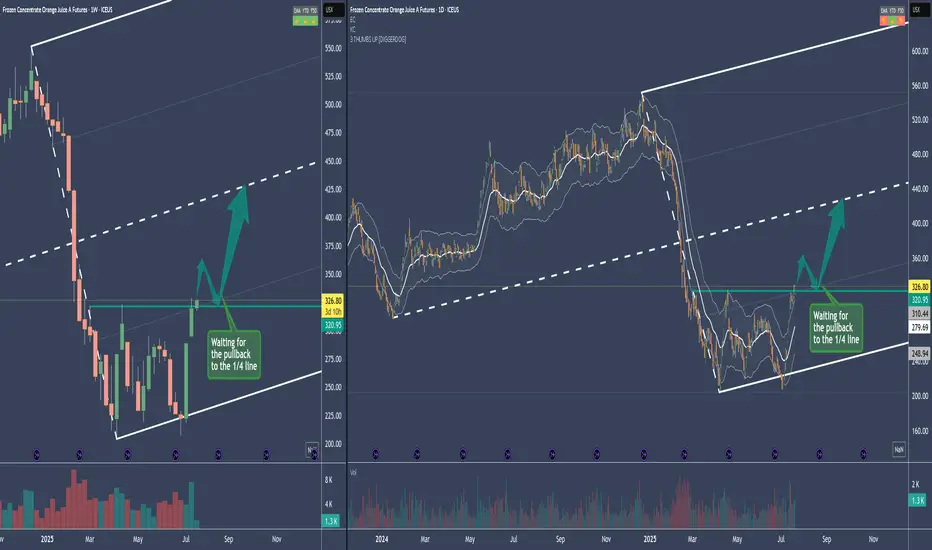
OJ - Frozen Orange Juice Long SetupThe Medianline se aka Fork, is a pullback Fork.
So what we want to see is a reversion to the mean after this drop.
The sideways action from Mar. to Jul. is a "loading" period, where Commercials load their boat.
If we break the resistance, it's usual that there will be a pullback to the prior resistance - now support. Or even into the loading zone.
Entries will be on a intraday basis.
Stalker mode on 88-)
#012: LONG Investment Opportunity on EUR/USD
In this scenario, I placed a passive long order on EUR/USD at a key zone that has shown signs of accumulation and institutional defense in recent days.
The price showed bearish manipulation followed by a sharp rebound with a V-shaped pattern, often indicative of stop-loss hunting. In these phases, a direct entry is less effective than a passive strategy aimed at intercepting a possible technical pullback in the zone where abnormal volumes and algorithmic defenses have manifested.
The order was designed to be activated only if the market were to temporarily return to the previously absorbed zone, thus avoiding chasing the price after a directional candlestick.
The stop-loss placement was carefully chosen to avoid both typical retail hunting zones and areas visible to algorithms. It is positioned to ensure operational invisibility, but also consistency with the logic of institutional defense: if reached, the trade will be automatically invalidated.
The target is aligned with the superior technical structure and the normal range of movement that develops when this dynamic is respected.
This operation is designed to be left to operate completely autonomously, without the need for adjustments or active management. Either in or out. The sole objective is to align with institutional flows, with controlled risk and a favorable management structure.
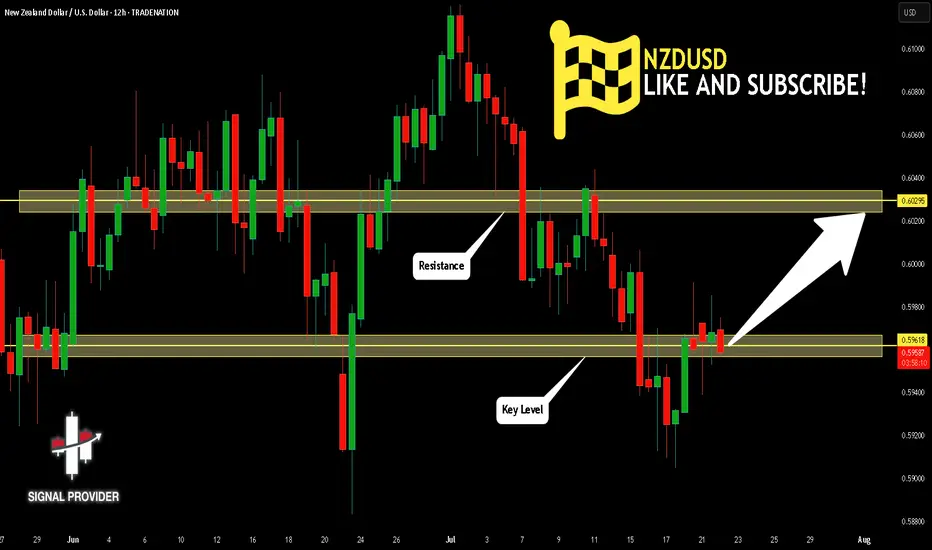
NZDUSD Will Go Higher From Support! Long!
Please, check our technical outlook for NZDUSD.
Time Frame: 12h
Current Trend: Bullish
Sentiment: Oversold (based on 7-period RSI)
Forecast: Bullish
The market is trading around a solid horizontal structure 0.596.
The above observations make me that the market will inevitably achieve 0.602 level.
P.S
Please, note that an oversold/overbought condition can last for a long time, and therefore being oversold/overbought doesn't mean a price rally will come soon, or at all.
Disclosure: I am part of Trade Nation's Influencer program and receive a monthly fee for using their TradingView charts in my analysis.
Like and subscribe and comment my ideas if you enjoy them!
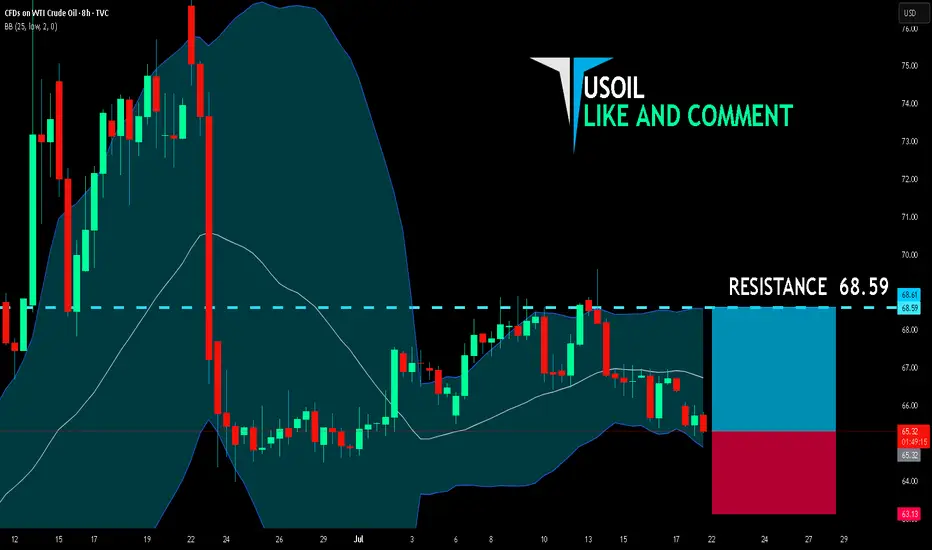
USOIL BULLS ARE STRONG HERE|LONG
USOIL SIGNAL
Trade Direction: long
Entry Level: 65.32
Target Level: 68.59
Stop Loss: 63.13
RISK PROFILE
Risk level: medium
Suggested risk: 1%
Timeframe: 8h
Disclosure: I am part of Trade Nation's Influencer program and receive a monthly fee for using their TradingView charts in my analysis.
✅LIKE AND COMMENT MY IDEAS✅
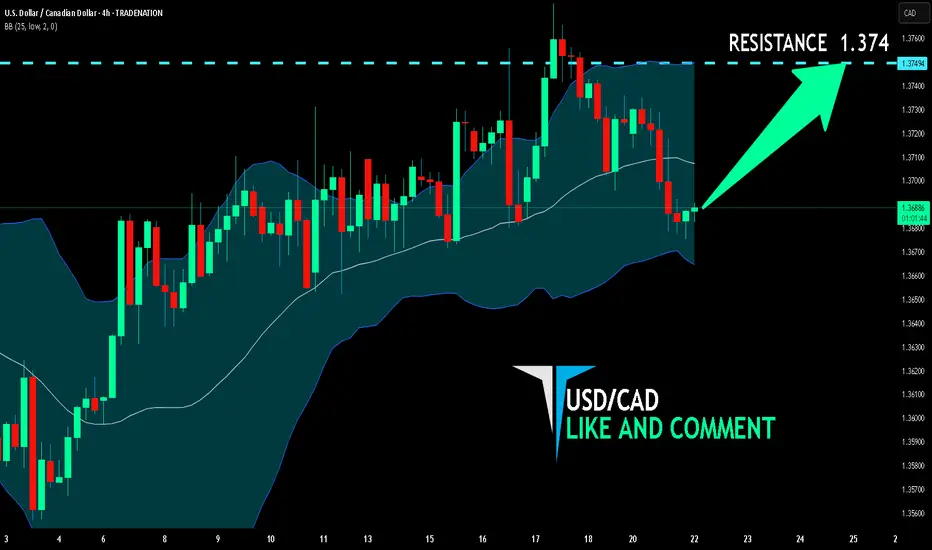
USD/CAD BULLS WILL DOMINATE THE MARKET|LONG
Hello, Friends!
USD/CAD pair is in the uptrend because previous week’s candle is green, while the price is clearly falling on the 4H timeframe. And after the retest of the support line below I believe we will see a move up towards the target above at 1.374 because the pair is oversold due to its proximity to the lower BB band and a bullish correction is likely.
Disclosure: I am part of Trade Nation's Influencer program and receive a monthly fee for using their TradingView charts in my analysis.
✅LIKE AND COMMENT MY IDEAS✅