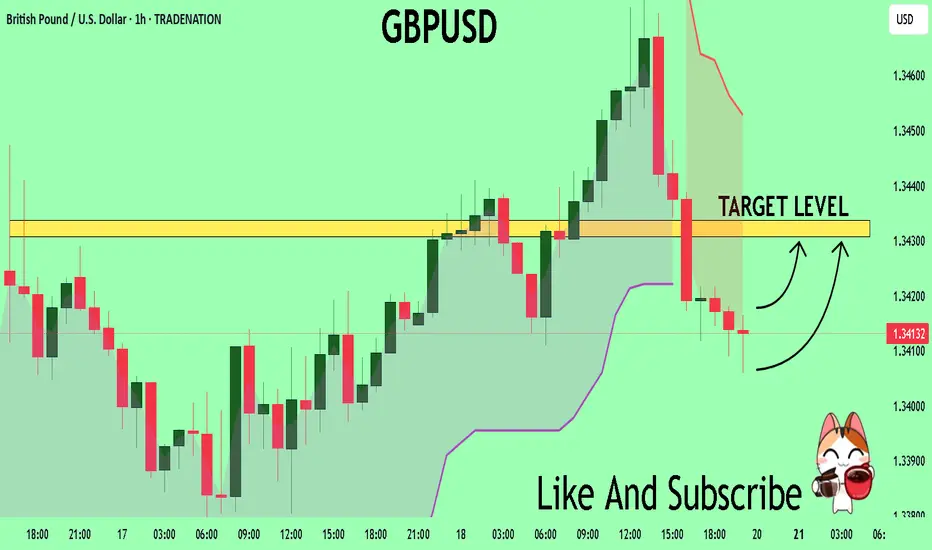
GBPUSD Expected Growth! BUY!
My dear followers,
I analysed this chart on GBPUSD and concluded the following:
The market is trading on 1.3413 pivot level.
Bias - Bullish
Technical Indicators: Both Super Trend & Pivot HL indicate a highly probable Bullish continuation.
Target - 1.3430
About Used Indicators:
A super-trend indicator is plotted on either above or below the closing price to signal a buy or sell. The indicator changes color, based on whether or not you should be buying. If the super-trend indicator moves below the closing price, the indicator turns green, and it signals an entry point or points to buy.
Disclosure: I am part of Trade Nation's Influencer program and receive a monthly fee for using their TradingView charts in my analysis.
———————————
WISH YOU ALL LUCK
LONG
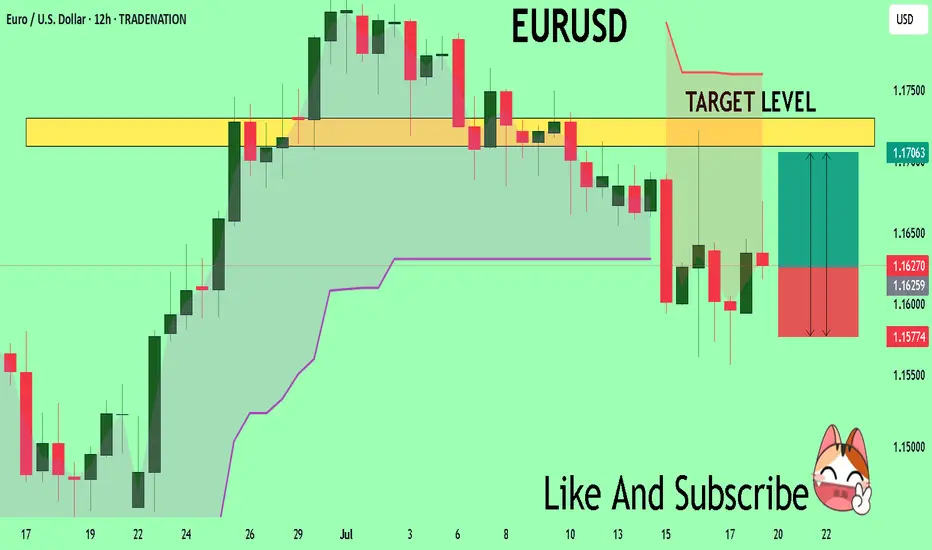
EURUSD Massive Long! BUY!
My dear friends,
Please, find my technical outlook for EURUSD below:
The price is coiling around a solid key level - 1.1627
Bias - Bullish
Technical Indicators: Pivot Points Low anticipates a potential price reversal.
Super trend shows a clear buy, giving a perfect indicators' convergence.
Goal - 1.1710
Safe Stop Loss - 1.1577
About Used Indicators:
The pivot point itself is simply the average of the high, low and closing prices from the previous trading day.
Disclosure: I am part of Trade Nation's Influencer program and receive a monthly fee for using their TradingView charts in my analysis.
———————————
WISH YOU ALL LUCK
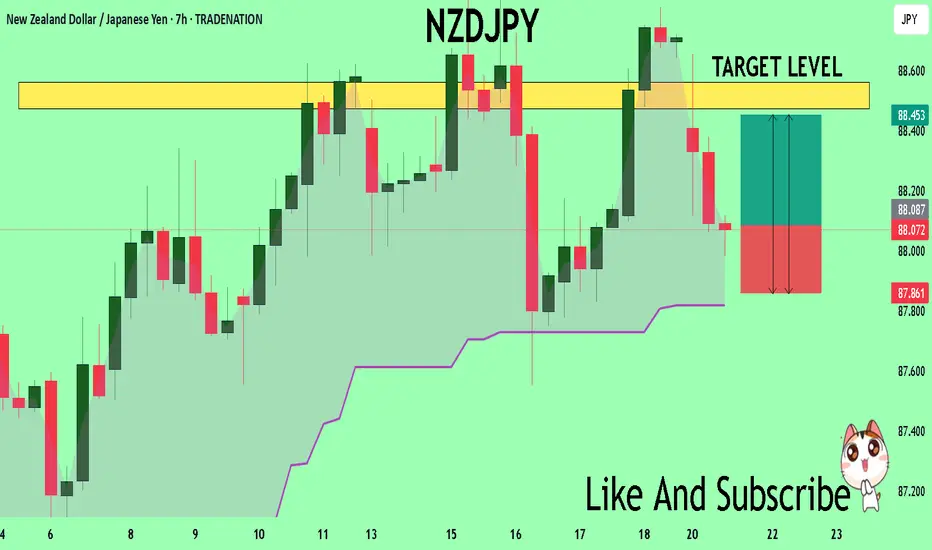
NZDJPY Set To Grow! BUY!
My dear friends,
My technical analysis for NZDJPY is below:
The market is trading on 88.079 pivot level.
Bias - Bullish
Technical Indicators: Both Super Trend & Pivot HL indicate a highly probable Bullish continuation.
Target - 88.472
Recommended Stop Loss - 87.861
About Used Indicators:
A pivot point is a technical analysis indicator, or calculations, used to determine the overall trend of the market over different time frames.
Disclosure: I am part of Trade Nation's Influencer program and receive a monthly fee for using their TradingView charts in my analysis.
———————————
WISH YOU ALL LUCK
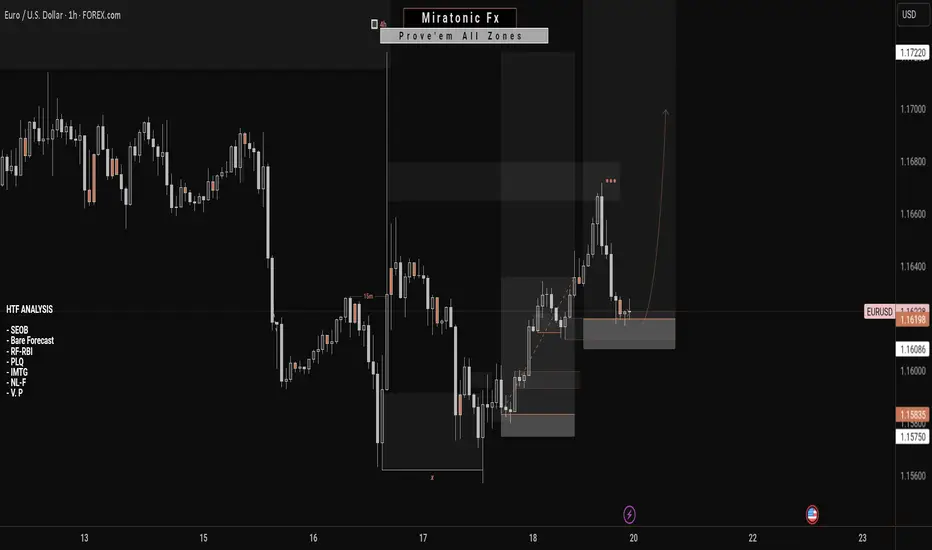
EURUSD Bullish ProjectionIt’s been a while since my last update here.
Here’s my projection and actual entry/entries on EURUSD, based on a sweep of the previous 1H swing low and mitigation of a Daily imbalance (Fair Value Gap).
We're anticipating a full Change of Character to mark the end of the ongoing Daily pullback.
GOLD - Price can rise to resistance line of wedgeHi guys, this is my overview for XAUUSD, feel free to check it and write your feedback in comments👊
The price has been trading within a large ascending wedge for an extended period.
The asset found significant support near the lower trendline of this formation, specifically in the 3205 - 3187 price area.
From that support, the price initiated a sustained upward movement back towards the upper parts of the structure.
Currently, XAU is facing a key horizontal resistance zone located between 3375 and 3390 points.
The price is actively attempting to break through this area, which has historically served as a critical pivot point.
I expect that once the price firmly breaks and consolidates above this resistance, it will continue its growth towards the upper boundary of the wedge, targeting the $3475 level.
If this post is useful to you, you can support me with like/boost and advice in comments❤️
Disclaimer: As part of ThinkMarkets’ Influencer Program, I am sponsored to share and publish their charts in my analysis.

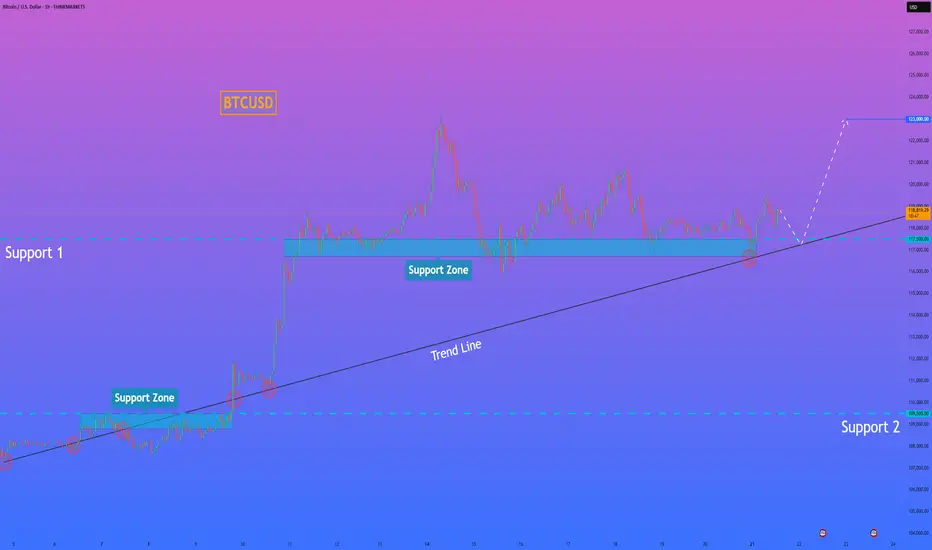
HelenP. I Bitcoin will rebound from trend line and rise to $123KHi folks today I'm prepared for you Bitcoin analytics. If we look at the chart, we can see a very clear and long-term bullish structure. The entire uptrend is supported by a major ascending trend line that has acted as a reliable foundation for the price for a significant amount of time. Currently, the price is consolidating above this crucial trend line and is interacting with the key support zone between 117500 and 116700 points. I believe that the most probable scenario here is a brief corrective move downwards for the price to properly retest the main ascending trend line. This type of retest is often a healthy sign in a strong trend, as it allows for the confirmation of support and gathers momentum for the next leg up. A strong rebound from this trend line would serve as a powerful signal that the buyers are still in control. Therefore, once the price confirms its bounce from this dynamic support, the path should be clear for a continuation of the uptrend. For this reason, my primary goal for this trade idea is set at the 123000 points. If you like my analytics you may support me with your like/comment ❤️
Disclaimer: As part of ThinkMarkets’ Influencer Program, I am sponsored to share and publish their charts in my analysis.
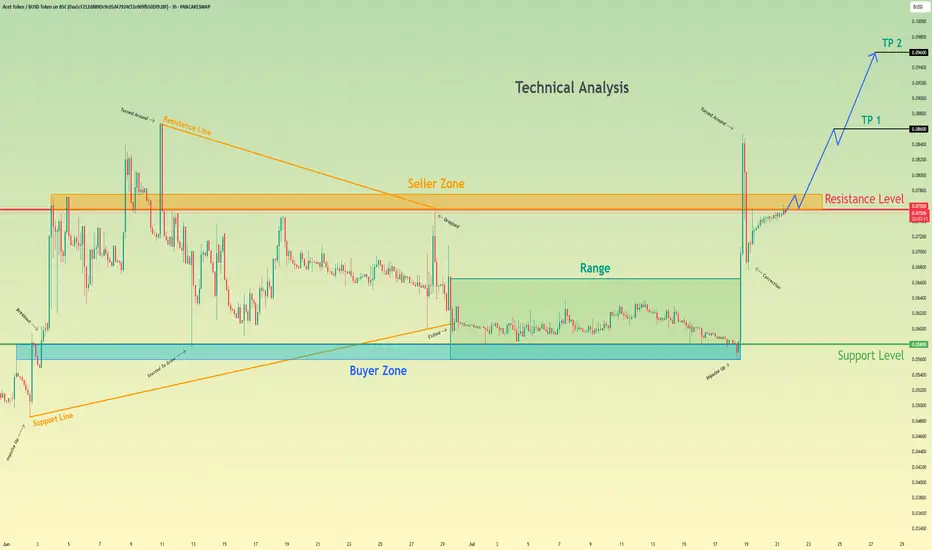
ACT TOKEN - Price can fall to support area and then bounce upHi guys, this is my overview for ACTBUSD, feel free to check it and write your feedback in comments👊
The price was trading within a descending channel for a considerable period.
The asset consistently found support at the lower boundary of this formation, within the 0.0590 - 0.0570 price zone.
Recently, a strong upward impulse allowed the price to break out from the upper boundary of the channel.
Following the breakout, the price executed a corrective move back to the broken resistance line, successfully retesting the 0.0730 - 0.0750 area.
This zone is now acting as a new support level, and the price has begun to move upwards from it, showing renewed buyer strength.
I expect that the asset will continue its growth from this support. My first target is set at the 0.0860 level, with the second target at 0.0970 points.
If this post is useful to you, you can support me with like/boost and advice in comments❤️
Euro may correct a little and then continue to rise in channelHello traders, I want share with you my opinion about Euro. Observing the recent price action, we can map out a clear transition in market structure. Previously, the pair was contained within a well-defined downward channel, where the seller zone around the 1.1760 resistance level consistently capped rallies, leading to multiple breakdowns and correctional movements. However, after a final push lower, the dynamic shifted, with the price action showing a clear downtrend-to-uptrend reversal. Currently, the euro has established a new upward channel, finding solid ground in the buyer zone around the 1.1660 support level. The price is now engaged in a constructive upward movement within the boundaries of this new channel. The prevailing hypothesis is that after a potential minor correction towards the channel's support line, the pair will resume its ascent. Therefore, the take-profit target for this scenario, tp 1, is strategically placed at 1.1710, as this level directly corresponds with the resistance line of the current upward channel, representing a logical point for price to react. Please share this idea with your friends and click Boost 🚀
Disclaimer: As part of ThinkMarkets’ Influencer Program, I am sponsored to share and publish their charts in my analysis.

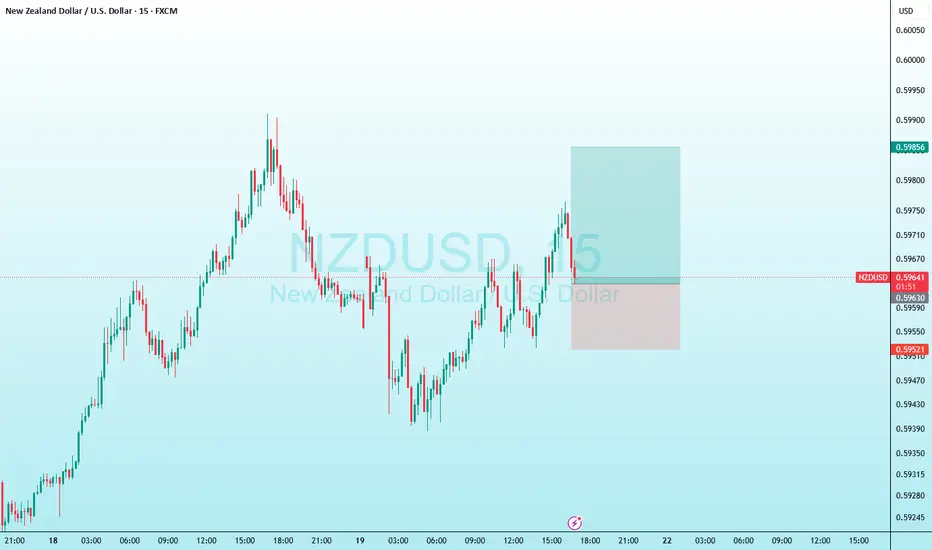
nzdusd long tradein my opinion this is a good trade with a good r/r
hope it will hit the target
consider this is my trade not your trade
i just like to share my trades with world
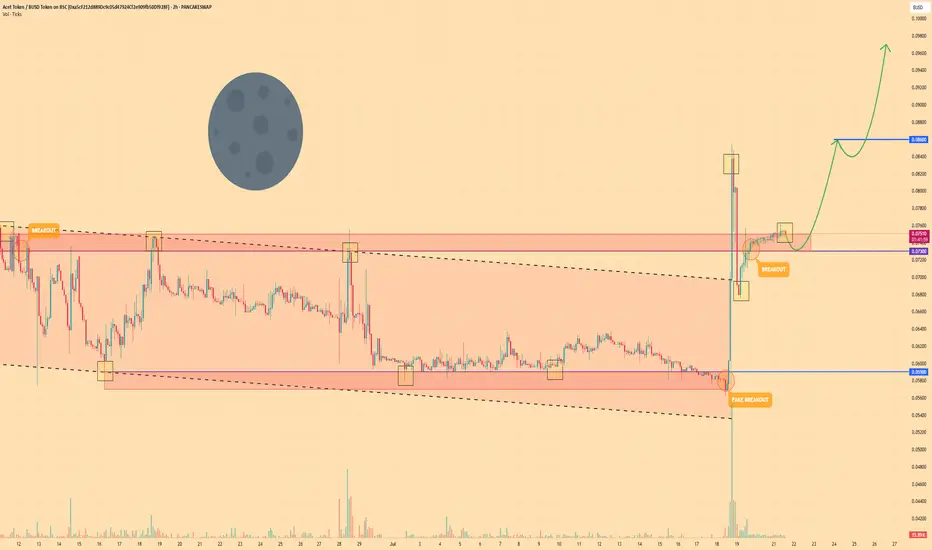
HelenP. I Acet Token may make correction and then continue growHi folks today I'm prepared for you Act Token analytics. If we look at the chart, we can observe a clear technical picture. For a considerable amount of time, the price was tightly compressed inside a large downward wedge, defined by a robust support zone at 0.0570 - 0.0550 and a descending trend line that put consistent pressure on the price. Such long consolidation periods often precede a powerful expansion. Recently, we have witnessed a decisive breakout from this wedge, confirmed by a strong impulse candle. This move signals a clear shift in market sentiment from neutral to bullish and invalidates the prior constraining structure. I believe that the momentum from this breakout will be sufficient to challenge the next major obstacle: the horizontal resistance zone at 0.0770 - 0.0790. This is a critical level to watch, as it has previously rejected price advances. My scenario implies that after potentially a small, healthy correction or retest, the price will continue its upward movement. A successful break above this critical area would confirm the newfound strength of the buyers and open up a clear path for further appreciation. For this reason, my primary goal, the logical target for this move, is set at the 0.0880 level. If you like my analytics you may support me with your like/comment ❤️
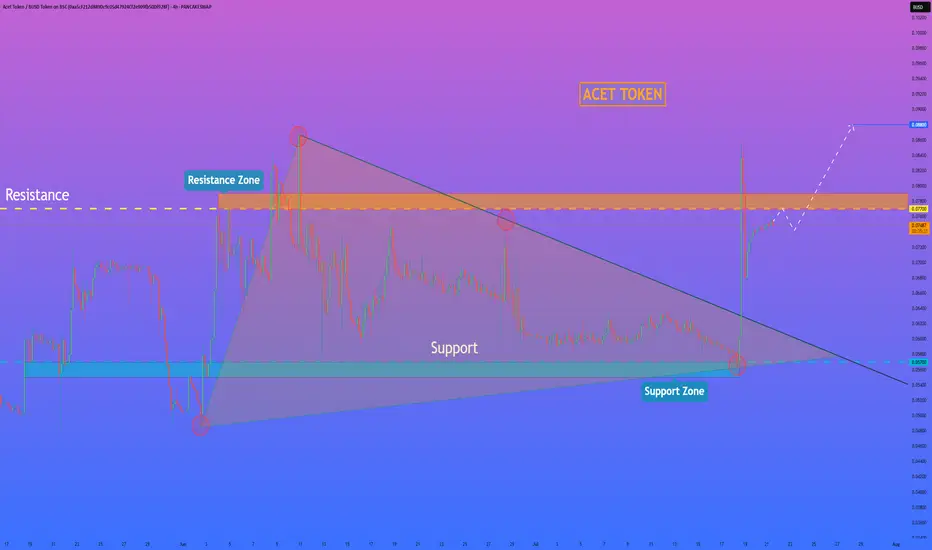
Acet Token will break resistance level and continue to move upHello traders, I want share with you my opinion about Acet Token. Looking at the recent price action, we can see a clear narrative unfolding. The asset initially formed a large wedge pattern, experiencing a trend reversal that led to a breakdown and a period of prolonged consolidation within a defined range between the buyer zone around 0.0580 and the upper boundary. Recently, however, the market showed a strong impulse, breaking out of this range and decisively moving upwards. Currently, the price of act is testing the key resistance level at 0.0755, an area historically defined as a seller zone. The hypothesis is that after this powerful impulse, the asset will manage to break and hold above this resistance. A successful retest of the 0.0755 level would likely signal a continuation of the uptrend, paving the way towards our specified take-profit targets. The first goal is set at TP 1 at 0.0860, with a further extension to TP 2 at 0.0960, capitalizing on the anticipated bullish momentum. Please share this idea with your friends and click Boost 🚀
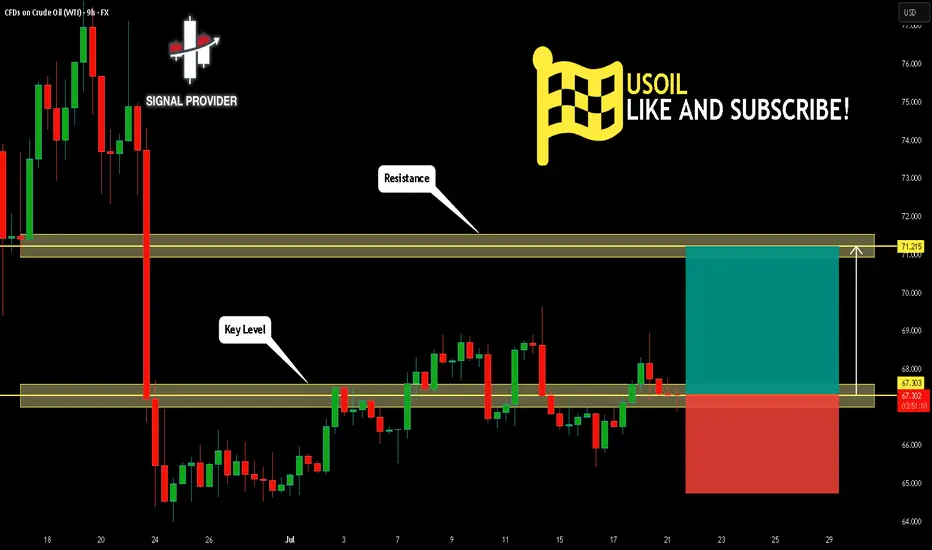
USOIL Will Go Higher! Buy!
Take a look at our analysis for USOIL.
Time Frame: 9h
Current Trend: Bullish
Sentiment: Oversold (based on 7-period RSI)
Forecast: Bullish
The market is approaching a key horizontal level 67.303.
Considering the today's price action, probabilities will be high to see a movement to 71.215.
P.S
We determine oversold/overbought condition with RSI indicator.
When it drops below 30 - the market is considered to be oversold.
When it bounces above 70 - the market is considered to be overbought.
Disclosure: I am part of Trade Nation's Influencer program and receive a monthly fee for using their TradingView charts in my analysis.
Like and subscribe and comment my ideas if you enjoy them!
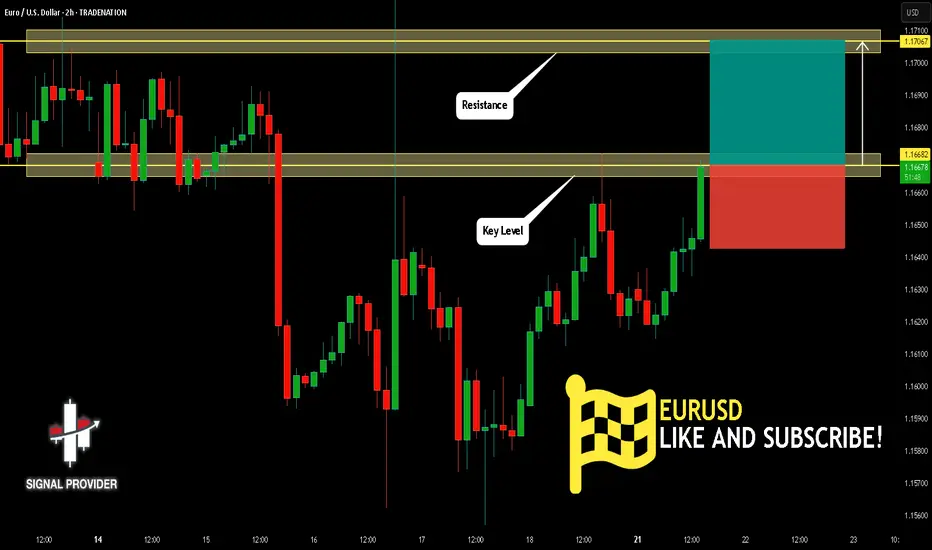
EURUSD Will Go Up! Long!
Please, check our technical outlook for EURUSD.
Time Frame: 2h
Current Trend: Bullish
Sentiment: Oversold (based on 7-period RSI)
Forecast: Bullish
The market is approaching a significant support area 1.166.
The underlined horizontal cluster clearly indicates a highly probable bullish movement with target 1.170 level.
P.S
Overbought describes a period of time where there has been a significant and consistent upward move in price over a period of time without much pullback.
Disclosure: I am part of Trade Nation's Influencer program and receive a monthly fee for using their TradingView charts in my analysis.
Like and subscribe and comment my ideas if you enjoy them!
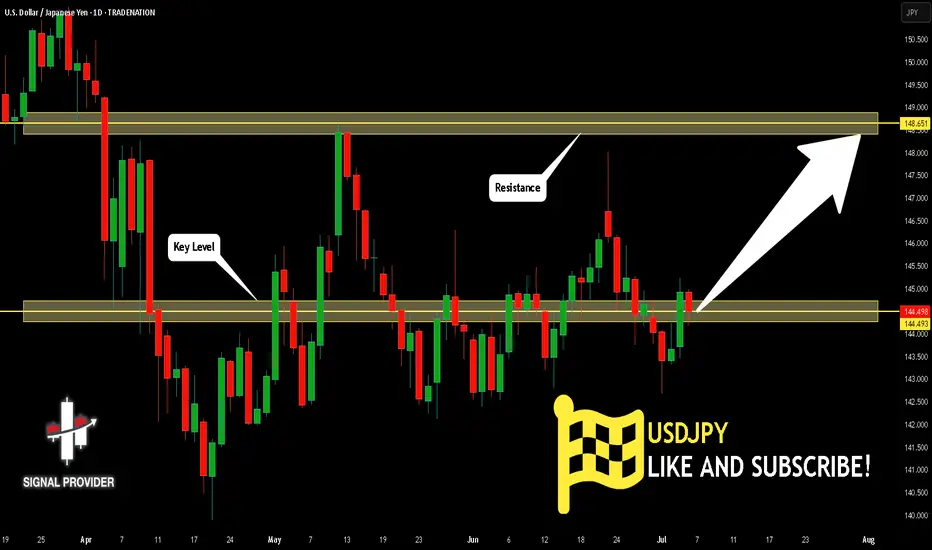
USDJPY Is Very Bullish! Buy!
Here is our detailed technical review for USDJPY.
Time Frame: 1D
Current Trend: Bullish
Sentiment: Oversold (based on 7-period RSI)
Forecast: Bullish
The market is approaching a significant support area 144.493.
The underlined horizontal cluster clearly indicates a highly probable bullish movement with target 148.651 level.
P.S
Overbought describes a period of time where there has been a significant and consistent upward move in price over a period of time without much pullback.
Disclosure: I am part of Trade Nation's Influencer program and receive a monthly fee for using their TradingView charts in my analysis.
Like and subscribe and comment my ideas if you enjoy them!
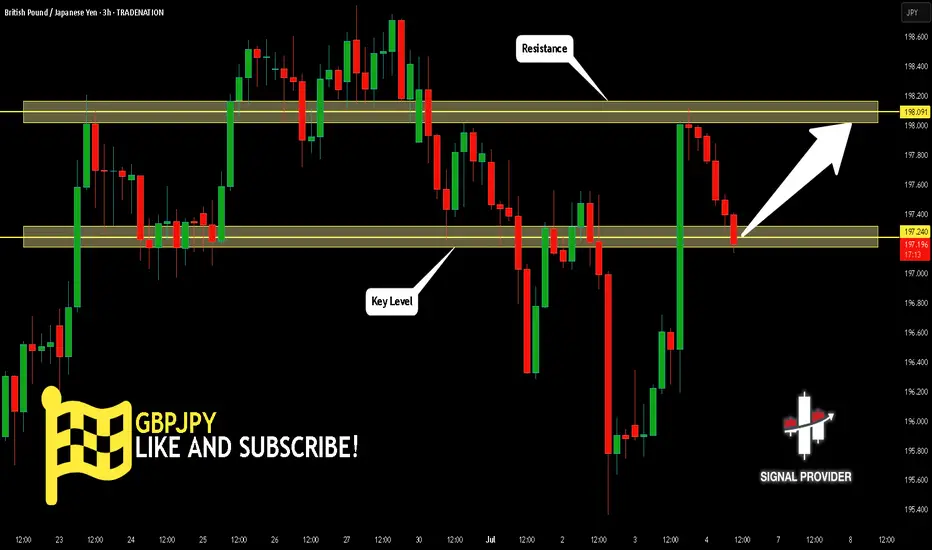
GBPJPY Will Go Up! Buy!
Please, check our technical outlook for GBPJPY.
Time Frame: 3h
Current Trend: Bullish
Sentiment: Oversold (based on 7-period RSI)
Forecast: Bullish
The market is approaching a key horizontal level 197.240.
Considering the today's price action, probabilities will be high to see a movement to 198.091.
P.S
Please, note that an oversold/overbought condition can last for a long time, and therefore being oversold/overbought doesn't mean a price rally will come soon, or at all.
Disclosure: I am part of Trade Nation's Influencer program and receive a monthly fee for using their TradingView charts in my analysis.
Like and subscribe and comment my ideas if you enjoy them!
USDCAD Will Move Higher! Long!
Take a look at our analysis for USDCAD.
Time Frame: 2h
Current Trend: Bullish
Sentiment: Oversold (based on 7-period RSI)
Forecast: Bullish
The market is testing a major horizontal structure 1.368.
Taking into consideration the structure & trend analysis, I believe that the market will reach 1.373 level soon.
P.S
We determine oversold/overbought condition with RSI indicator.
When it drops below 30 - the market is considered to be oversold.
When it bounces above 70 - the market is considered to be overbought.
Disclosure: I am part of Trade Nation's Influencer program and receive a monthly fee for using their TradingView charts in my analysis.
Like and subscribe and comment my ideas if you enjoy them!

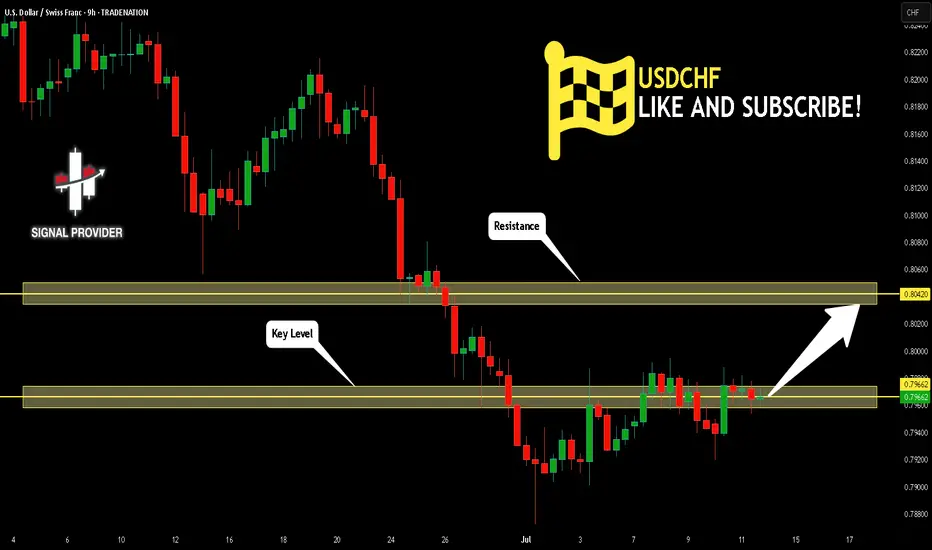
USDCHF Will Grow! Long!
Here is our detailed technical review for USDCHF.
Time Frame: 9h
Current Trend: Bullish
Sentiment: Oversold (based on 7-period RSI)
Forecast: Bullish
The market is approaching a significant support area 0.796.
The underlined horizontal cluster clearly indicates a highly probable bullish movement with target 0.804 level.
P.S
We determine oversold/overbought condition with RSI indicator.
When it drops below 30 - the market is considered to be oversold.
When it bounces above 70 - the market is considered to be overbought.
Disclosure: I am part of Trade Nation's Influencer program and receive a monthly fee for using their TradingView charts in my analysis.
Like and subscribe and comment my ideas if you enjoy them!
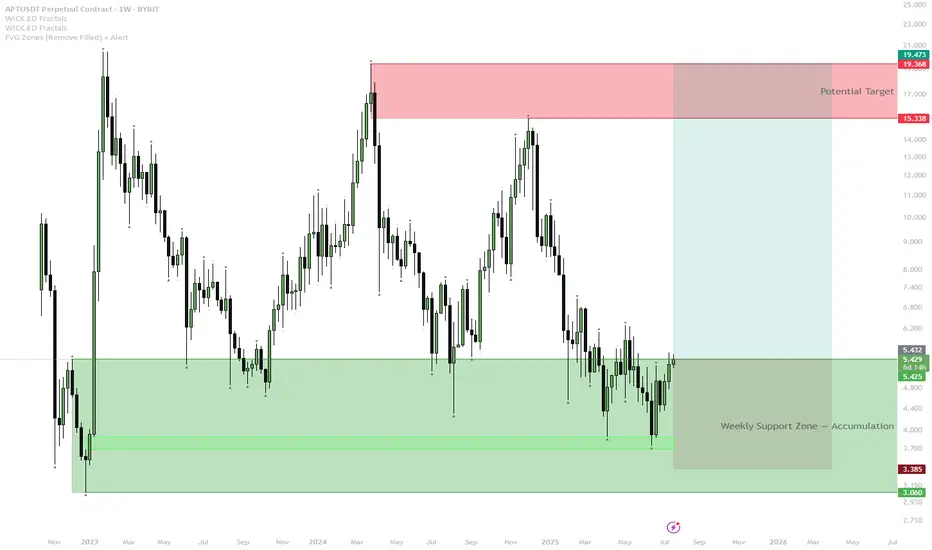
APTOS Weekly Bottom Formation — Early Signs of Reversal
APT has retested and held the long-term weekly support zone (green box) multiple times, confirming strong demand and buyer defense.
Current price action is pushing off the support with a series of higher lows, suggesting the start of a new bullish cycle.
Scenario A (Bullish):
— If APT holds above $5.40 and weekly closes stay above this green zone, expect gradual momentum toward the $15–$19 resistance (red box).
— First target is $15.30, with extension to $19.50 if trend accelerates.
Scenario B (Invalidation/Bearish):
— If price fails to hold $5.40 and breaks back below $3.40, setup is invalidated. In this case, expect retest of lower support at $3.00 or lower.
Aptos is showing a classic bottoming structure on the weekly timeframe, with clear accumulation at major support. Sellers have repeatedly failed to break the lows, while buyers step in on every dip. This increases the probability of a mid-term reversal toward the upper resistance band. Weekly structure remains bullish above support; only a major breakdown below $3.40 would invalidate the scenario.
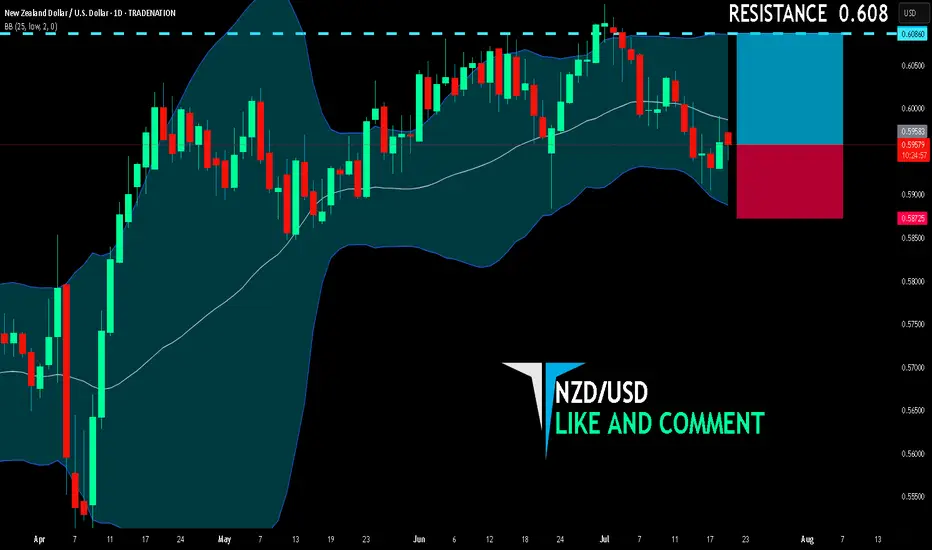
NZD/USD BUYERS WILL DOMINATE THE MARKET|LONG
NZD/USD SIGNAL
Trade Direction: long
Entry Level: 0.595
Target Level: 0.608
Stop Loss: 0.587
RISK PROFILE
Risk level: medium
Suggested risk: 1%
Timeframe: 1D
Disclosure: I am part of Trade Nation's Influencer program and receive a monthly fee for using their TradingView charts in my analysis.
✅LIKE AND COMMENT MY IDEAS✅
Dow Jones is Nearing an Important Support!!Hey Traders, in today's trading session we are monitoring US30 for a buying opportunity around 43,950 zone, Dow Jones is trading in an uptrend and currently is in a correction phase in which it is approaching the trend at 43,950 support and resistance area.
Trade safe, Joe.

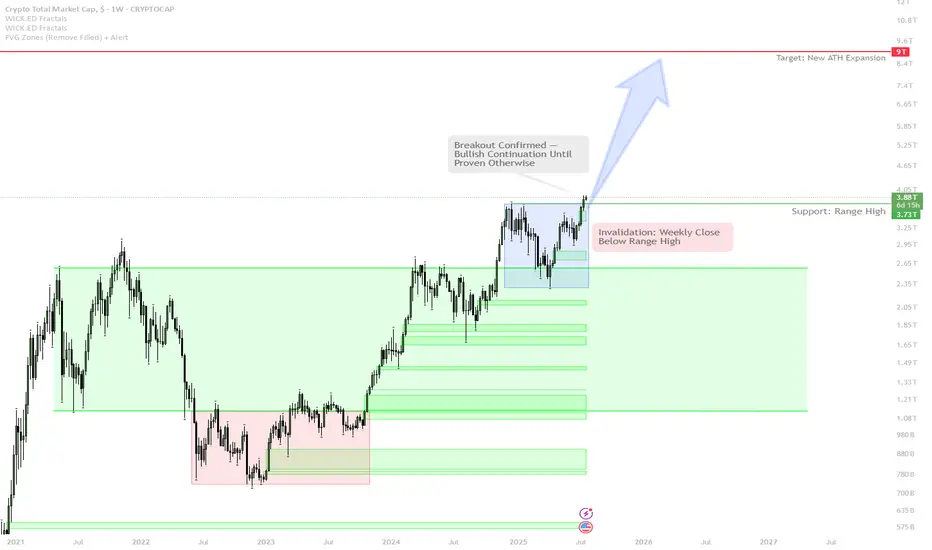
Total Crypto Market Cap: Weekly Breakout Signals Bull Run Contin
The weekly candle has closed above the key range high — this is a major bullish signal, similar to the breakout seen in early 2021.
As long as price remains above this breakout level, the scenario is a continuation uptrend — expect further expansion and strong price action.
If the market fails and closes back below the range high, the breakout will be invalidated — this would signal a potential range or pullback phase.
Current strategy is to trade with the trend:
Hold spot exposure and add on confirmed breakouts.
Do NOT short without a clear breakdown and structure reversal.
If a failed breakout occurs (weekly candle closes back below range high), take profit quickly and switch to risk-off mode.
Market psychology: Most buyers hesitate at lows, but FOMO after a strong move is classic. The disciplined approach is to buy the setup, not the hype.
This is a textbook technical breakout with historical precedence for explosive upside. As long as Total Market Cap holds above the range high, the path of least resistance is up. Attempting to fade the breakout is risky unless there is a clear weekly close back below the level. Trend continuation is favored until proven otherwise. The correct approach is to stay with the trend and manage risk only if a breakdown occurs.
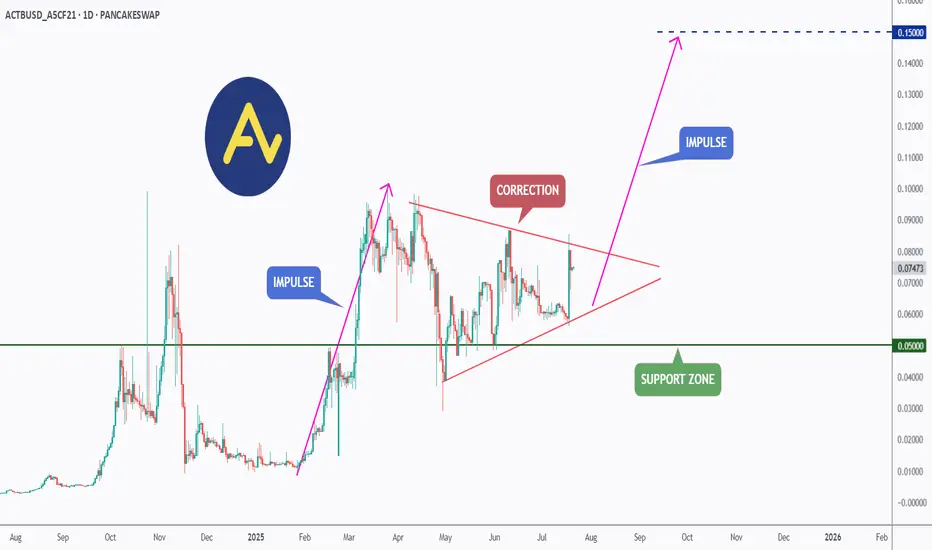
ACT (Acet) - Eyeing the Next Impulse Move?ACT has been forming a textbook bullish continuation pattern.↗️
After a strong impulse leg earlier this year, price has been consolidating within a symmetrical triangle, signaling a healthy correction phase.
🏹Today, ACT broke out of the triangle to the upside , indicating that bulls may be taking control once again.
📍If momentum continues, the next impulse move could push price toward the $0.15 resistance as a first target — a major psychological and technical level.
As long as the $0.050 support holds, ACT remains in bullish territory with upside potential in sight.
📚 Always follow your trading plan regarding entry, risk management, and trade management.
Good luck!
All Strategies Are Good; If Managed Properly!
~Richard Nasr
PUMP Trend Reversal – Testing 1H Supply FlipStep-by-step Price Scenario:
Price has broken the local downtrend and reclaimed the 1H supply zone, showing LTF strength.
Look for acceptance above 0.00445–0.00452 green zone for confirmation of the reversal.
If price holds above this zone, expect a move toward the next supply levels at 0.0048, then 0.0050, and 0.0054.
If price loses the green zone (close below 0.00436), scenario is invalidated—look for a retest of the previous lows near 0.00394.
Reasoning:
After a strong local downtrend, price has started to show reversal signs with a clear break and reclaim of the 1H supply zone. This area previously acted as resistance and now flipped to support, signaling the potential for a short-term rally. If buyers manage to hold above this new support, it would confirm the strength of the reversal and open up the path to test the next local supply zones above. However, failure to hold the reclaimed level (close below 0.00436) would invalidate this scenario and suggest the downtrend may continue. This setup is based on a classical supply/demand flip and early signs of bullish momentum on lower timeframes.
