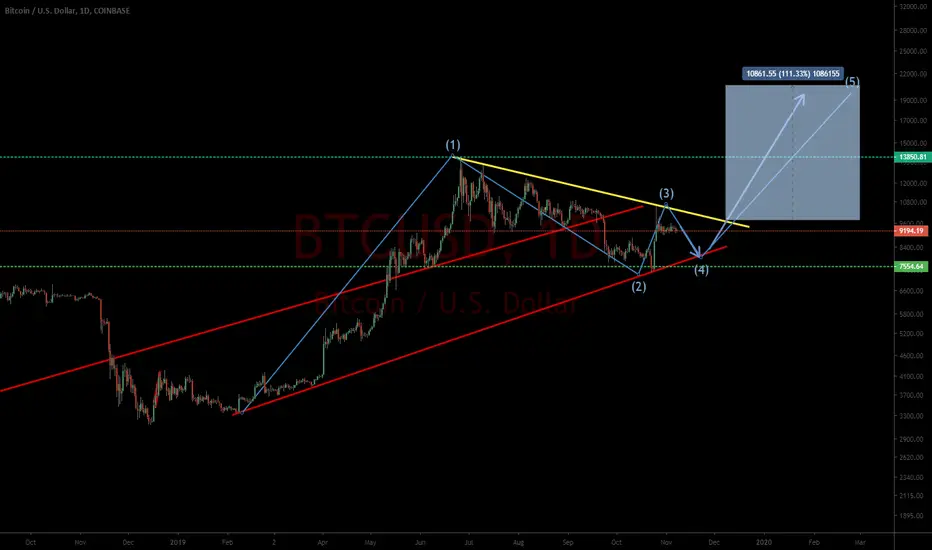
LONG ON BITCOIN ABCD!Quick and easy pattern. I see a huge potential longterm ABCD pattern thats all. KISS!
Longbtc

BITCOIN A Huge Breakout Coming Soon!!!!!!#BTC Updates!!
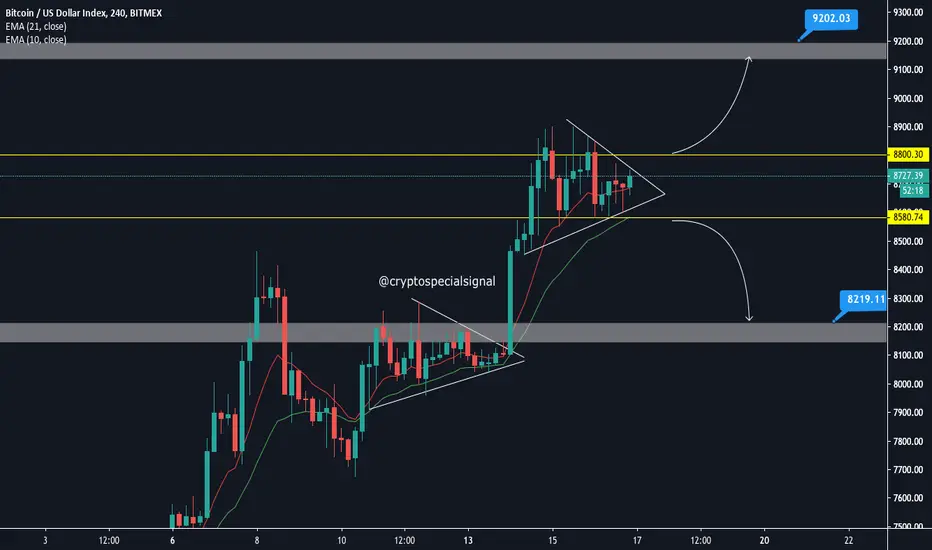
BTC Making Another Triangle On 8600-8800$ Zone..Its Going Closer To End Of The Triangle..Soon We Will See A Upside Or Down Side Breakout..📉📈
There Is 2 Possible Scenario:
1.Upside Breakout :
If BTC Manage To Break 8800$ And Stay Above That Range With A Healthy Candle Then Next Target Should Be 9200$ DMA200 Resistance.📈
2. DownSide Breakout :
If BTC Fail To Hold Above 8580$ Then Next Target Should Be 8300-8200$ ..There Is Some Good Support At 8600$. . EMA10(Red) & EMA21(Blue) Become Short Term Good Support.
So Before Any Breakout Its A Choppy Zone For Scalping.
Stay Safe
Good Luck
CssTeam
t.me/cryptospecialsignal
Follow Me | LIke | Comment | Share
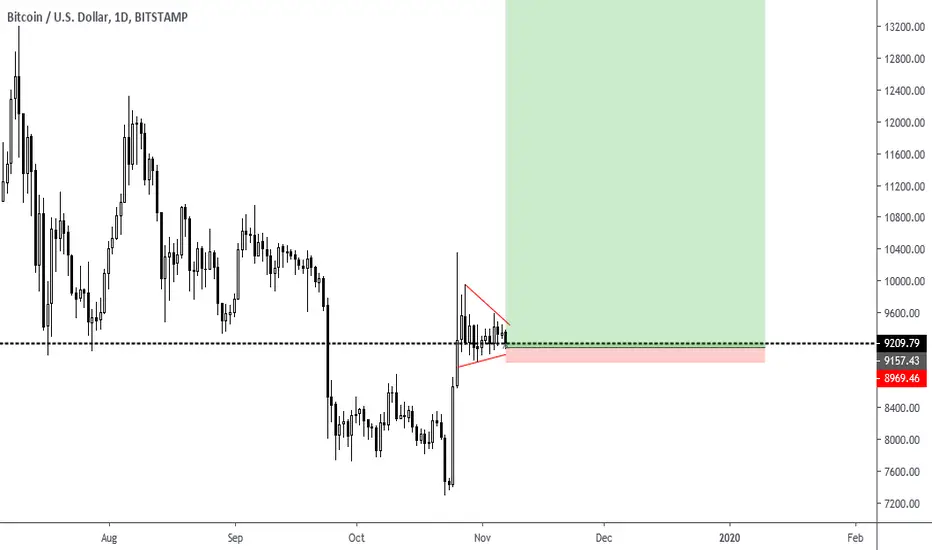
Bitcoin doing the double threes.Hi and welcome to my TA channel im glad that you found my analysis. Please support me and follow me by following my profile and put a like on the TA.
So what about bitcoin, as we see it doing an corrective pattern before the breakout.
Bitcoin is about to start impulsive wave three.
This is not an investing advice. good luck!

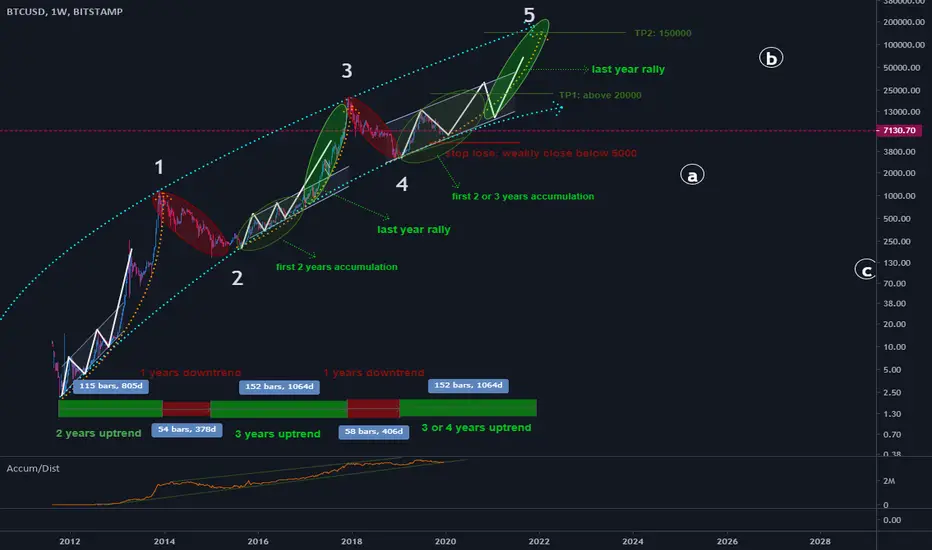
BITCOIN WILL BE IN UPTREND FOR NEXT TWO YEARS- FRACTAL AND EWbitcoin will remain bullish for long term IF it can hold 4800
BUllISH scenario
-according to Elliot it can be 5 wave impulse and 5th must be completed
-according to fractals we will have at least 3 years uptrend
stop lose= close weakly below 4800
targets:
end of 2020: 20000
end of 2021: above 100000
Bearish scenario(low possibility)
it can be a big ABC wave and it is in wave 2
this scenario will be confirmed if it go to below 4k and we will NOT see 20k
Do not forget stop lose in any trade. it can save you...
LIKE and comment if this analysis was useful for you
thank you
Show Me a More Clear Bitcoin ChartBitcoin don't go down over long term - cave man can see that. Let' s agree that history agrees that Bitcoin is a net-winner over the long term without a doubt. I am only making this clear as I am posting a long term weekly TF chart of Bitcoin, so let's go ahead and establish the fundamentals of my bias.
So, I put in a lot of coinciding indicators to confirm this, and there are more I could've pointed out, but those are too simple, such as RSI, volume, etc - I am craving a deeper analysis than that to support my idea of bitcoin potentially going to 30K and above. Simple ABCDE elliot waves line up with the 78.6 along with the 61.8 on the way back down for E - that is promising. Also, look at the trading range we are in with such great historic support at 6K, look at the buyers eating those wicks up - it is because they know the probability of making money when buying there is so great, you have to be a cave man to short that area first go-around. That is why $8300 is next to be hit before thinking more downside to $4900. Whales know this and will continue playing these monthly scalp trades. Keep it simple! Here are the two best plays right now:
Long 6K. Short 11,800. Close out anywhere between 8300-9500 on either long or short for a safe trade - you can't be perfect every time, so take that profit while it's there - don't get caught up in those dangerous waters. Safe, professional traders will only swing trade max five times a year, but they're so profitable that it's all they need. Play the big, obvious trends; not the unpredictable, no historic support/resistance areas. Good luck everyone.
DISCLAIMER: I DO NOT OWN ANY BTC OR CRYPTO

SIGNAL LONG BTC , 7 des 2019ENTRY LONG BTC : $7200 - $7400 ( averaging buy/long )
TP area :
TP1 : $7700
TP2 : $7900
TP3 : $8000

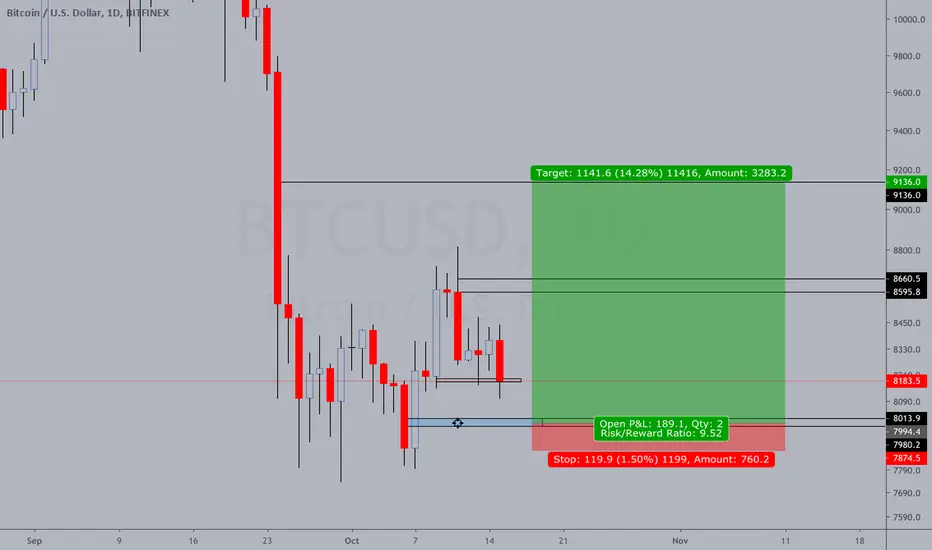
BTC - Entering Buy ZoneSell on the Daily but a Buy Long Term.
BTC looks like continued bearish consolidation BUT...we are close to the turn.
Looks like BTC may want to play down into the $6500 range.
However, it may not.
If you want a good price, but worry about getting left behind wait for price to enter anywhere under $7k and make small purchases.
Based on previous patterns and upcoming halving, we should be seeing a decent price increase into May.
It may take until late January to start the more rapid ascent, but this is more time to buy at low prices.
If you are thinking about the 2021 peak, this is an excellent entry point today.
I am expecting greater than 10X by December 2021 from current price levels.
Thank you for liking, commenting, throwing up a chart, following, or viewing.
I am not a financial advisor. My comments and reviews are based on what I do with my personal accounts.
Disclosure - I am long MARA, GBTC, BTCUSD, GDX, VIXY.
Short SPY and AAPL.

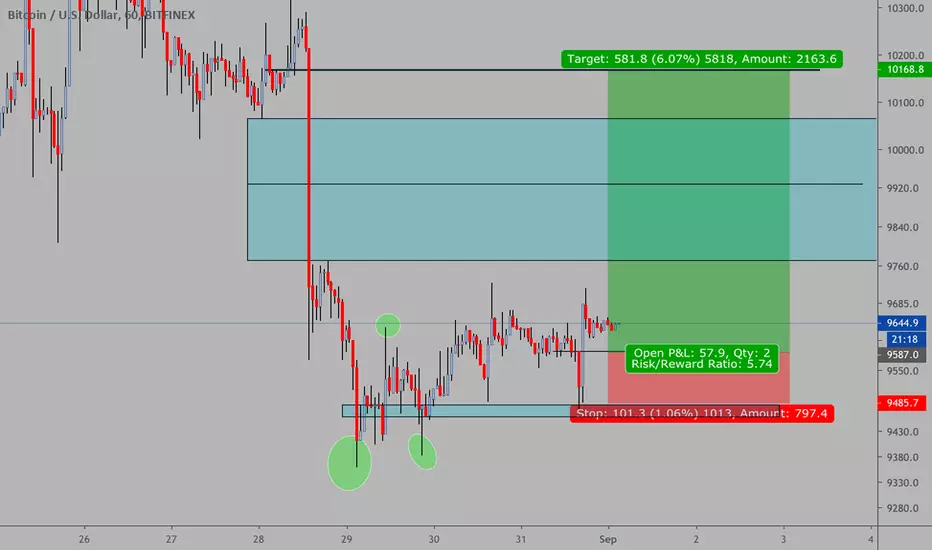
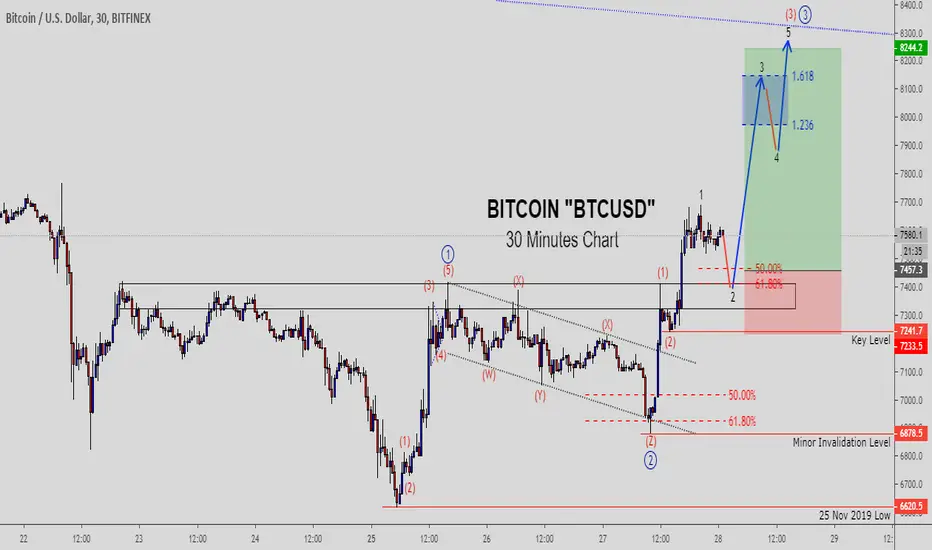
Elliot Wave: BTCUSD "BITCOIN" Intraday Buy SetupBitcoin is now setting the stage for wave 3 of (3) of ((3)) advance.
A significant rally should commence once the current correction is completed. I'm projecting that the upper trendline will accumulate sellers and signal the completion of wave ((3)). Looking to add more positions at $7450 area, while the key level on the chart is where we don't want price to breach while the correction is still unfolding.
Also, kindly follow below link for subsequent intraday updates on Bitcoin. I will not be posting a standalone intraday like this.
What's your take on Bitcoin? Do you trade it or just buy and hold?
Kindly let me know in the comment and tag colleague traders that want to trade Bitcoin.
Thanks for reading!
Veejahbee.
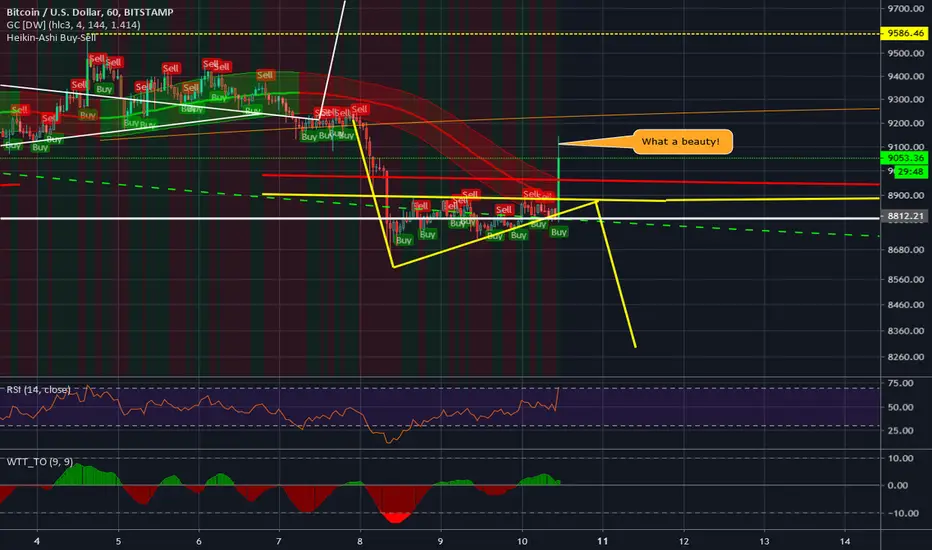
BTC - Bullish Breakout on the 1HR - HODL ONLooks like this 1HR Candle will get Gaussian Channel to turn green.
Need to watch further, but the turn on Daily chart around Gaussian Channel will carry us into halving and complete the current pennant formation.
I am seeing a wide upper range here where we could go 12k and possibly retest 19k ATH at halving.
If we see continuation on the 4HR chart Gaussian Channel to turn green, I will increase my bullish bias around the turn.
Thank you for liking, commenting, throwing up a chart, following, or viewing.
I am not a financial advisor. My comments and reviews are based on what I do with my personal accounts.
Disclosure - I am long MARA, GBTC, BTCUSD, GDX, VIXY and short SPY.
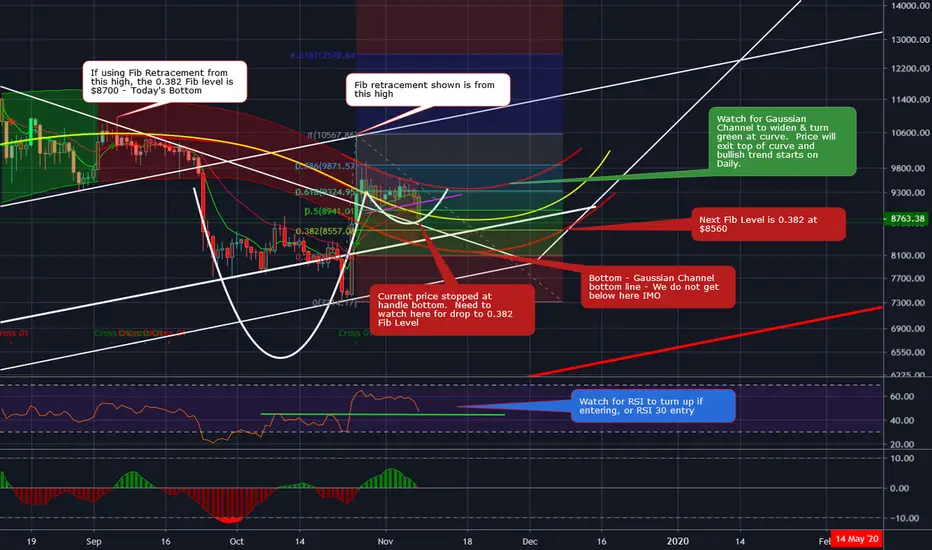
BTC - Fib Retracment and PlanB Responds to Flaws in S2F ModelTwo possible Fib Retracements here. Chart shows most recent high Fib Retracement.
Using 2nd previous high, we are resting on 0.382 retracement.
I do NOT see us going outside the Gaussian Channel. I will be adding anywhere in the bottom of the channel.
PlanB Responds to Flaws in Stock to Flow Model - www.youtube.com
Basically has another quant try to prove him wrong and can't. Then another quant tries to prove quant#1 wrong and can't.
Articulate, professional, logic based explanation from someone humbly and skeptically trying to not over exaggerate the model due to high price finds the highest price model most accurate and uncrackable.
THE BEST PODCAST I'VE HEARD THIS MONTH. - MAYBE NOT TODAY....BUT WE ARE DEFINITELY GOING UP
Thank you for liking, commenting, throwing up a chart, following, or viewing.
I am not a financial advisor. My comments and reviews are based on what I do with my personal accounts.
Disclosure - I am long MARA, GBTC, BTCUSD, GDX, VIXY and short SPY.
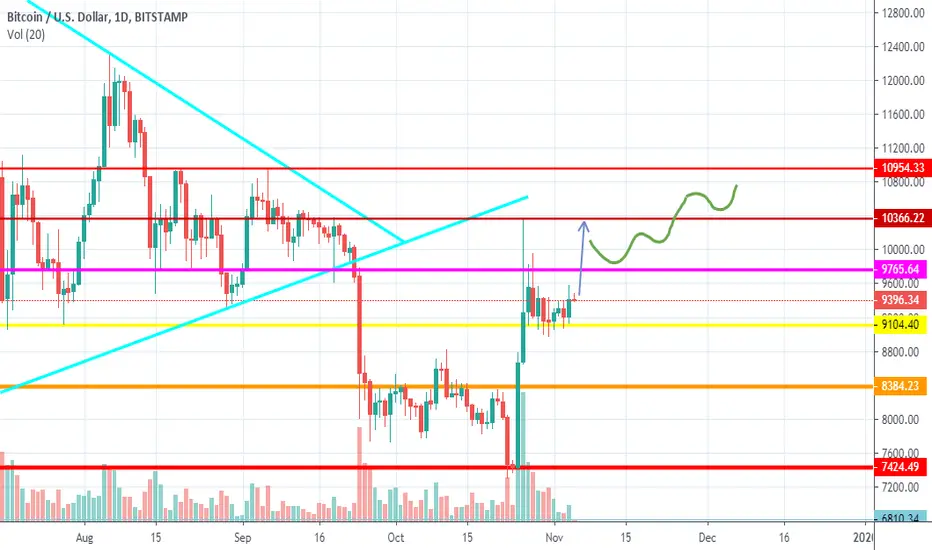
Cup and handle.Maybe a nice move coming out of the handle. Perhaps, a good entry point for DCA or take a bit of profit at resistance.
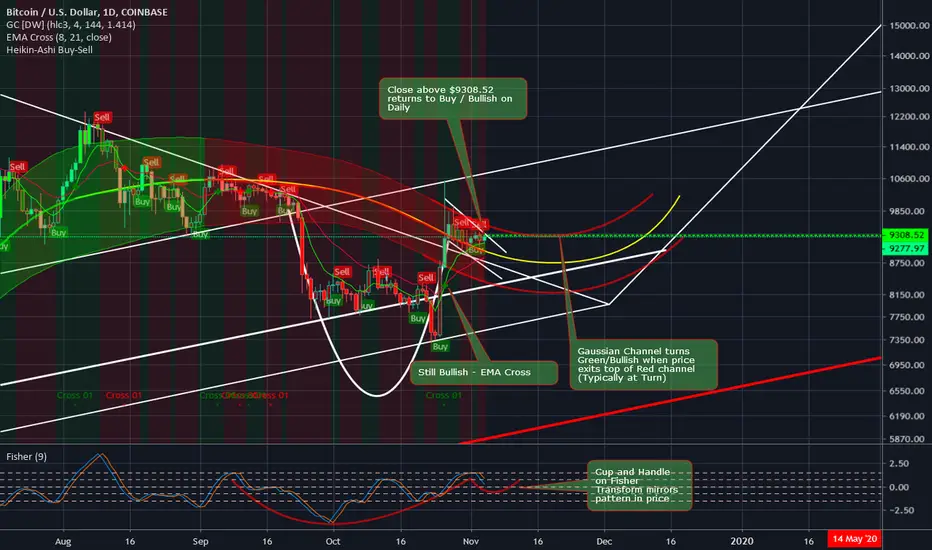
Close above $9308.52 = Back to Bullish on DailyWe are very close to making the turn here.
Gaussian Channel indicates MAIN trend (regardless on time perspective).
When price crosses midline, it's like a weak magnet pulling to other side.
When price exits channel - trend changes. Price farther outside channel makes channel change direction.
We are bearish on the Daily currently. However, the price gap for this to change is extremely small.
When I check the Weekly or even Monthly view - WE ARE BULLISH.
During bullish Weekly or Monthly trends, bitcoin can move very quick. Last Bullish Weekly and Monthly was 300% from $3000 to over $9k.
I am long BTC and GBTC for this reason.
Thank you to everyone that comments, puts a chart, likes, or follows. I really appreciate the community here.
I am not a financial advisor. This is my opinion based on what I do.
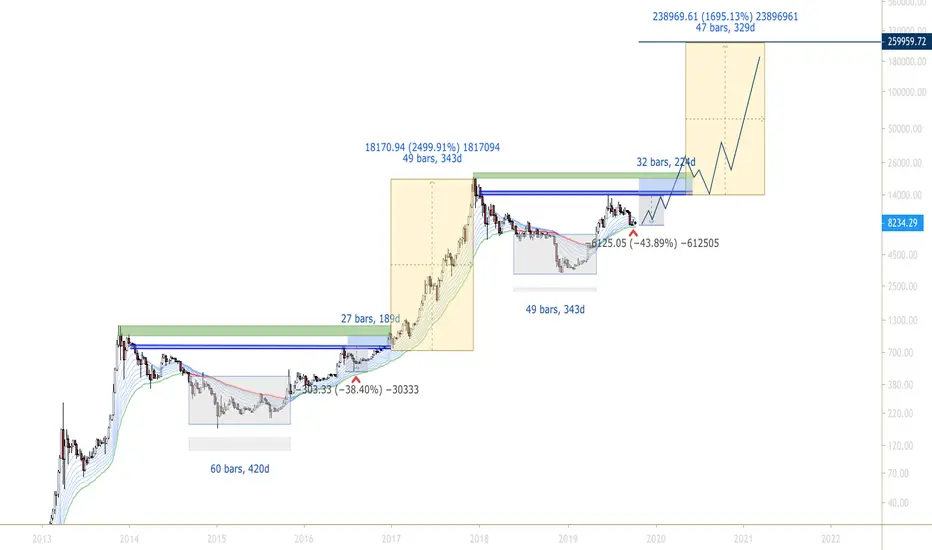
Future of Bitcoin (Price Forecast)Brief explantation of this fractal:
Sept 2014 - Nov 2015 was the first BTC broke under the moving average ribbon. This resulted in a 420 day bear market.
June 2016 - Aug 2016 - Bitcoin slowly swung out of the bear market and rallied until it met resistance @ $786 which lead to a 40% correction, signaling a short term top
*Note: The short term top at $786 took about 210 days to get retested*
Dec 2016 - Very shortly after, $786 Bitcoin tested it's previous all time high @ $1183, and continued up.
January 2017 - Dec 2017: After BTC broke above previous highs, we spent in 343 days in a bull market rallying over 2500% from $1183 - $19,954.
Where we are now: I correlate this recent price movement to the June 2016- August 2016 scenario. So far we have corrected 43% after swinging out of the bear market.
What's next: If Bitcoin follows a similar trajectory (and as long as 7.7k isn't breached) I believe it'll take about 200~ days (January 2020) to retest the short term top at $13,900. Breaking up would give us an instant push to 20k and new highs.
I believe Bitcoin will reach a generational top at $250,000 by 2022. From there, a slow bleed and dried up volatility.
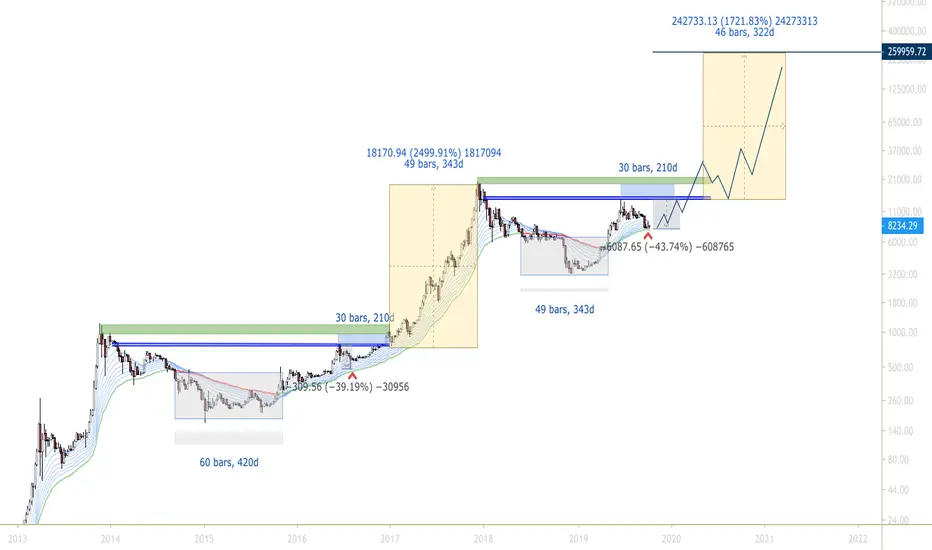
Future of Bitcoin (Fractal)Brief explantation of this fractal:
Sept 2014 - Nov 2015 was the first BTC broke under the moving average ribbon. This resulted in a 420 day bear market.
June 2016 - Aug 2016 - Bitcoin slowly swung out of the bear market and rallied until it met resistance @ $786 which lead to a 40% correction, signaling a short term top
*Note: The short term top at $786 took about 210 days to get retested*
Dec 2016 - Very shortly after, $786 Bitcoin tested it's previous all time high @ $1183, and continued up.
January 2017 - Dec 2017: After BTC broke above previous highs, we spent in 343 days in a bull market rallying over 2500% from $1183 - $19,954.
Where we are now: I correlate this recent price movement to the June 2016- August 2016 scenario. So far we have corrected 43% after swinging out of the bear market.
What's next: If Bitcoin follows a similar trajectory (and as long as 7.7k isn't breached) I believe it'll take about 200~ days (January 2020) to retest the short term top at $13,900. Breaking up would give us an instant push to 20k and new highs.
I believe Bitcoin will reach a generational top at $250,000. From there, a slow bleed and dried up volatility.
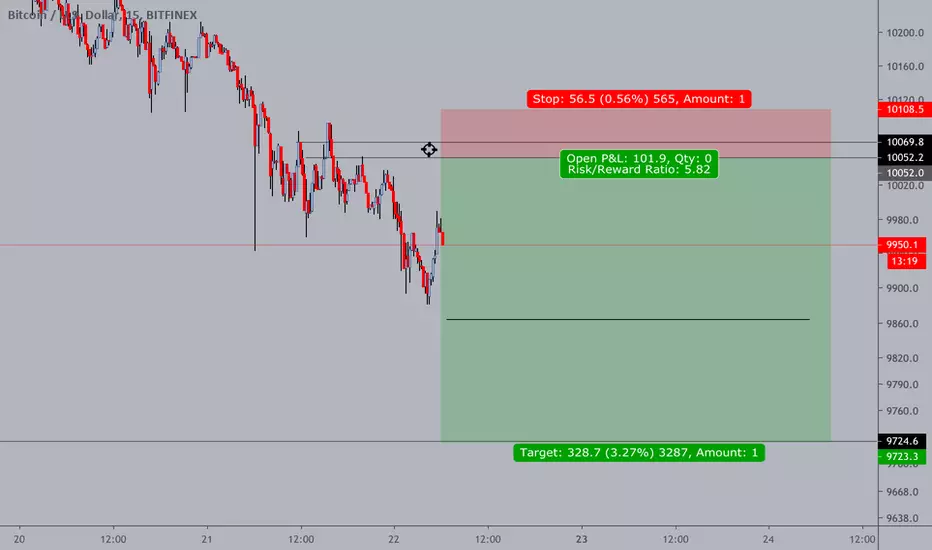
Bitcoin Update en attende de rachat 03/10/2019Bonsoir à tous, content de vous retrouver sur le Bitcoin j'avais posté un peut vite ma chart pour la précédente analyse mais l'idée été là, celle de short le marché pour ensuite jouer un potentiel gros mouvement vers le haut avec +10% de gain potentiel a la clé qui sait ?
Voici la Maj du plan, je m' attend a quelque chose comme cela...
Bon trades à tous

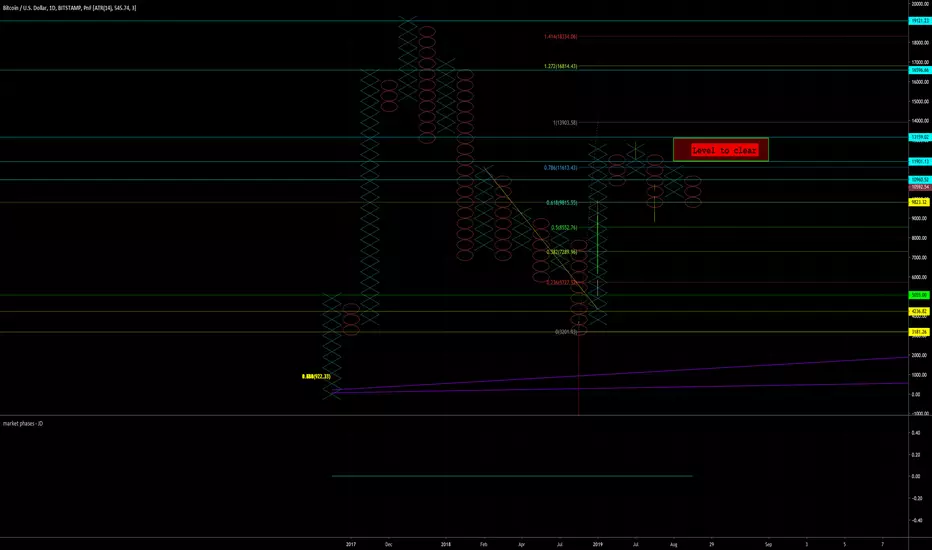
11900 is magic number to clearpoint and figure charts offer a great way to filter out noise and false breakouts