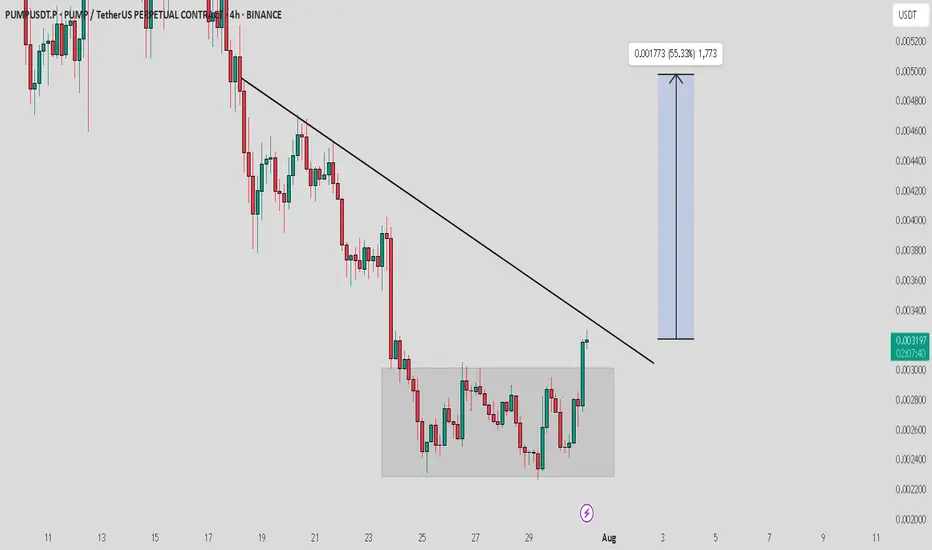
PUMP / USDT : Looking Bullish PUMP/USDT Analysis:
PUMP/USDT shows strong bullish potential after breaking out of consolidation. A retest to the box area is likely before a breakout from the trendline resistance. Once the trendline is broken, expect a major rally with a 40-50% potential upside.
Key Levels:
Support: Consolidation Box
Resistance: Trendline
Wait for confirmation of the trendline breakout before entering. Always manage risk with a stop-loss and stay patient for a clear move. The setup looks promising for a solid bullish rally!
Longidea
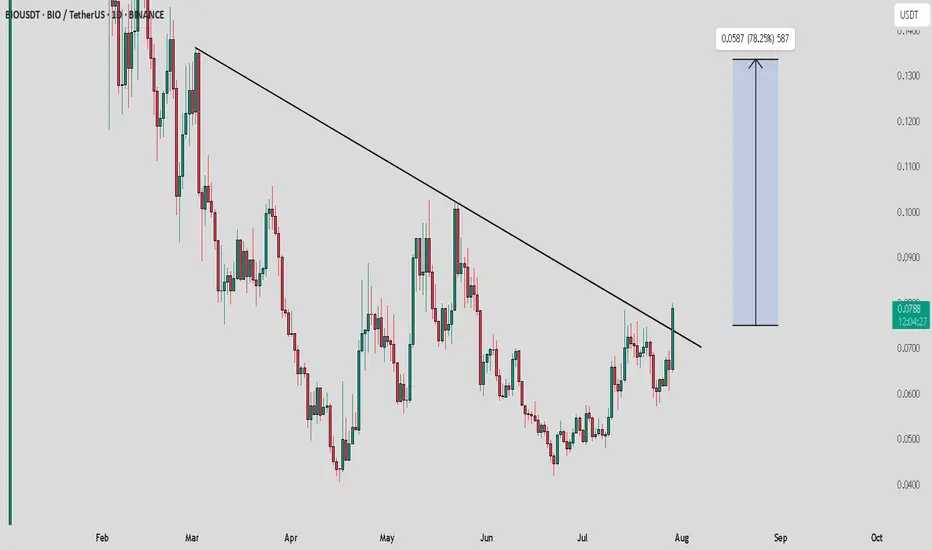
BIO / USDT : Breaking out with strong potentialBIO/USDT breaking resistance with Strong potential
Bullish Scenario: If the price maintains momentum above key support, expect a continued move towards $0.15.
Bearish Scenario: A failure to hold above support could lead to a pullback to lower levels.
Pro Tip: Enter on confirmation of support hold or breakout above $0.075. Set tight stop loss to manage risk.
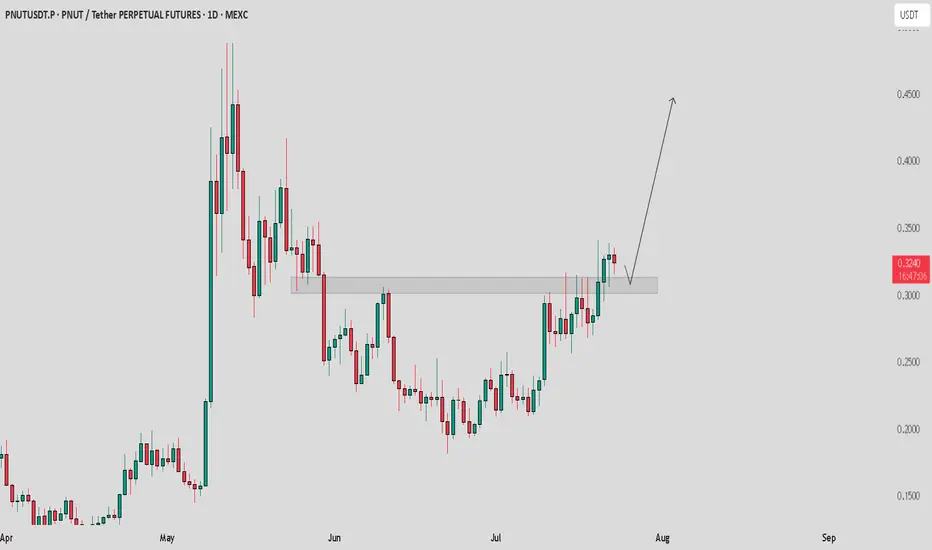
PNUT / USDT Breakout and retest analysisPnut/USDT - Breakout & Retest Analysis
Pnut/USDT has broken out from horizontal resistance, and a retest is currently in progress. If the retest holds, we can expect a strong move towards $0.4 - $0.5.
Bullish Scenario:
Successful retest and holding above the resistance zone should confirm further upside towards $0.4 - $0.5.
Bearish Scenario:
If price fails to hold the breakout level, we may see a pullback and retest of lower levels.
Pro Tip:
Avoid excessive longs. Wait for clear retest confirmation before entering.
Set proper risk management to protect your trades.
IOTA / USDT looking good to buy at the price of $0.2100IOTA/USDT faced rejection from local horizontal resistance and is now heading for a retest of the lower support zone. If market conditions remain stable, the $0.2100 area looks like a solid buy zone. The structure suggests a healthy pullback before a potential strong bounce.

ES weekly trading plan for May 6 - May 9ES closed bullish last week. I expect the high of previous weekly candle to be taken out. 15M structure is bullish and in discount zone. I expect manipulation in London open on Tuesday, reversal and move to previous week high

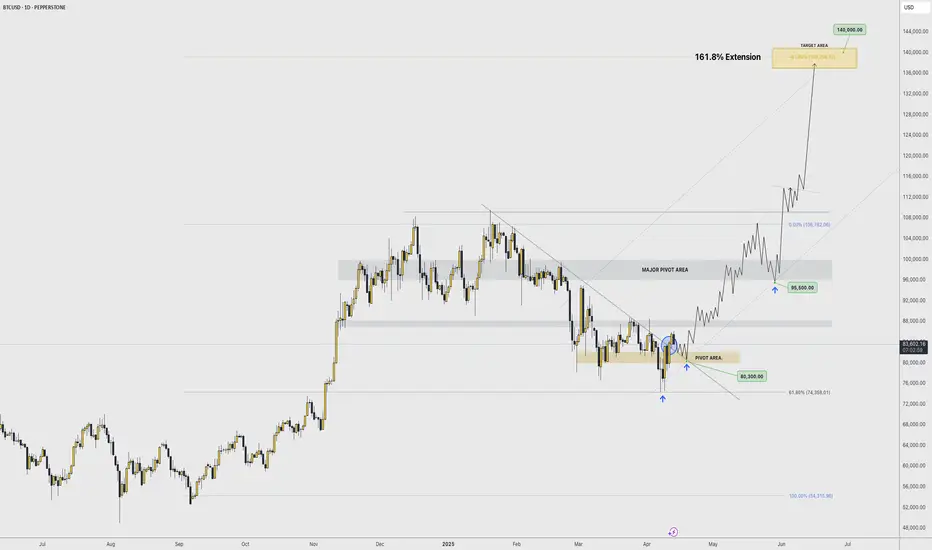
BTC REBOUND? 〉$140,000 NEXTAs illustrated, I'm visualizing what the next impulsive wave could look like.
Price has broken out of a major daily trend line.
It makes sense for the week to have started trading lower to find it's low and potentially bounce with strength sometime this coming up week and into the next.
The next pivot area is between the $82,000 - $80,000 range based on previous week's lows and daily low levels.
An interesting buy opportunity is forming and the potential entry is illustrated as the "pivot area" marked in yellow.
Then we have a major pivot range near the $100,000 psychological price.
.
This could be a price where some short term traders get out "in case it's just a pull back before a collapse" type of decision.
We can't ignore how much price consolidated between 100,000 and 96,000; and so that is the next stepping stone for BTC before breaking to ATH's of at least $120,000.
My personal target is set at the 161.8% extension level as illustrated.
--
GOOD LUCK!
Persa
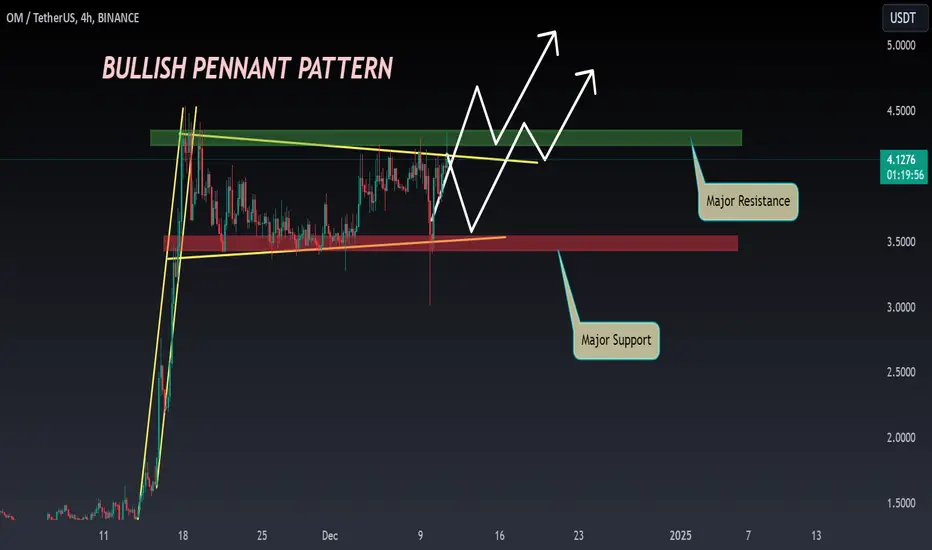
OM ANALYSIS🔴 #OM Analysis :
🔮There is a formation of "Bullish Pennant Pattern" in #OM in 4hr time frame. #OM is trading around its all time high level. We may see a little retest before a bullish move
⚡️What to do ?
👀Keep an eye on #OM price action. We can trade according to the chart and make some profits. ⚡️⚡️
#OM #Cryptocurrency #Breakout #DYOR
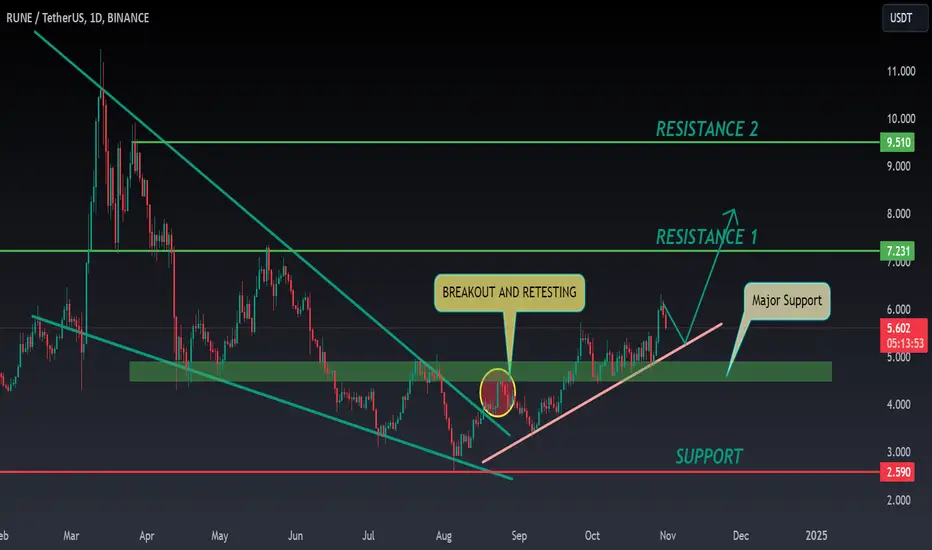
RUNE ANALYSIS🔮 #RUNE Analysis
🌟🚀 As we sail earlier, #RUNE performed the same. Currently #RUNE is trading above its major support zone and we could see a retest before our next target
🔖 Current Price: $5.575
⏳ Target Price: $7.232
🏷Remember, the crypto market is dynamic in nature and changes rapidly, so always use stop loss and take proper knowledge before investments.
#RUNE #Cryptocurrency #DYOR
FTM Update - 11.10.2024 / Long Idea 1d: we see an upward off and a target in the form of a key zone and a high.
At the moment we are getting reaction from weekly imbalance buyer, for confirmation I want to see structure change at 1h and entry pattern formation.
Observe risk management !

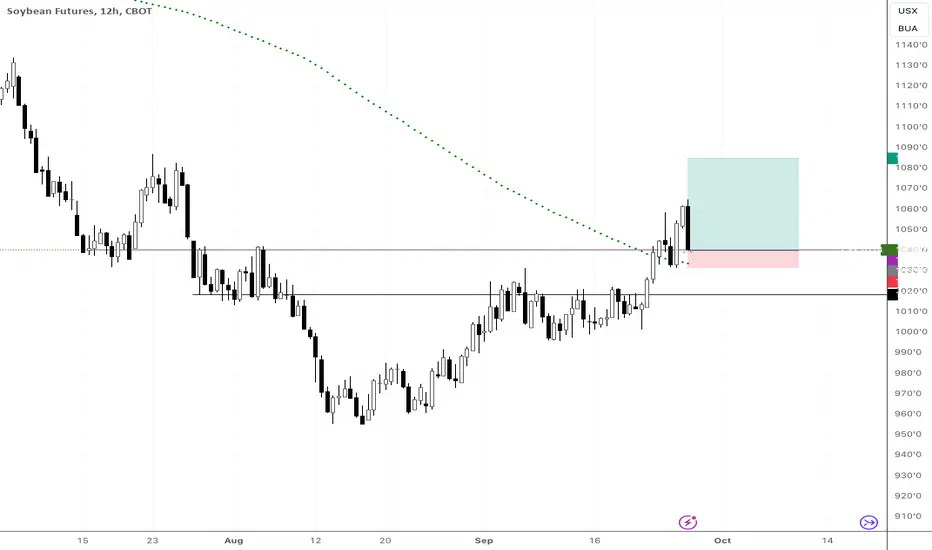
Harvesting profits - BULLISH on SOYBEAN!!!! Long NOWIt doesn´t get easier. Lets make money together!!!
Long at market price.
Stop at previous lows.
Target previous highs.

NEO PlanNEO has broken the trend line, so we're waiting for a retest here. Hopefully, we'll get a good setup with a very small stop-loss (SL).

WIF Plan**WIF** is looking good here. It's getting support on the daily timeframe and showing upward momentum. You can take an entry with a small stop-loss (SL). If the SL is hit, then the next level is mentioned.

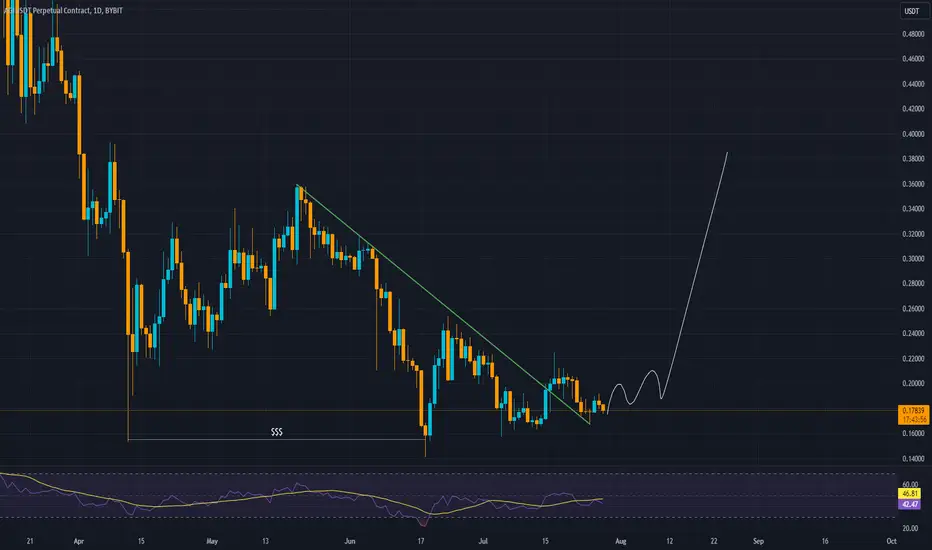
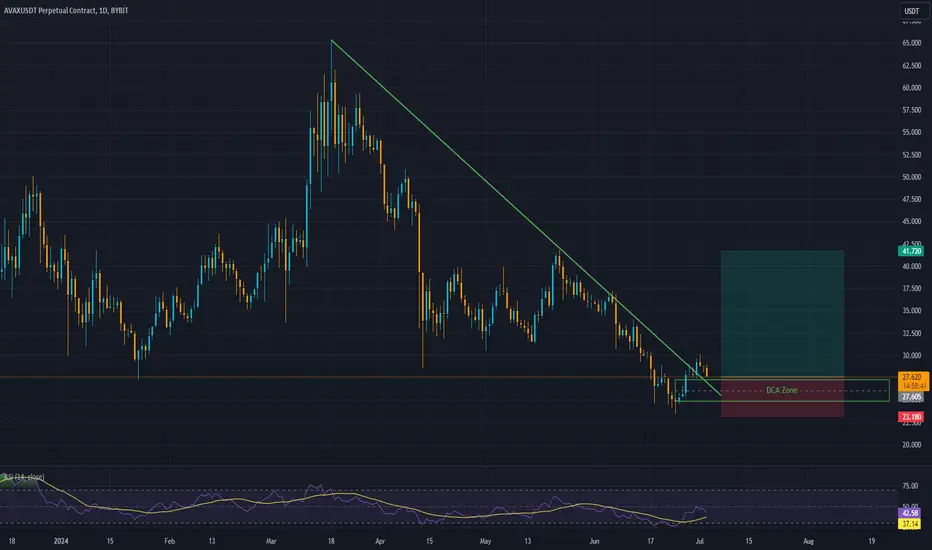
AVAX Long PlanAVAX has broken the trend line and is now retesting that level. It appears to be a good opportunity to take a long position.
What are your thoughts?
Keep in mind that everything works well in the absence of market manipulation.
Always manage your risk effectively.
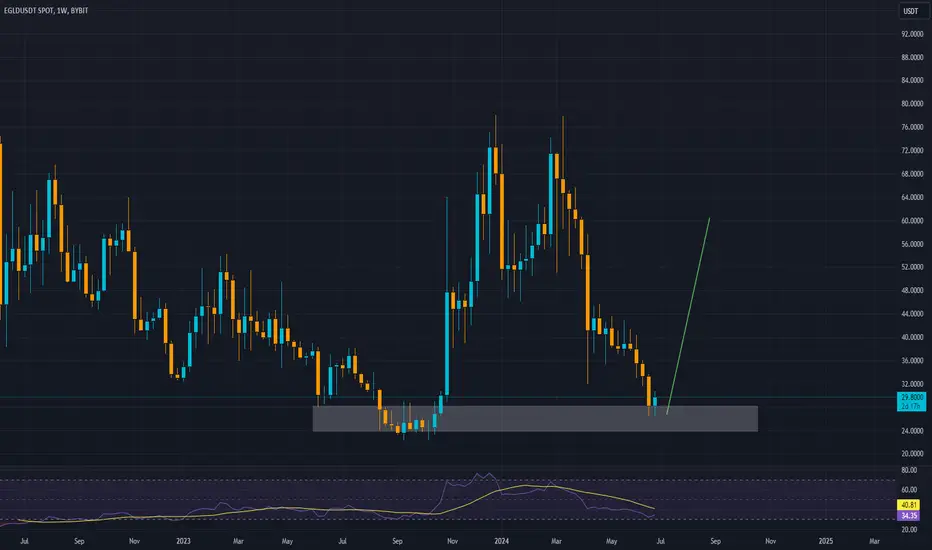
EGLD PlanEGLD appears promising at the current level. If it holds here, an upward movement is likely. Keep a close watch on it and always manage your risk effectively.
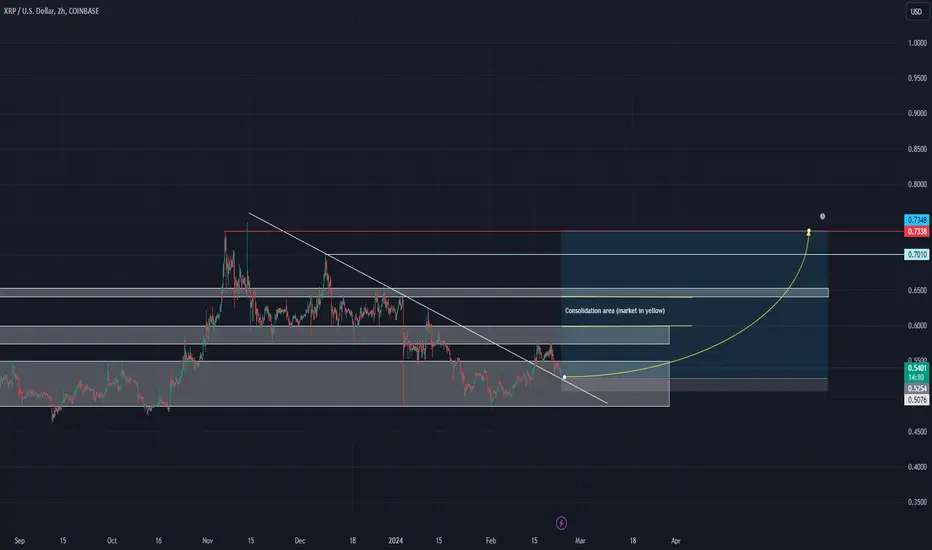
BULLISH LONG XRPUSD to 0.7348BULLISH LONG XRPUSD to 0.7348
LONG IDEA FROM 0.5273
SL: 0.5067
TAKE PROFIT: 0.7348
getting the bulls ready for XRP
SPT possible BUY setup Though this might be a risky play, since SPT is posting results in couple of days, I love what the charts are telling me at the moment.
This Chicago based firm provides social media management software for businesses.
Sprout Social has recently targeted larger companies for partnering, establishing a nice contract with Salesforce.
What am I looking now:
1. Though I mentioned that this play is a risky one, due to upcoming earnings, SPT i currently trying to break from it's Daily Cup and Handle formation.
2. Today's try was not a god try of breaking the highest point of the Cup and Handle formation, sitting at around $66.70 price level. Price did break that point at one moment, but it quickly failed to maintain above it.
3. Selling pressure was high unfortunately, there were nearly 782k shares sold once it broke through the resistance level.
4. Since I am considering this a risky play, my initial entry will be small, with stop loss possibly larger than usual. Stop loss will be sitting at around $57.39 price level, which is just below the wick of the last candle which bounced from the 50EMA.
5. Once the earnings report are published, I will either close the trade or add to the position, depending on the results posted.
As always, please do your due diligence, this is just an opinion.

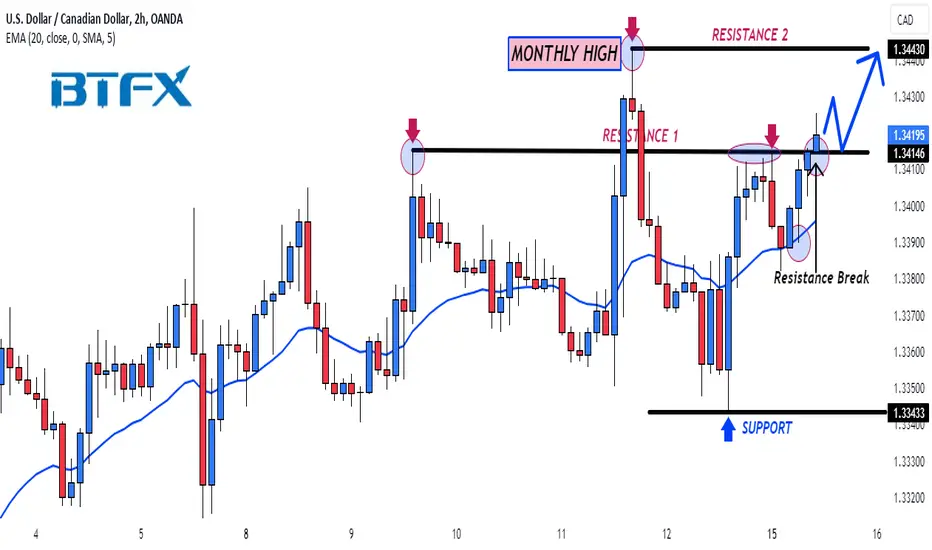
USDCAD Approaching Monthly HighHi Traders!
USDCAD is approaching its monthly high, and there are opportunities for long entries to target the monthly high.
Here are the details:
The first resistance at 1.34146 (which will now act as support) has just been broken, and the next targert looks to be the second resistance at 1.34430, which is also the monthly high.
We are looking for 1.34146 to hold as the new support. The plan here is to buy dips around this level to target levels near 1.34430. As 1.34430 is the monthly high, there is likely to be strong selling pressure at this level.
Preferred Direction: Buy
Technical Indicators: 20 EMA
Resistance (MONTHLY HIGH): 1.34430
Support 1 (PREVIOUS RESISTANCE 1): 1.34146
Support 2: 1.33433
Please make sure to click on the like/boost button 🚀 as your support greatly helps.
Trade safely and responsibly.
BluetonaFX
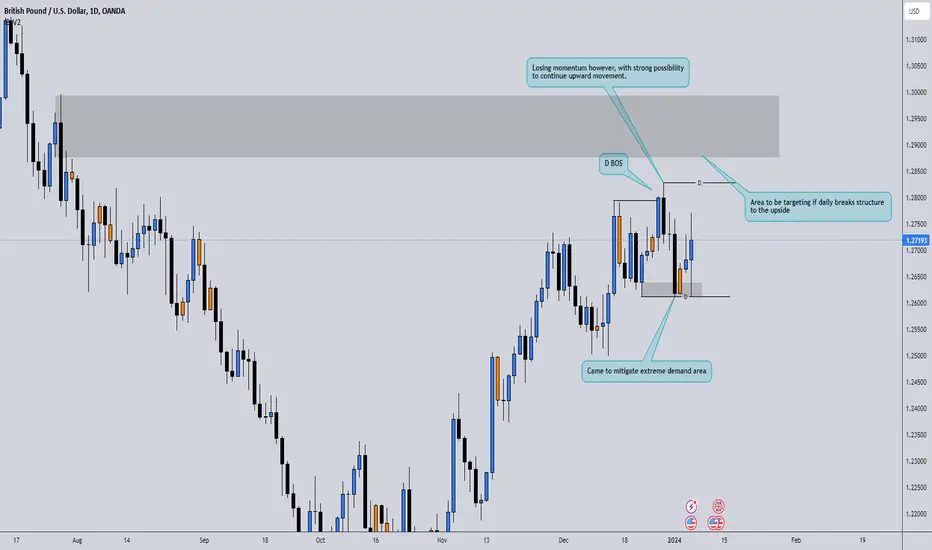
GBPUSD Upward movehigh possibility that GBPUSD is going to go up higher after coming to mitigate extreme demand area, it does look like some supply came into the market, forming a doji, however could have been due to being Friday and liquidity coming out of the markets for profit and capital preservation of the large institutions.
However strong long possibilities at this point.
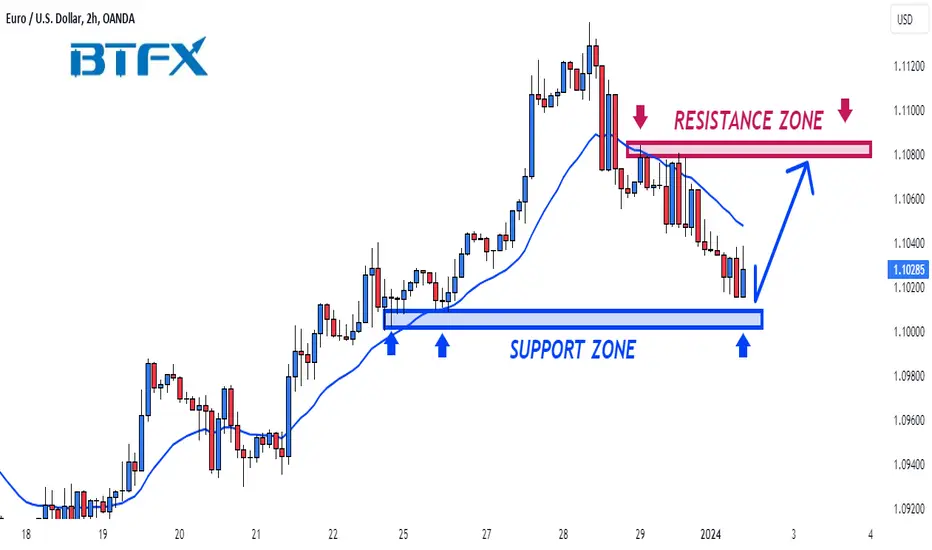
EURUSD Bullish Near Support ZoneHi Traders!
EURUSD looks bullish near the support area as the market is looking to re-test the 20 EMA and possibly target the resistance zone.
Here are the details:
The market is trading near the support zone, and we are looking for a bounce near this area.
The strategy here is to buy market dips and retracements.
Preferred Direction: Buy
Support 1: 1.10018
Support 2: 1.10093
Resistance 1: 1.10793
Resistance 2: 1.10853
Technical Indicators: 20 EMA
Please make sure to click on the like/boost button 🚀 as your support greatly helps.
Trade safely and responsibly.
BluetonaFX
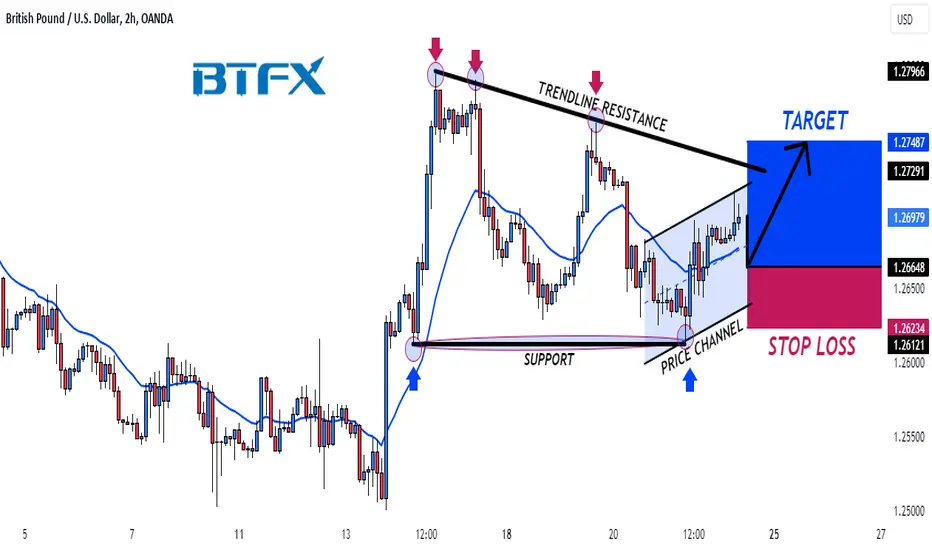
GBPUSD Long to Trendline ResistanceHi Traders!
The GBPUSD 2H chart looks bullish and is targeting the monthly trendline resistance.
Here are the details:
After recovering from monthly lows, the market is now on a steady incline, showing swings of higher highs and higher lows. The market has also recently broken and closed above the 20 EMA. Our plan here is to buy market dips and target an exit just above the trendline resistance.
Preferred Direction: Buy
Entry Level: 1.26648
Stop Level: 1.26234
Target Level: 1.27487
Technical Indicators: 20 EMA
Please make sure to click on the like/boost button 🚀 as your support greatly helps.
Trade safely and responsibly.
BluetonaFX
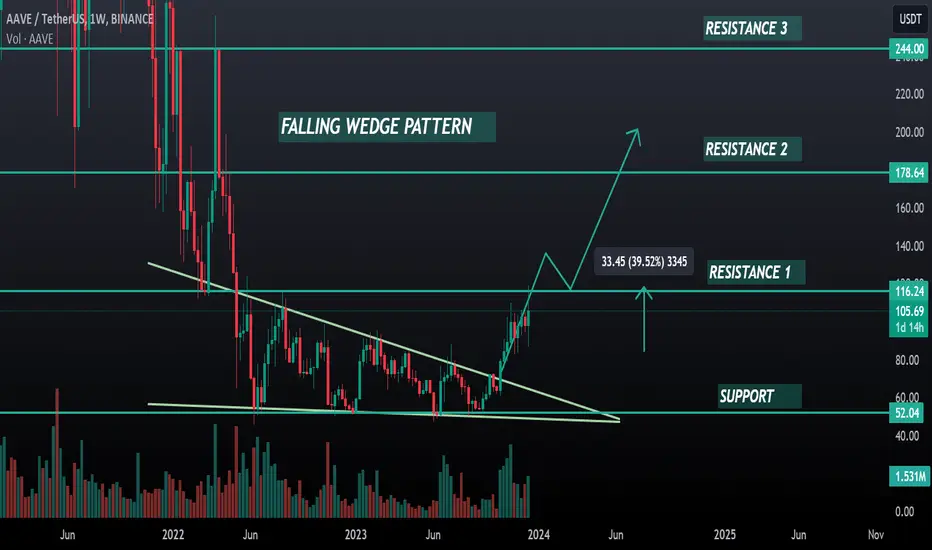
AAVE ANALYSIS🔮 #AAVE Analysis 🚀🚀
💸💸 As we said in our earlier post, #AAVE has performed well. We reached our first resistance very easily. 39.5% move done from the day we posted #AAVE analysis. If #AAVE breakout the first resistance and closes above the resistance then we will see more gain📈📈
📌Current Price -- $116.24
🔰Target Price -- $178.64
⁉️ What to do?
- We have marked crucial levels in the chart . We can trade according to the chart and make some profits. 🚀💸
🏷Remember, the crypto market is dynamic in nature and changes rapidly, so always use stop loss and take proper knowledge before investments.
#AAVE #Cryptocurrency #DYOR