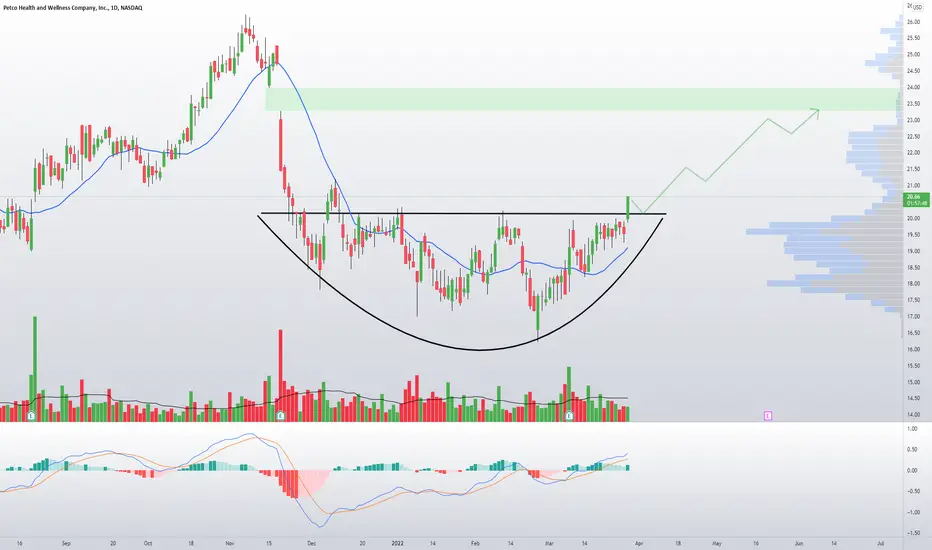
$WOOF I'm longI'm long WOOF calls . As a frenchie owner (his name is Frisco hence my trading name), I know the amount of $ people are willing to spend on their pets.
But also technically speaking, WOOF is coming out of a nice rounded bases and breaking out today. With that huge gap above needed to be filled, this looks like a good R/R long trade, aiming for $24.
Don't be surprised if there is a retest of the breakout zone, but longer term I see more upside.
Longidea
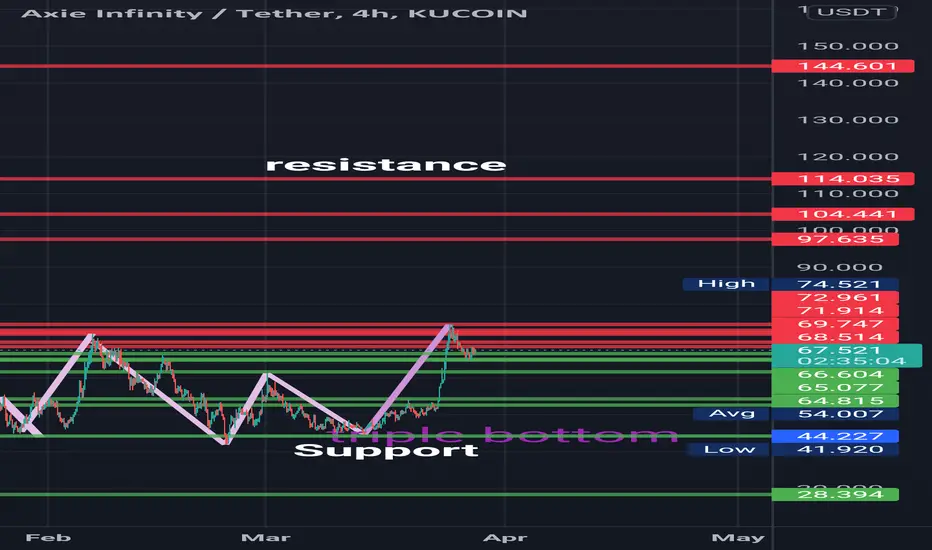
Axie created a triple bottomaxie triple bottom let's goooo. resistance and support marked on chart. will we make a run to ath? let's hope btc stays bullish. not a financial advisor do your own research. the king paves the way. always use low leverage. always use stop loss and have an exit strategy. good luck and like/follow if you liked my chart.
$AMGN watch for break of the 240 zoneSellers have been present in Amgen , keeping this stock under the 240 zone since FEB's pop.
Lot of dark pool and call option flow showing bullish signs as the stock continues consolidating and eating away supply.
I think the bulls win here, alarm it for $240 as a good long idea.
I'm in a starter JAN 275c looking to add more positions upon breakout
Conversely , if bulls fail to capitalize downside target would be 220 zone.

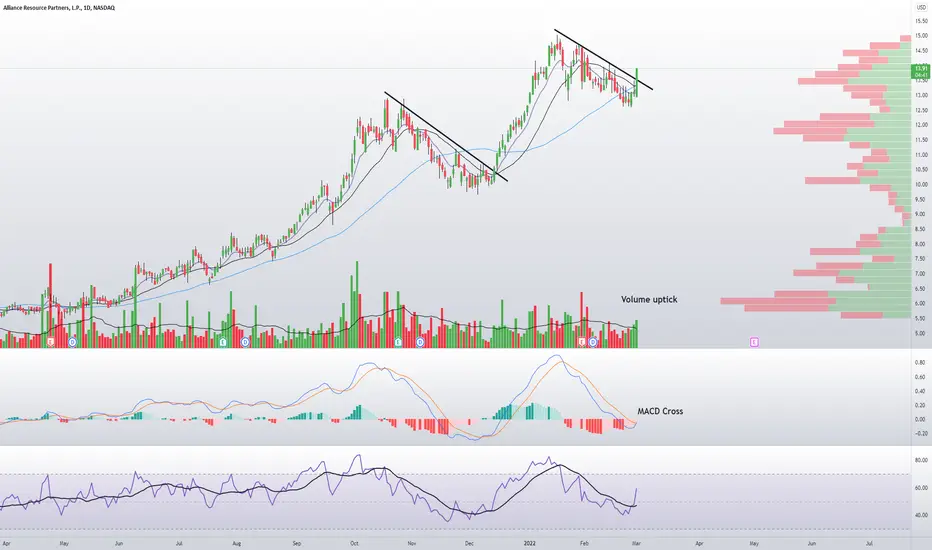
ARLP Long IdeaWent long starter on ARLP shares and APR 15 Calls seeing some volume.
Nice breakout of falling wedge looking for $15.8 / $16 zone in coming month
Stop loss $13
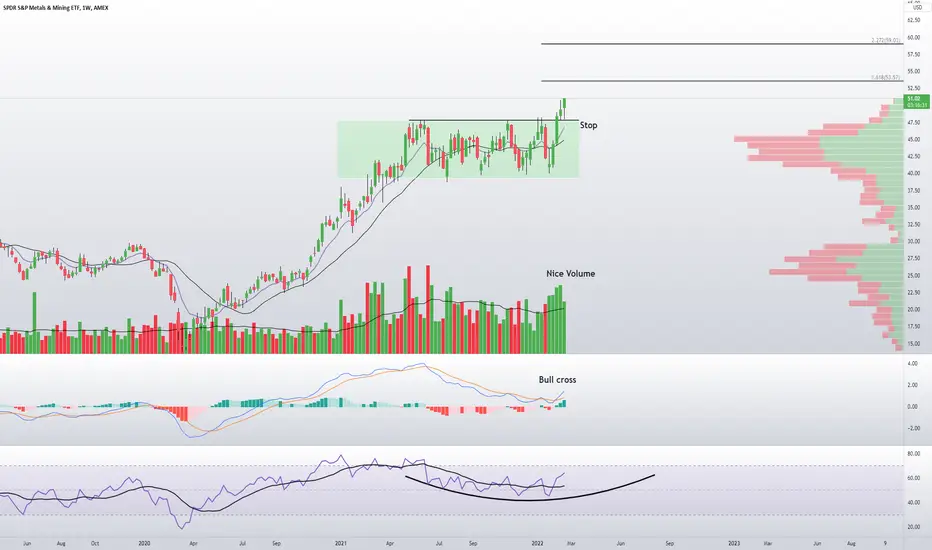
XME Metals and Mining Weekly Long IdeaWeekly chart on XME looks bullish IMO.
I went long commons with price targets above 53.5 and 59 , stop around 48.
Nice breakout retest bounce and the volume leads me to be bias to more upside.
Swinging this with shares, but the April 54C also looks active with 3K OI
EURUSD short term BUY trades once againPrice has been respecting that support of 1.13000 very nicely so I've taken another long from there, I'm holding my trade a risk free at the moment as price on the higher time frame does look very weak, so this upside move we are seeing now may just be the retracement before then going lower.

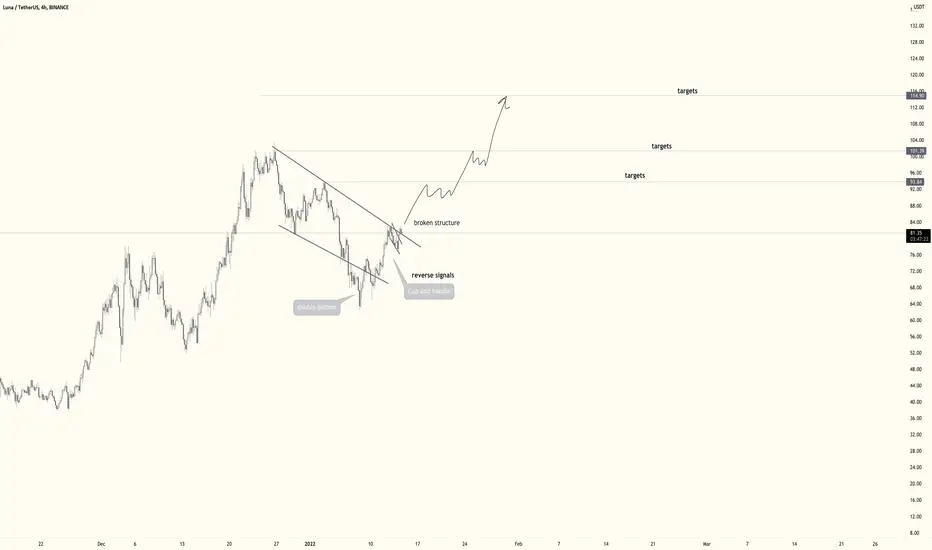
Luna "terra" next ATH ?After 20 days of correction, Luna is broke the trend line. We can see that double bottom and cup and handle at the end of the structure.
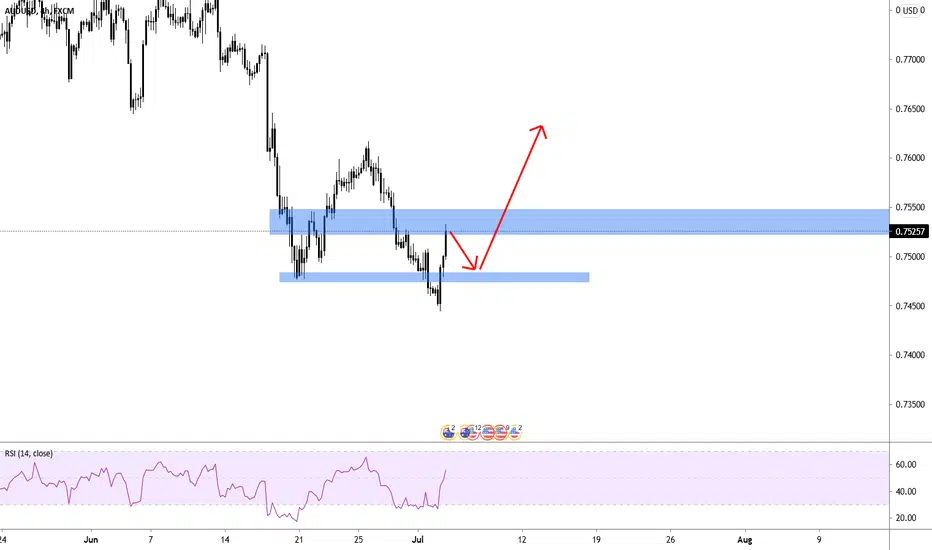
AUDUSD buy trade ideaLooking for AUDUSD to make similar moves as EURUSD as we can hopefully get more weakness for the USD. So when price reaches the area of 0.71700 I will be looking for rejection and a push back up, if price breaks below the last higher low of 0.71500 this idea is invalid. Ill try update, and another reminder to always risk manage make sure you have a plan and stick to it!! good luck everyone

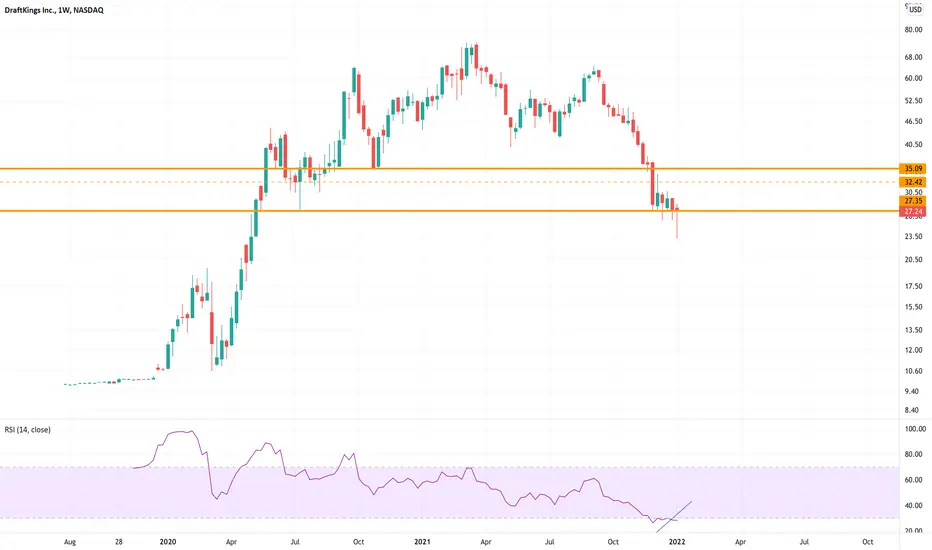
DKNG: another bounce candidate?DKNG :
Some pros and cons to play a potential bounce.
--Big Wyckoff distribution on weekly and daily.
++ Hammer candlestick on weekly (indicating bullish reversal if next candle confirms it, i.e.we get follow through)
++ Bullish RSI divergence on daily (that you can't see on my weekly chart)
Since I like the set up I will look for an entry today, but only for a swing trade (maybe 1 or 2 weeks max ). My target is around 33-35 .
Be careful below 27.
Trade safe!
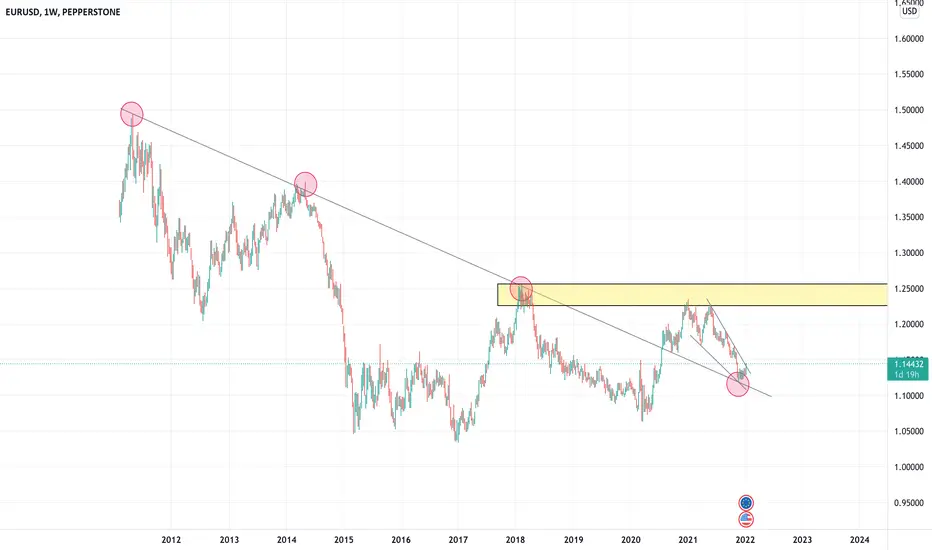
EUR/USD Longterm TAThe price breakout down trendline then retest trendline. Again breakout bullish pattern. What's your profit target?
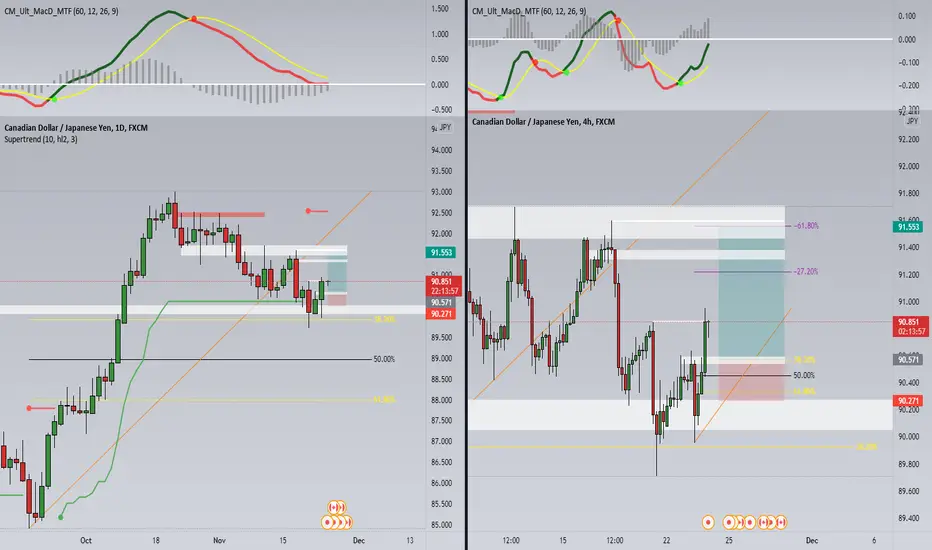
CADJPY Correction 1D-4HJPY still weak. Waiting for Cad to bounce from BOS.
DISCLAIMER: My idea diary, not advice.
CHFJPY Inv. H&S. - 1:4 - Waiting 4 BOSWeekly pullback after impulse. Reached 38.2% weekly retracement. Inverted head & shoulders, trend break, good R:R, need to wait for the break and retest, no trade until then, unless something changes.
DISCLAIMER: This is my idea diary, not advice.

Macy's rocket ready for launch! LongHey Guys!
I see a good Long potential for M .
We are testing 50MA price zone on M-chart and looks like we are ready for break-out and push the price to 200MA on the Month chart.
Price stays very close to the 50MA for more than 5 months. - good sign for long. Also, we see a huge volume on the "bottom".
SL ~ 15-16$
TP1 200 MA on moth chart
TP2 40% zone.

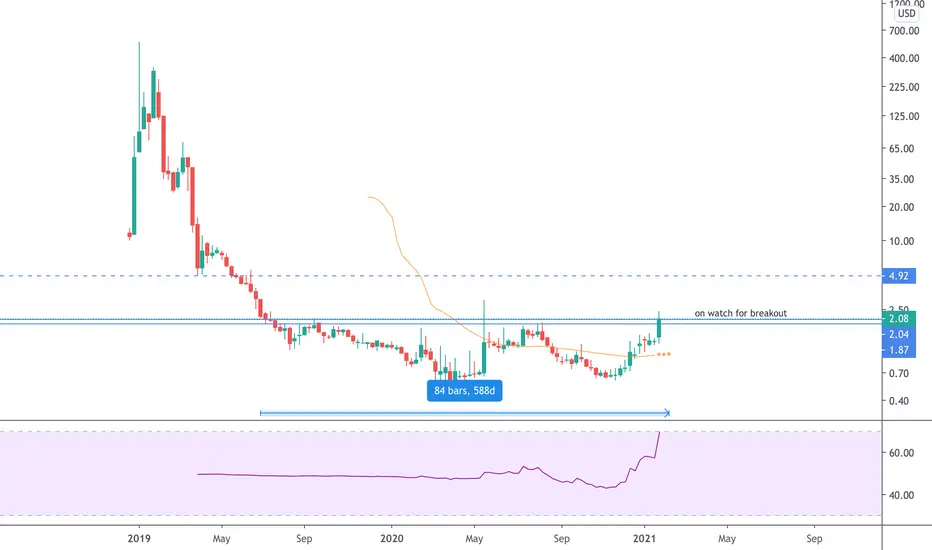
PHUN: BREAKOUT CANDIDATEPHUN : low cap software company.
After forming a multi month bottoming base with a nice double bottom , I'm watching PHUN for a potential breakout of the 2.08-2.10 zone.
A break could take us to USD 4.92-5 zone.
Trade safe.
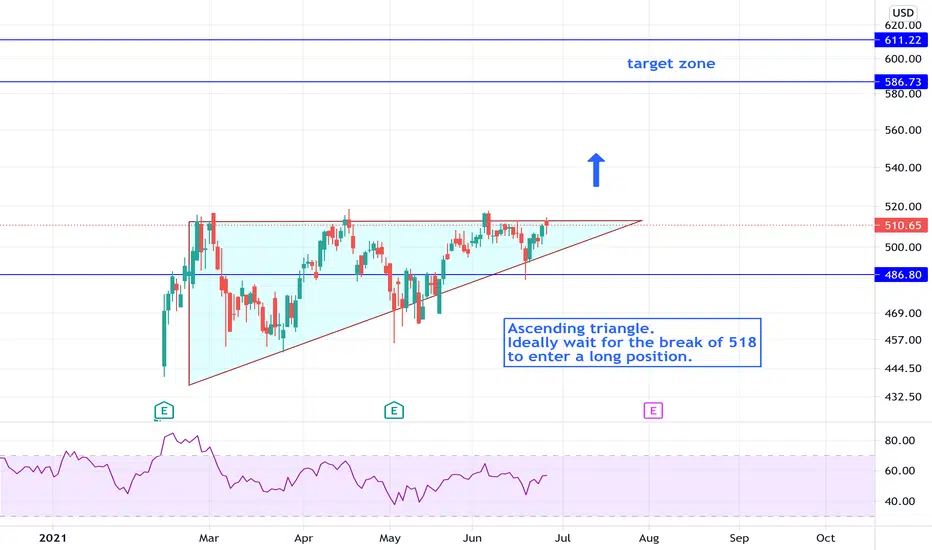
ZBRA: ASCENDING TRIANGLE - BIG MOVEZBRA :
Ascending triangle forming on Zbra.
To avoid fake breakout, wait for a move above 518 to enter a long position.
Potential move of usd 90 to the target zone mentioned on the chart.
Note that the pattern can fail if the overall market drops.
Trade safe.
DOW JONES - Bounce off the Trendline support, POC and .618 NextStraightforward analysis on the US30 using fib pull , fixed range to demonstrate how respected this PA is to these levels pulled .
Market structure still in tact and expecting PA to either tap the POC and marked level and continue the trend .
Like and Follow for regular analysis

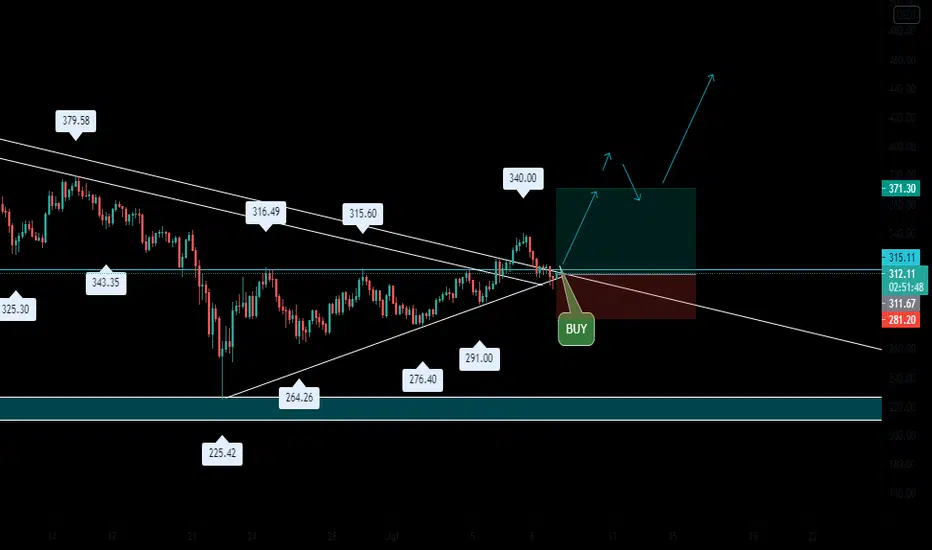
BINANCE GO UP BUYTRADING SUGGESTION:
Now we looking to the market got retest in breakout zone,so now take a buy trade,GOOD LUCK
BINANCE HIT OVERALL BUY TREND
.
.
.
.
TAKE A TRADE,SIT BACK AND RELAX
LIKE AND SHARE
Tutorial | How To Create An Order Panel Trading TemplateThe TradingView Order Panel doesn't currently have a template setting to save the order parameters. Here's a work around thanks to a comment from @thatjeph Appreciate it!
Instructions:
1) Using the Long/Short Drawing Function and drop it on a chart.
2) Adjust the levels to reflect the trade entry, take profit, and stop level. (Note: The default quantity is a bit weird)
3) Save the object as a Template named to reflect the settings.
4) Right click on the trade object and Select > Create Limit Order.
5) Boom - you Order Panel is opened with the trade setting from the order object.

AUD/USD Longing opportunityFor AUDUSD I see price pulling back to the demand level before shooting back up! From the Daily timeframe I saw divergence on the RSI indicator wchich shows a reversal happening.
FSLY: Ichimoku bullish set up with all levelsFSLY Ichimoku analysis and all supports and resistance
Ichimoku : Price above the cloud, lagging span broke kinjun and tenkan = bullish on daily, long trend.
Mind the 1st resistance and enter accordingly.
All levels are on the chart (support and resistances).
I'm long. Swing trade with option expiring in January 2022.
Trade safe.

GBPUSD LONG IDEAPlanning on entering on the 4H Buillish order and aiming to hold and target last weeks high.
This is a smart money reversal.
+300 pip potential.
Goodluck.

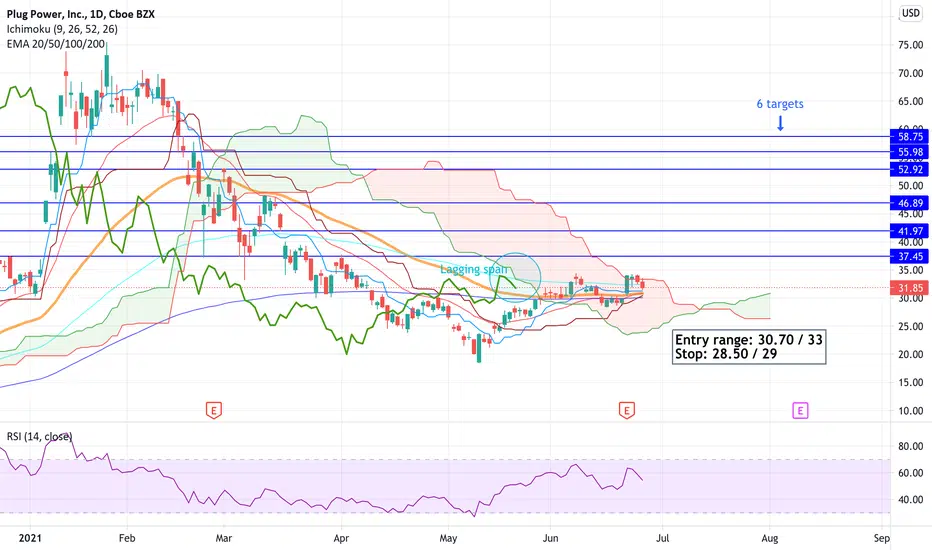
PLUG: WATCH FOR BREAK OUT OF THE ICHIMOKU CLOUDPLUG ICHIMOKU ANALYSIS :
The price is currently supported by Kijun, Tenkan and 20 and 50 EMAs, with Kinjun and Tenkan about to cross over. The price action is building pressure for a move above the 2 following resistances:
1. the current candle is just at the top of the cloud, looking for a break out.
2. The lagging span is stuck below the 100 EMA and the cloud. Watch for a retest and a potential break.
I'm entering a long trade on Plug .
Good risk vs reward trade as a stop can be placed just below the 50 EMA. Success will also depend of the overall market next week.
All targets on the chart .
Trade safe.