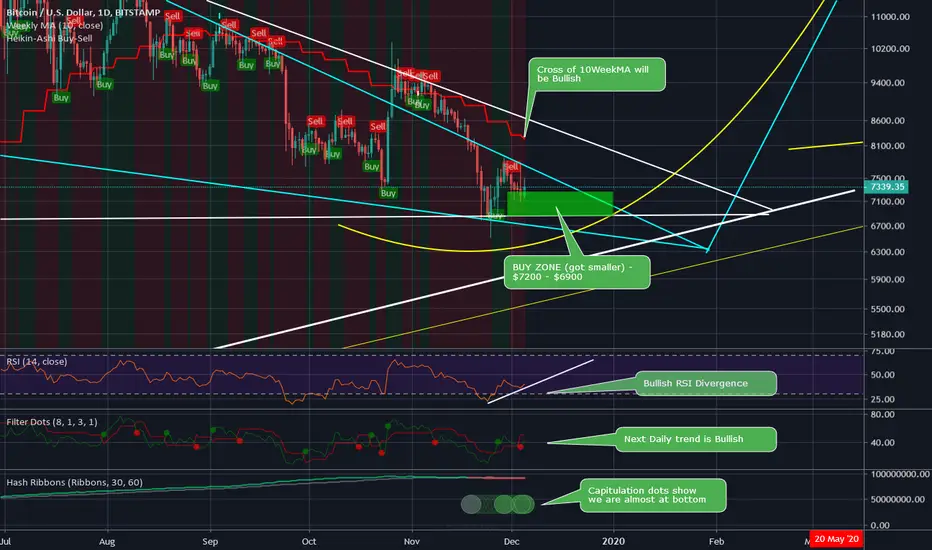
BTC - Buy Zone Getting Smaller - Get It While You CanBTC showing several bullish signals going into the turn - up into halving.
Cross of 10WeekMA will confirm bullish trend upwards to retest previous highs $11K+.
Buy zone is getting smaller which is a good sign.
Bullish RSI Divergence and next trend showing bullish confirm we are in a turn.
Capitulation dots show we are towards the end of the downtrend - almost at bottom.
I think based on the pattern, previous repetitive chart history, halving, and stock to flow - WE GO UP.
PlanB - 12/3/2019
"Getting some questions about why in previous halvings (November 2012 and July 2016) it took well over a year for the market to start surging..
Well, it didn't .. look for yourself: in the chart the halving is when blue turns to red: the market immediately rises after a halving"
See chart in link
twitter.com
Thank you for liking, commenting, throwing up a chart, following, or viewing.
I am not a financial advisor. My comments and reviews are based on what I do with my personal accounts.
Disclosure - I am long MARA, GBTC, BTCUSD, GDX, and VIXY.
Short SPY , AAPL, ROKU
Longidea
USDCAD: Triangle Completion Could Indicate Long TradeWe may have a possible contracting triangle scenario if price drops from 1.3310. Price is still on the trajectory to reach the TP projection of the Garltey pattern @ 1.3415. A clear uptrend and with clear structure formation. Wait for confirmation before looking for any buy setups.

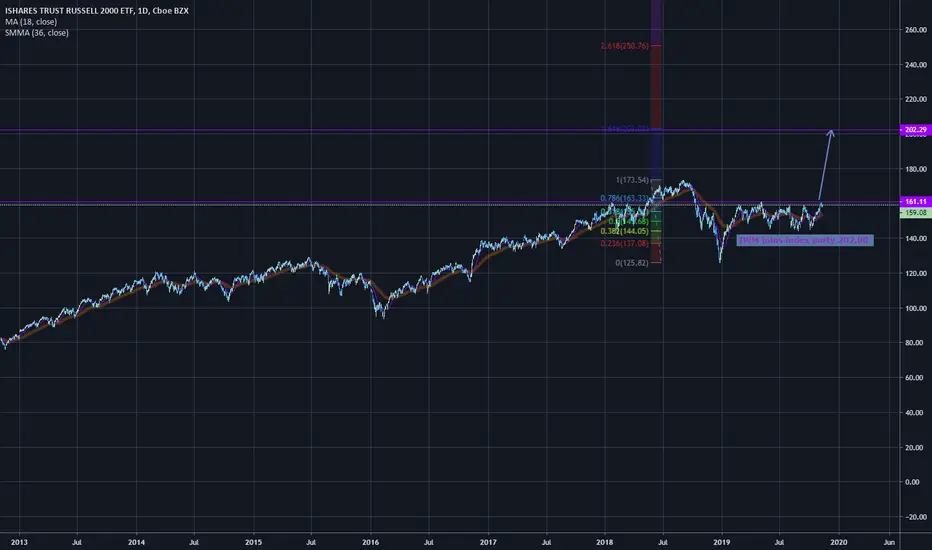
IWM joins index party: Price Target 202.02 bull market scenario price extension to 1618 fib level 202.
long with target price of 202.
buy 158-160
sell 200-202
for 27% rally
thank baby Jesus.
GBTC - Confirming BTC Bullish Reversal IncomingGBTC confirming BTC chart bullish reversal coming soon.
RSI is low, almost at 30 where it always pops shortly thereafter.
Fisher Transform ready to flip, same as BTC chart.
Filter Dots show bearish trend is exhausted and ready to flip bullish, same as BTC chart.
Gaps
Only down gap to fill (red box) is cut off by log support line which has over 20 points of contact.
Either we hold log support or go roughly 30% below support to close the gap. I feel this is highly unlikely, especially pre-halving.
All yellow boxes are up gaps to fill, implying we go up from here.
Price
Price is chillin on flat support of wedge.
Additional angled support/resistance combo line adds to support.
Cup and handle is rough here, not mathematically precise with handle at .618. But still fits the wedge, price, and pattern.
Thank you for liking, commenting, throwing up a chart, following, or viewing.
I am not a financial advisor. My comments and reviews are based on what I do with my personal accounts.
Disclosure - I am long MARA, GBTC, BTCUSD, GDX, VIXY.
Short SPY and AAPL.

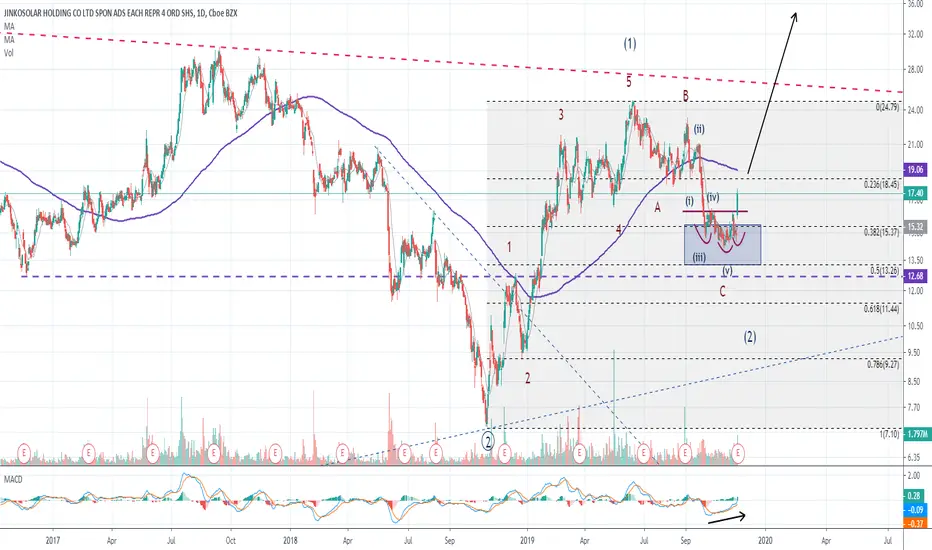
JKS - bright future for solar ahead?With ongoing worldwide trends towards clean energy, there is good potential for solar sector to shine in the years ahead.
After rather significant selloff recently some ideas are trying to put a bottom finally, and NYSE:JKS is one of them.
Good earnings released today and breakout through neckline of inverse H&S provide initial signs of reversal.
I entered position on breakout today, and plan to hold as one of core holdings for next year, with some short-term trading in and out.
How much momo in MOMO?After recent breakout, momentum in NASDAQ:MOMO may acellerate in November, with potential top being formed into earnings later this month.

Inverted H&S in Rite AidNice inverted H&S is being formed in NYSE:RAD . Breakout through neckline was supported by the volume, and ideal target is around 19-20$ for a very solid return.

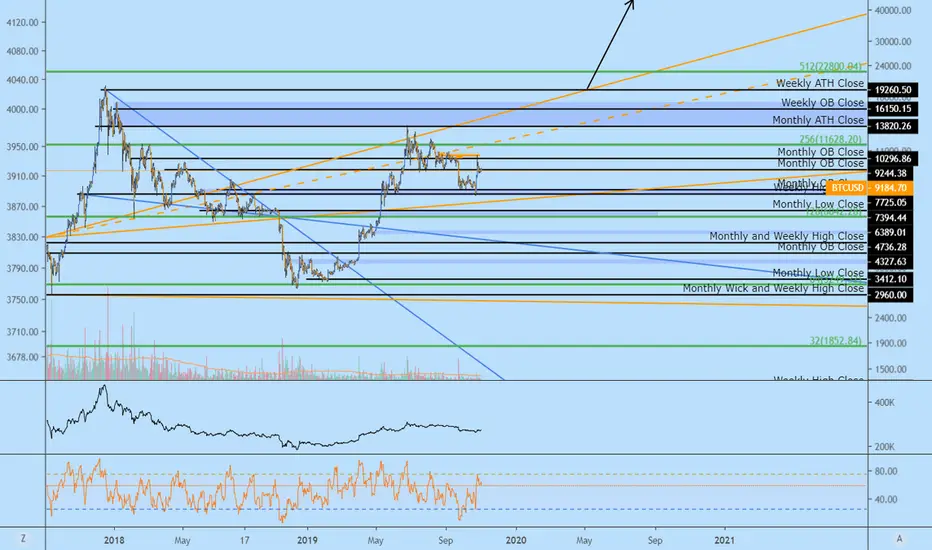
BTC's Journey to $4.8M | Stage 1: $45k | Mt.BFX May 2020 Halving
TA:
Power of Two
Orderblocks
Orderflow
BTC is a risky asset, it can go to $0.
This is not investment advice.
GBPCAD LONG IDEA-The 1W chart shows a re-test of the support TL on this triangle pattern. This shows that there is a lot of selling pressure and bears are in control.
If you look at price in the circled area, you can see that as price increases, the retracements are strong/deep; showing that if price were to continue higher, the bears will come back and drive price back down again:
-The 1D chart is what you're seeing right now. The exchange rate continues to close above the 61.8% zone on the Fibonacci, which would form the assumption that price is likely to rise to around 1.66920 on the C-D wave of the Harmonic pattern before turning to go south. Numerous tests of the support TL further support an increase in GBPCAD.
Now as, this is a bearish harmonic pattern we would be looking to short as we reach that 1.66920 area. This is inline with my thoughts on the weekly timeframe, (retracements are deep and therefore bulls will be stopped as we find resistance).
Please feel free to comment, tell me your thoughts and what you think!

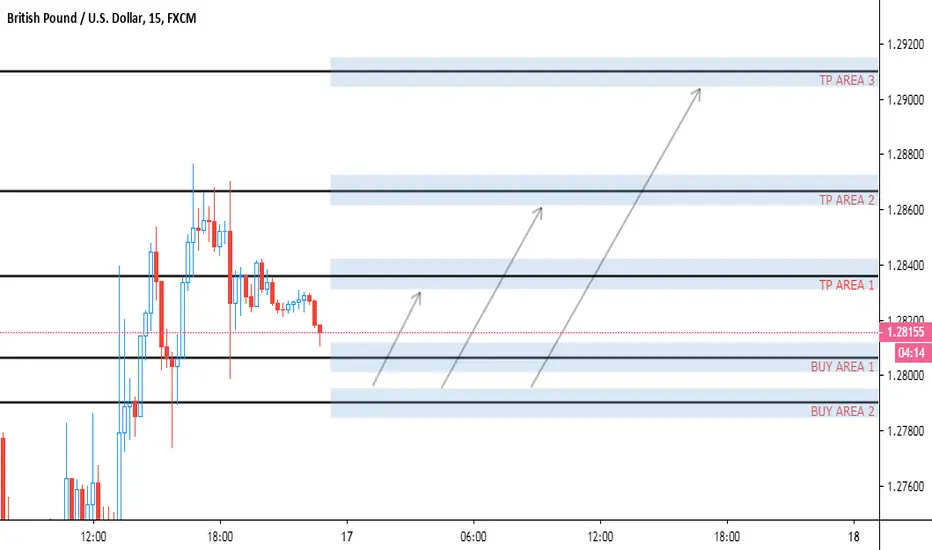
GBPUSD - BUY OPPORTUNITYLooking to BUY GBPUSD in BUY AREAS and to close position in TP AREAS. (30+ PIPS)
Looking to target price area 1.291
- Do not trade if price breaks through BUY AREAS with clear bearish momentum
- Wait for reversal pattern
Trade Safe
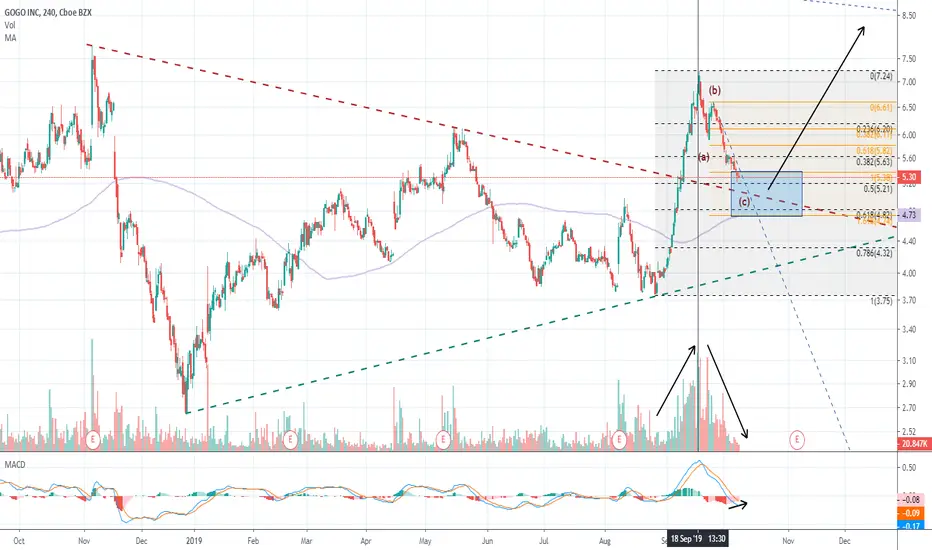
GOGO - prepare for another run higher?NASDAQ:GOGO shows constructive pattern for another leg higher. Retraced 50% of Aug-Sep rally on really low volume, and now is approaching potential support.
Good levels for low risk entry now, targeting another potential ~100% rally
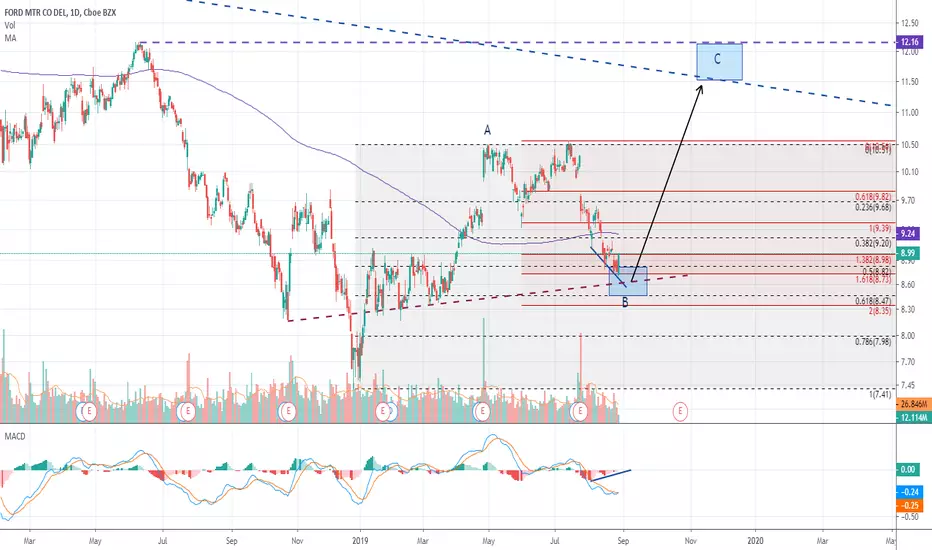
Ford - time to buy?Contrarian buy in NYSE:F looks relatively attractive. We continue to see some very nice MACD divergence on daily and price has already retraced by 50% of the move up in early 2019. Today's bullish engulfing candle (if formed) might indicate first sign that the bottom is in.
Trade is to buy at current levels, with stop at around 7.4$ and target of around 11.5-12$. Stop is likely to be moved higher, if more evidence is received that the bottom is in.
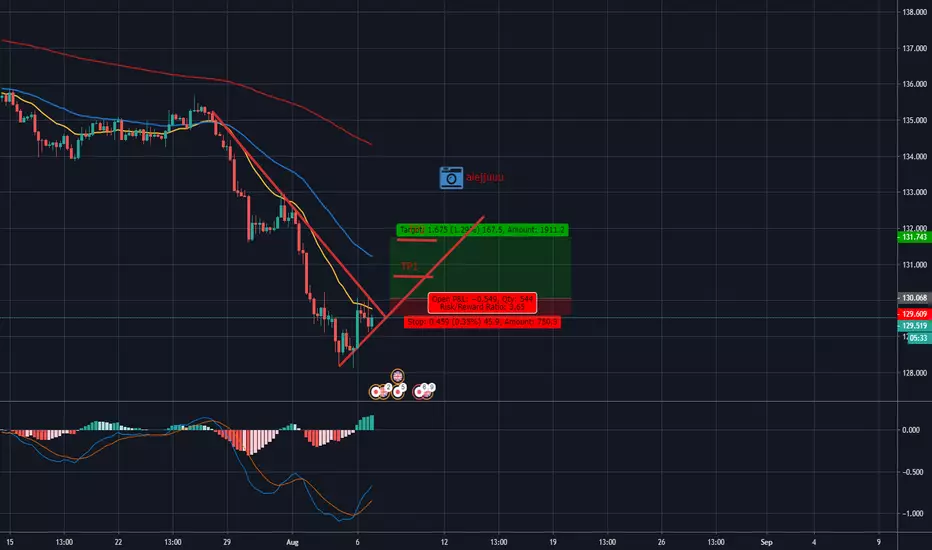
GBPJPY lond idea.If there's a breakout to the upside, I will be looking for buying opportunities for gbpjpy.
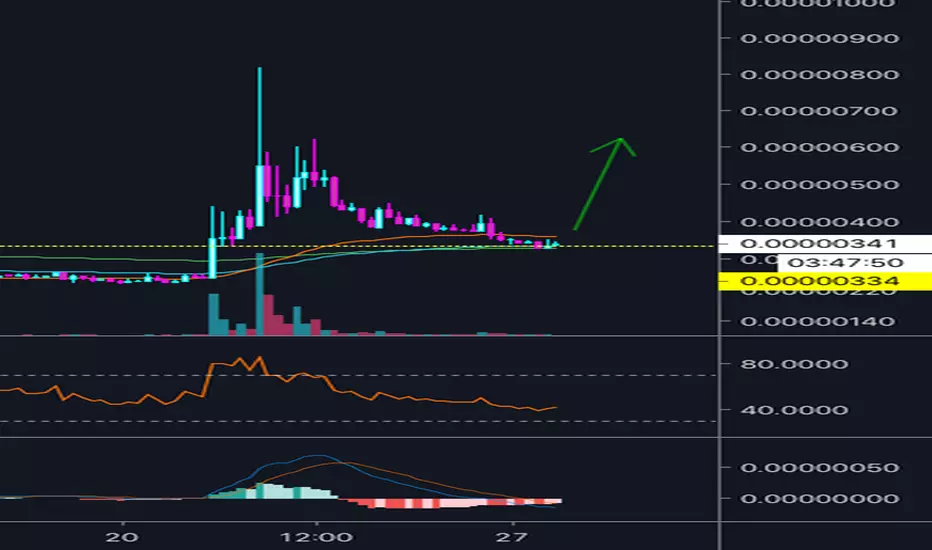
TNT EXPLOSION RD 2? Perfect storm?Here is BINANCE:TNTBTC on the 4 HR Chart. After a massive move and deep retrace back to a long term horizontal support and resistance level, wouldn’t be surprised to see another huge move from here! Especially if BTC consolidates, slows down or pulls back after its big move yesterday.
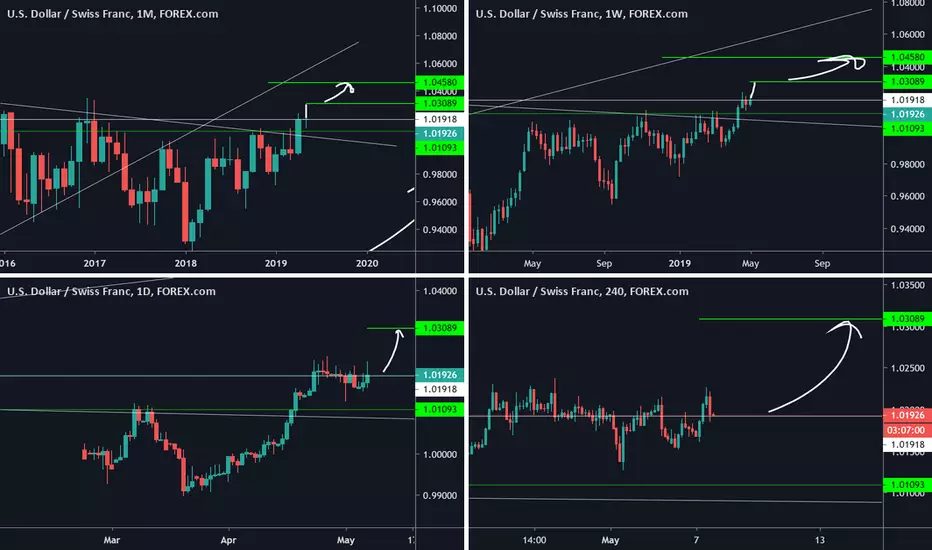
USDCHF multitimeframe projection !!!!waiting for confirmation from 4 hour chart if we get a good rejection we enter for a good Risk to Reward trade
LET'S TRADE!! Forex Major Pairs Using Ichimoku - GBPUSD 4HPrevious level along with Senkou Span flatting out providing support.


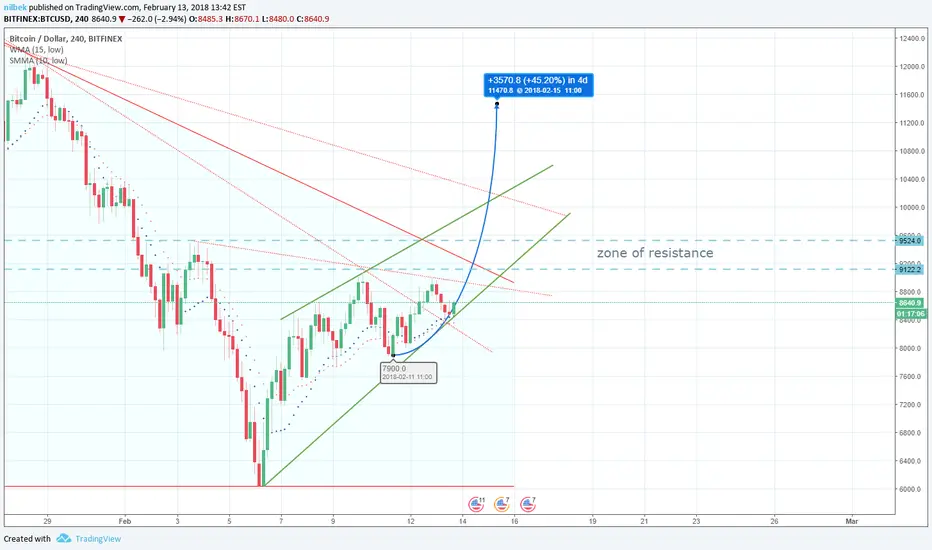
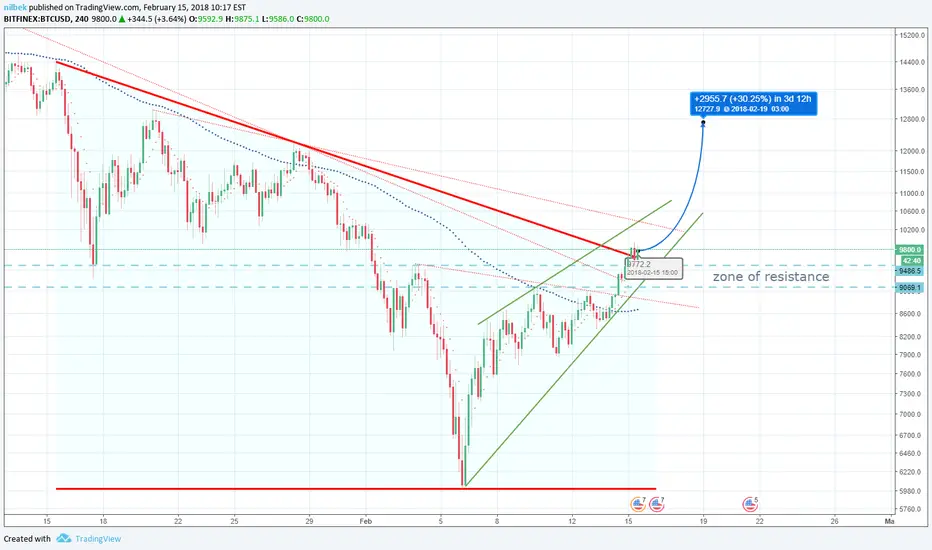
Bitcoin will continue to rise!Another possible 20% profit in 4 days...
My last analysis about BTCUSD maintain its reliability. Just a promising update.
Trend analysis and indicators are shown in the graph.

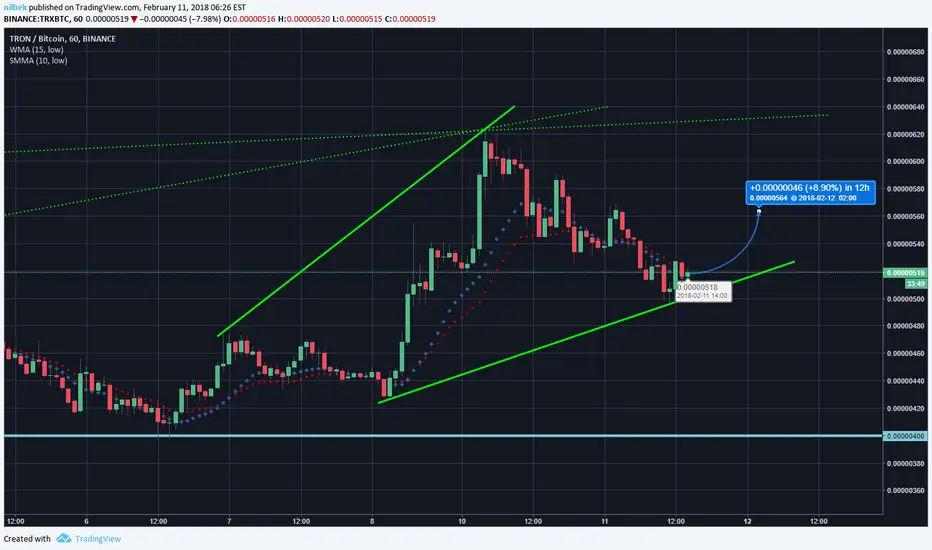
Bitcoin is ready to rise!My last analysis about BTCUSD maintain its reliability. Just a promising update.
Trend analysis and indicators are shown in the graph.