90$ Litecoin incomingevery detail and reason is on the chart:
We saw a correction happen till $58, then from the change in drection, accumulation has been happening.
We saw a bullish flag or abc flat correction around price 68 and 60 dollars happen, then from there had a bullish impulse to $75, off which we have been in a correction since.
The correction is complete with WXY as seen on the chart, now we are entering the Impulse cycle as seen with abc micro cycle completing and allowing for buy orders on the current price.
So from here Im expecting litecoin prices to skyrocket or moon for the moon-boiz.
buckle up this is gonna be a long ride..
Longposition

COMPUSDT Long setupBINANCE:COMPUSDT appears to be in bullish structure here. Deviation and confluence of the down trend I expect it to break the trend very soon and my First Target would be the black line above after that if the resistance is crossed I will long again for a swing trade or a day trade.

REAL - Why I love this (super cheap) company. LOADING UPI will forever be a holder of my REAL stock. It's the largest position in my personal investment account with a basis in the very low $1 range from early 2023.
You can see why as we have positive earnings reports quarter after quarter and it's only a matter of time until Wall Street starts to notice.
There is a huge short float position on this so I'm just happy to see that our selling has been in a controlled manner and I'm excited for the future of it!
See you all at market open!
Happy Trading :)

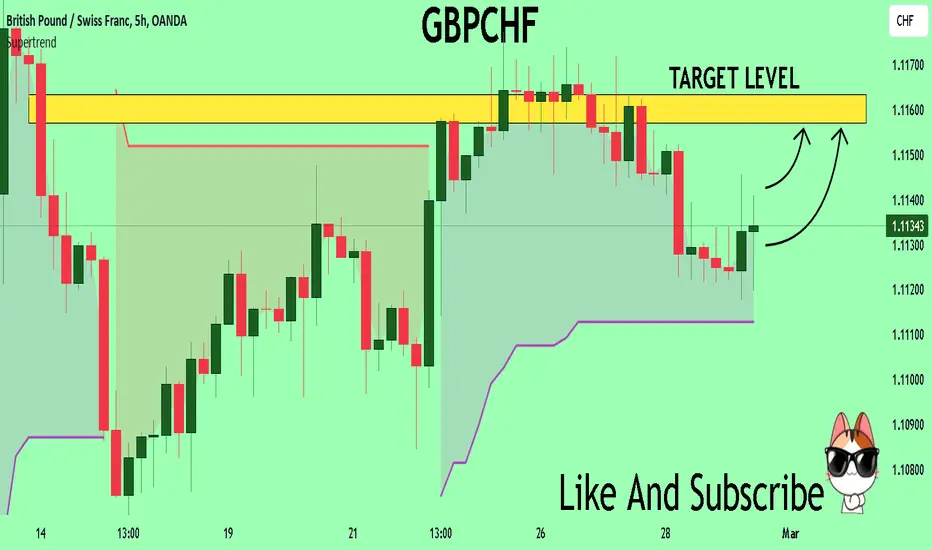
GBPCHF The Target Is UP! BUY!
My dear friends,
GBPCHF looks like it will make a good move, and here are the details:
The market is trading on 1.1134 pivot level.
Bias - Bullish
Technical Indicators: Supper Trend generates a clear long signal while Pivot Point HL is currently determining the overall Bullish trend of the market.
Goal - 1.1157
About Used Indicators:
Pivot points are a great way to identify areas of support and resistance, but they work best when combined with other kinds of technical analysis
———————————
WISH YOU ALL LUCK
GDP, the highlight for gold price growth or not ?⭐️ Smart investment, Strong finance
⭐️ GOLDEN INFORMATION:
The price of gold is experiencing modest gains but remains stuck within a narrow range during Tuesday's mid-North American session. This is supported by the decrease in US Treasury bond yields, which in turn weakens the US Dollar Index (DXY) by 0.05%. Currently, XAU/USD is trading at $2,034.88, showing a gain of 0.18%.
Gold is hovering around the 50-day Simple Moving Average (SMA) at $2,033.48 as investors prepare for the release of the latest Personal Consumption Expenditures (PCE) report. This report serves as the Federal Reserve's (Fed) measure of inflation. Along with the most recent Gross Domestic Product (GDP) data, these factors could potentially trigger a breakout in the price of gold from its current trading range of $2,020 to $2,050.
⭐️ Personal comments NOVA:
Gold price is still in an Uptrend, today's GDP news could help Gold reach $2050
⭐️ SET UP GOLD PRICE:
🔥BUY GOLD zone: $2020 - $2022 SL $2015 maybe scalping $2025-$2027
TP1: $2030
TP2: $2038
TP3: $2050
🔥SELL GOLD zone: $2048 - $2050 SL $2055 maybe scalping $2042-$2044
TP1: $2040
TP2: $2035
TP3: $2030
⭐️ Technical analysis:
Based on technical indicators EMA 34, EMA89 and support resistance areas to set up a reasonable BUY order.
⭐️ NOTE:
Note: Nova wishes traders to manage their capital well
- take the number of lots that match your capital
- Takeprofit equal to 4-6% of capital account
- Stoplose equal to 2-3% of capital account
- The winner is the one who sticks with the market the longest

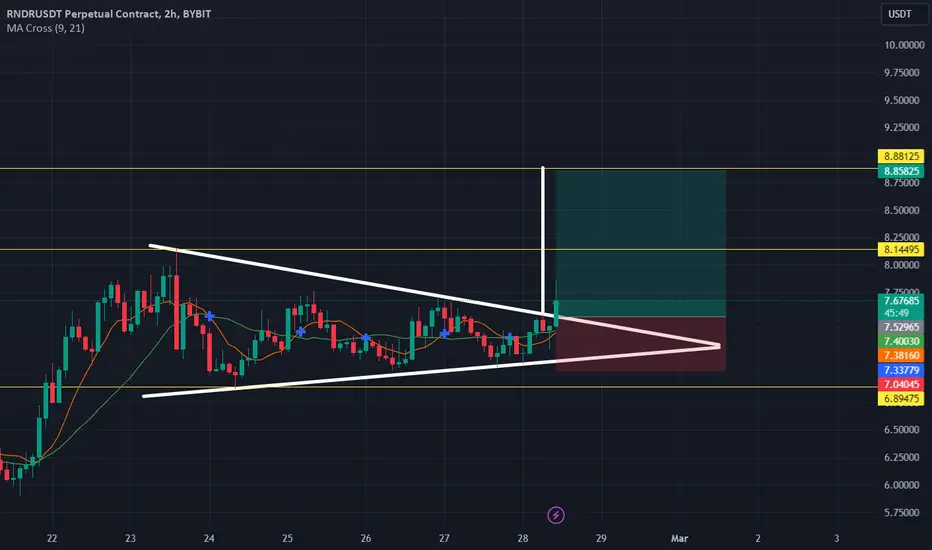
RNDRUSDT Render breaking outRender long, upside breakout of a triangle pattern in an uptrend, wait for the retest.
Look to take profits at;
8.1449
8.8582
Caution, BTC is at an pinnacle point, a correction will see alt have big moves down invalidating upside movement. Do not over leverage, use a stop loss!
EURAUD - 1H - Long Position - Support & ResistanceIn this chart we mark support & resistance grid lines, which help us to decide entry & exit point of the trade.

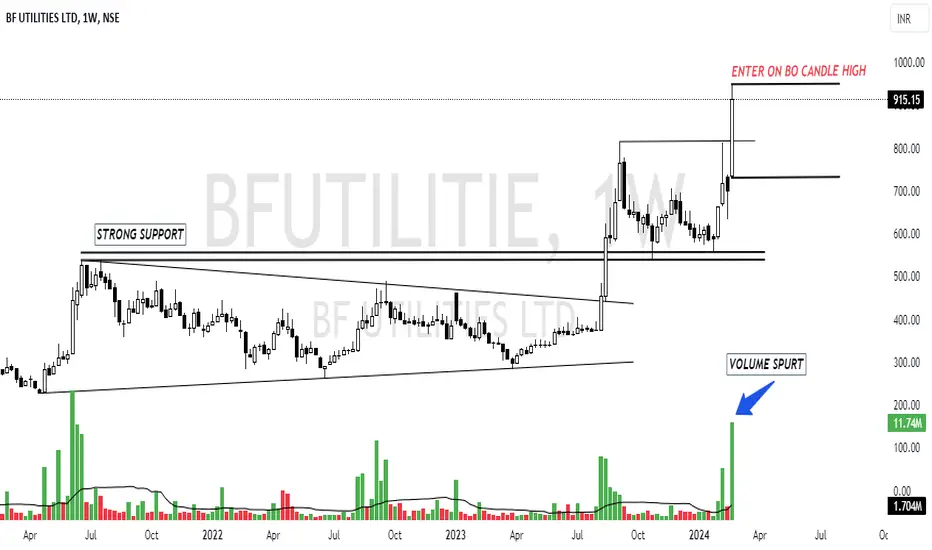
SWING BREAKOUT STOCKNSE:BFUTILITIE
All information on this page is for educational purposes only,
we are not SEBI Registered, Please consult a SEBI registered financial advisor for your financial matters before investing And taking any decision. We are not responsible for any profit/loss you made.
STGUSDT Breaking out and retesting STGUSDT breaking out of an triangle, resetting and looking for continuation.
Look to take profit at;
0.6856
0.7131
Caution, traders should watch for a volume spike and at least two closes beyond the trendline to confirm the break is valid and not a fake out.

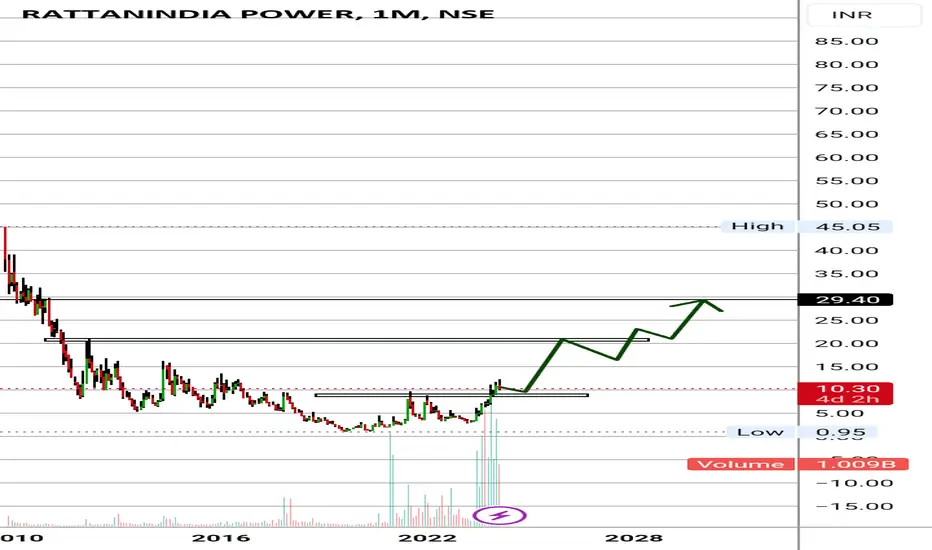
Rattan power for short and long term.👉Short term target 20✅
👉Long term target 29✅
Confirmation 👇
High breakout volume ✅
@ kindly consider your financial advisor before taking any position, I am not SEBI registered.
Make money with EUR/HUFThe HUF continues to weaken, we will almost certainly not stop until the 400 level.

Navigating the Chip Maze: Should You Invest in Synopsys?Navigating the Chip Maze: Should You Invest in Synopsys?
Synopsys, a titan in the Electronic Design Automation (EDA) landscape, offers intriguing prospects for investors curious about the semiconductor industry. But before diving in, let's unpack the company, analyze its potential, and explore options – with a strong disclaimer: trading is inherently risky and not suitable for everyone.
Synopsys: Powering the Chip Revolution
Founded in 1986, Synopsys has carved a niche by providing essential tools and services for chip design and verification. Imagine them as the architects and inspectors of the tiny brains powering our devices. Their clients? Tech giants like Apple, Intel, and Samsung, relying on Synopsys for efficient, secure chip development.
Products and Services:
EDA Tools: The bread and butter – software enabling chip design, simulation, and verification.
Silicon IP: Pre-designed building blocks, saving chipmakers time and money.
Software Security and Quality: Tools to identify and fix vulnerabilities in software, crucial in an increasingly interconnected world.
Financials and Performance:
Revenue: $5.3 billion (FY 2023)
Net Income: $1.2 billion (FY 2023)
Ratings: Leader in Gartner's Magic Quadrant for EDA, "100 Best Companies to Work For" by Fortune
So, Buy, Sell, or Hold?
This is where things get tricky. Analysing publicly available information can't guarantee future performance. Several factors could influence Synopsys' stock price:
Overall Semiconductor Market: A booming market benefits Synopsys, but downturns can impact sales.
Technological Advancements: Staying ahead of the curve in EDA is crucial, and continuous innovation is key.
Competition: Other EDA players like Cadence Design Systems pose constant competition.
Options Trading: A Calculated Gamble?
Remember, options involve significant risks. Buying call options bets on a stock price increase, while put options profit from a decrease. With expirations ranging from 1-12 months, you choose your timeframe and risk tolerance. However, options decay in value over time, and misjudgment can lead to substantial losses.
The Verdict: Do Your Research, Proceed with Caution
Synopsys is a prominent player in a growing industry, but the decision to invest ultimately rests on your individual financial goals and risk appetite. Conduct thorough research, understand the risks involved, and never invest more than you can afford to lose. Consider seeking professional financial advice before making any investment decisions.
Risk Warning
Trading stocks and options is a risky activity and can result in losses. You should only trade if you understand the risks involved and are comfortable with the potential for losses.
Risk Warning: Trading is Not for Everyone
It's essential to emphasize that trading stocks and options carries inherent risks. Market volatility, unpredictable events, and human error can lead to significant losses. Therefore, it's crucial to undertake thorough research, understand the underlying risks, and only invest funds that can be comfortably afforded to lose.
------------------------------------
Rating: STRONG BUY
Risk Disclaimer!
The article information and the data is for general information use only, not advice!
---------------------------------------------------------------------
Risk Warning Trading stocks and options is a risky activity and can result in losses. You should only trade if you understand the risks involved and are comfortable with the potential for losses. Risk Disclaimer! General Risk Warning: Trading on the Financial Markets, Stock Exchange and all its asset derivatives is highly speculative and may not be suitable for all investors. Only invest with money you can afford to lose and ensure that you fully understand the risks involved. It is important that you understand how Trading and Investing on the stock exchange works and that you consider whether you can afford the high risk of loss!

Bullish Pin Bar1. Here is the bullish Pin Bar formation at the pullback and touches support level and continue the trend.
2. If the price touches the 50% of the previous Pin Bar then we can enter the long position at that point somewhere it touches.

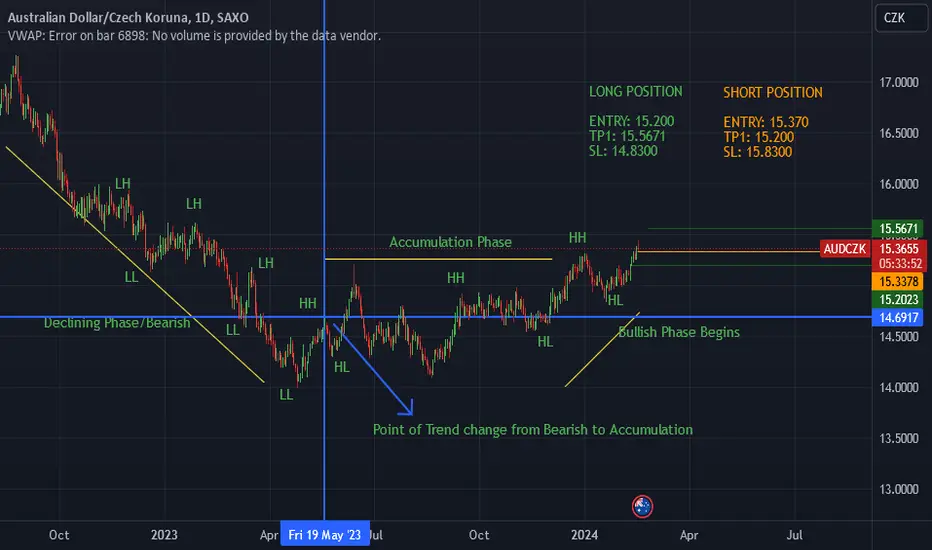
AUDCZK - 1D - LONG ENTRY & SHORT ENTRY - DOW THEORYIn this Pair we see a visible Trends in DAILY time frame, in which you can see a Declining Phase, Accumulation phase and then currently in Bullish trend.
THE DEFINITION OF DOW THEORY IS WINNING.
So currently we plan a small SHORT ENTRY of around 170-200 pips
as the Short TP hits we take a LONG Entry from there for 200 pips more.
HAPPY TRADING.
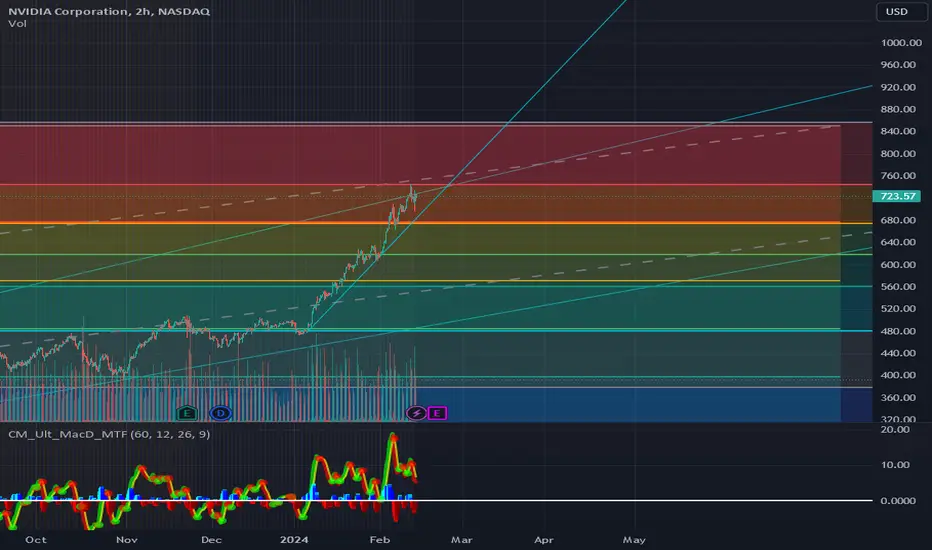
NVidia - Will it continue to run past $750?$750 is the level to watch for NVidia
Current trajectory should take it there by next week's friday.
If it drops down to 700, it's very liable to drop more.
Given their current news about local AI and the AI war against that's opening up against them for $7 Trillion, I'd personally expect to see share value to continue to climb to $850 by mid March
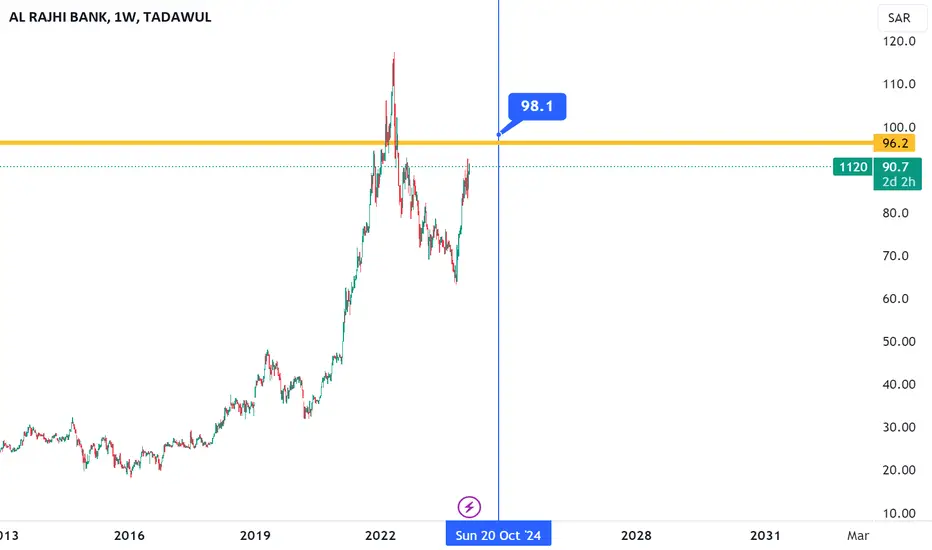
EL RAJHI BANKestimated time and price of EL RAJHI BANK
WE THINK THAT 98 is the estimated price of the 3rd week in October 2024
DYDX - Ascending Channel PumpDYDX, observed on the weekly timeframe, is currently trading within an ascending channel. The price action reflects a consistent pattern of liquidity absorption, oscillating between the upper and lower bounds of the channel. This liquidity-driven movement suggests a recurring behavior of price navigating from one liquidity level to another. The anticipation is a potential retest of the lower channel boundary, particularly around the $1.9 level, before a breakout above the upper channel boundary.
🔄 Ascending Channel and Liquidity Movement:
DYDX's price movement is structured within an ascending channel, highlighting a series of higher highs and higher lows. The intriguing aspect is the consistent absorption of liquidity, indicating a cyclical movement from one liquidity level to another.
📊 Liquidity Retest and Breakout Scenario:
The analysis suggests a potential scenario where DYDX may undergo a retest of the lower channel boundary, particularly around the $1.9 level. Such a retest could serve as a liquidity absorption phase before a potential breakout above the upper channel boundary.
🚀 Key Levels to Watch:
Upper Channel Boundary: The upper channel boundary serves as a key level for a potential breakout. A decisive move above this level could signal a bullish continuation.
$1.9 Support Level: The $1.9 level is identified as the potential retest point for the lower channel boundary. Traders should monitor price action around this level for confirmation.
💡 Trading Strategy:
Traders observing DYDX may consider a strategic approach involving the potential retest of the lower channel boundary around $1.9. Confirmation of support at this level, followed by a breakout above the upper channel boundary, could present favorable conditions for bullish positions. Risk management strategies, including the use of stop-loss orders, are essential.
🔮 Future Outlook:
The technical analysis indicates the possibility of DYDX retesting the lower channel boundary around $1.9 before a potential breakout above the upper channel boundary. Traders should remain attentive to key levels and adapt their strategies based on real-time market dynamics. The cryptocurrency market's dynamic nature emphasizes the importance of flexibility and risk management in trading decisions.

NEW SWING POSITIONI have opened another position (long) to add in my swing portfolios.
Purely relying on my strategy, I found an entry into this pair.
For how long will I hold this will depend what the market will give me.
May all the odds agrees to every trader!
Newbie trader here....
CADJPY!! 12/2/2024 BUY signal support zone⭐️ Smart investment, Strong finance
⭐️ Personal comments NOVA:
CAD JPY is in a nice rising trendline, trading stably on the EMA lines, touching the nearest support zone, setting up a BUY signal.
⭐️ SET UP CADJPY PRICE:
🔥BUY zone: 110.450 - 110.300 SL 109.800
TP1: 110.700
TP2: 111.000
TP3: 111.300
⭐️ Technical analysis:
Based on technical indicators EMA 34, EMA89 and support resistance areas to set up a reasonable BUY order.
⭐️ NOTE:
Note: Nova wishes traders to manage their capital well
- take the number of lots that match your capital
- Takeprofit equal to 4-6% of capital account
- Stoplose equal to 2-3% of capital account
- The winner is the one who sticks with the market the longest

Qrdo analysis Qredo usdt analysis
Time frame weekly
Patern , 2 bottom
Risk rewards ratio >4
First target 0.84

EURCAD/LONGThis video was just a quick technical analysis of eurcad basically breaking down market structure and the behavior of the market. in the video i show you guys how you can make a thesis or gather information from a simple pattern. mainly if you see a pattern you can draw your support and resistance levels at the top or bottom of these patterns and look to your left and gather information on WHY market made pattern at a certin level.
EURCAD/LONG

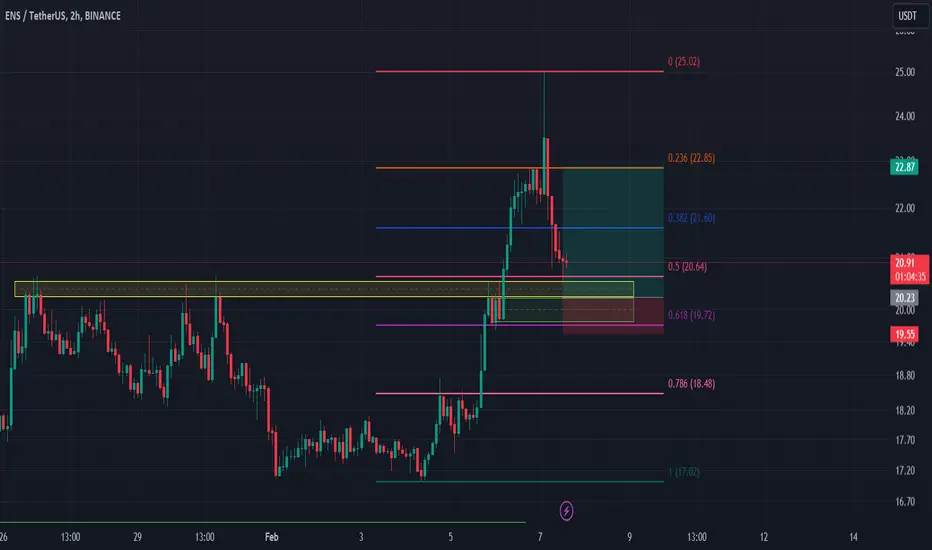
ENS USDT long positionObserving the current market dynamics, it is evident that the price has recently breached a significant resistance area. Presently, it is in the process of completing a pullback to that same area. Notably, there is a robust order block situated within this region, emphasizing its strategic importance. Furthermore, the 0.5 Fibonacci retracement level coincides with this area, adding another layer of significance. Considering these factors, my expectation is for a potential increase in price.
please follow and support for more analyses
IBULHSGFIN is ready for BULL RUN IBULHSGFIN is bad in fundamental but ready for reversal
1- Rounding bottom reversal
2- trend line breakout
3- fab. .5 point will came
4- triangle also seen in this chart
buy above 188
TRG 1st - 240
2nd -280
3rd- 340
SL 152
