Bulls pressure, gold price grows 3409⭐️GOLDEN INFORMATION:
Gold prices rallied sharply on Monday, reaching their highest level in over four weeks, as geopolitical risks escalated over the Russia-Ukraine conflict. Renewed tensions on trade between the United States (US) and China prompted investors to buy the yellow metal throughout the day. At the time of writing, XAU/USD trades at $3,377, up by 2.70%.
Market sentiment shifted sour as news broke that Ukraine staged an aerial attack on Russia, which destroyed long-range bombers and other aircraft. Meanwhile, US President Donald Trump doubled down on tariffs over steel and aluminum imports to 50%, effective June 4, and rhetoric against China sent US global equities lower.
CNBC reported that Trump and China’s President Xi Jinping could speak this week, but not on Monday.
⭐️Personal comments NOVA:
Gold prices maintained their upward momentum at the beginning of the week, tariff tensions and the war with Russia remain unpredictable. Gold prices supported to return to the 3400 zone.
⭐️SET UP GOLD PRICE:
🔥SELL GOLD zone : 3409- 3411 SL 3416
TP1: $3400
TP2: $3388
TP3: $3372
🔥BUY GOLD zone: $3313- $3315 SL $3308
TP1: $3327
TP2: $3340
TP3: $3355
⭐️Technical analysis:
Based on technical indicators EMA 34, EMA89 and support resistance areas to set up a reasonable BUY order.
⭐️NOTE:
Note: Nova wishes traders to manage their capital well
- take the number of lots that match your capital
- Takeprofit equal to 4-6% of capital account
- Stoplose equal to 2-3% of capital account
Longposition

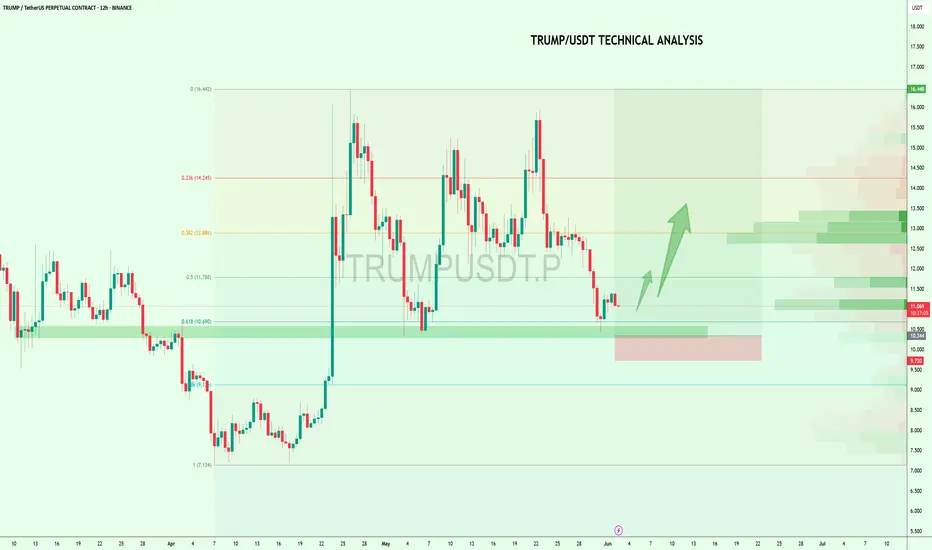
$TRUMP Bounces from Golden Pocket – Rally Incoming?$TRUMP has bounced from a strong support zone around $10.30–$10.50, which lines up with the 0.618 Fib level.
As long as this support holds, price could push toward $11.78 and possibly higher to $13.00+ if momentum builds.
The structure looks healthy, and buyers are stepping in again.
Keep watching, a move toward the upper levels may be starting! 👀
#Trump #ALTSEASON
JSL ,1DPattern is looking very very good , enter into trade after upper trendline is fully broken with Good Volume with strong candle .
this Metal Sector is Looking Great and Performing very well
Take Risk According to your Capital
Follow for more Swing Ideas Like this .

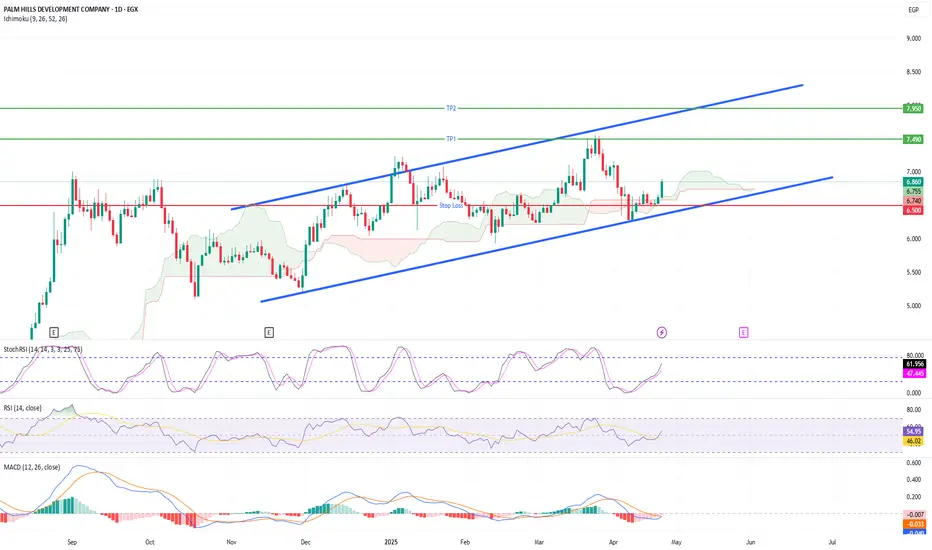
PHDC Loading for a Massive Breakout – Hidden Bull Flag Inside!Palm Hills (PHDC) is gearing up for a powerful move! 📈
After months of respecting a clean ascending channel, price just bounced perfectly off lower support.
📊 Indicators flashing green:
StochRSI bullish cross ✅
MACD turning positive ✅
Squeeze Momentum showing early pressure build-up ✅
I’m buying between 6.70–6.85 EGP with a tight stop at 6.50 EGP.
🎯 Targets:
TP1: 7.50 EGP
TP2: 8.00–8.20 EGP
A clean breakout above 7.00 EGP could trigger explosive upside. Watch closely! 🚀
(DYOR – Not financial advice)
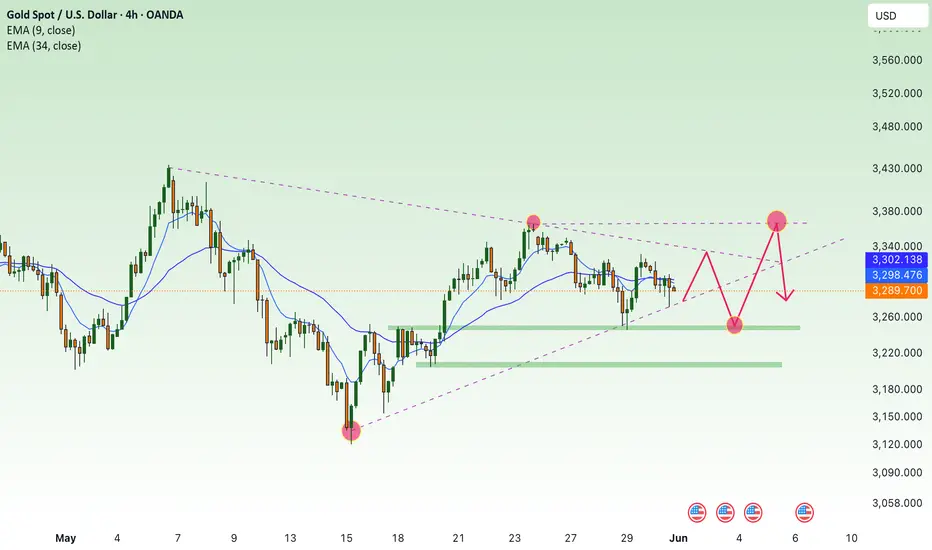
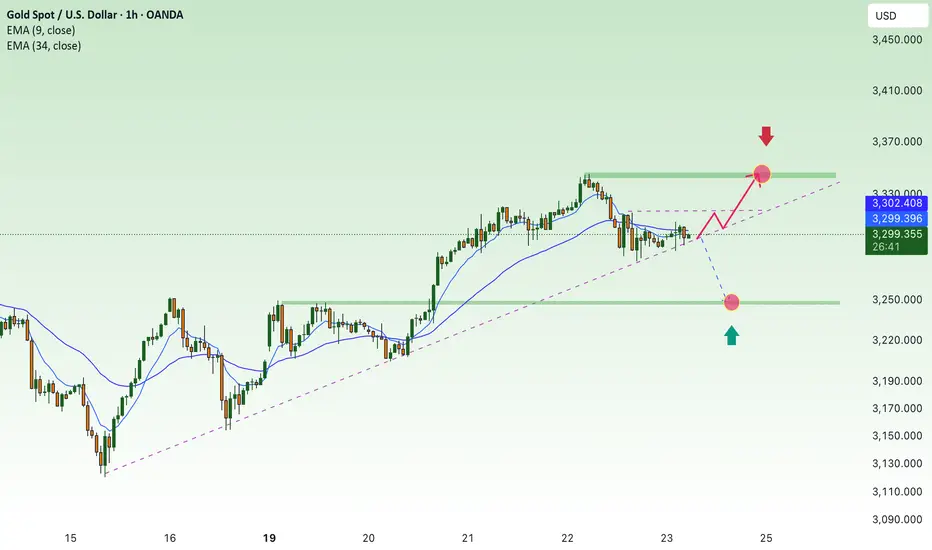
Continue to maintain stability above 3300, next week✍️ NOVA hello everyone, Let's comment on gold price next week from 06/02/2025 - 06/06/2025
🔥 World situation:
Gold prices declined on Friday, pressured by a rebound in the US Dollar, even as US Treasury yields dipped in response to a robust inflation report. Despite the yield pullback, expectations remain firm that the Federal Reserve could begin easing policy in 2025. At the time of writing, XAU/USD is down 0.83%, trading around $3,289.
Market sentiment turned more risk-averse after US President Donald Trump sharply criticized China, accusing Beijing of breaching the trade agreement reached during talks in Switzerland. In a post, Trump wrote, “China, perhaps not surprisingly to some, HAS TOTALLY VIOLATED ITS AGREEMENT WITH US. So much for being Mr. NICE GUY!”—a statement that reignited geopolitical tensions and added to market uncertainty.
🔥 Identify:
Gold price is in great competition between buyers and sellers around the price range of 3200 - 3300. Tariff policies are coming back, the trump administration is putting pressure to get favorable tariffs.
🔥 Technically:
Based on the resistance and support areas of the gold price according to the H4 frame, NOVA identifies the important key areas as follows:
Resistance: $3332, $3365
Support: $3244, $3204
🔥 NOTE:
Note: Nova wishes traders to manage their capital well
- take the number of lots that match your capital
- Takeprofit equal to 4-6% of capital account
- Stoplose equal to 2-3% of capital account
- The winner is the one who sticks with the market the longest
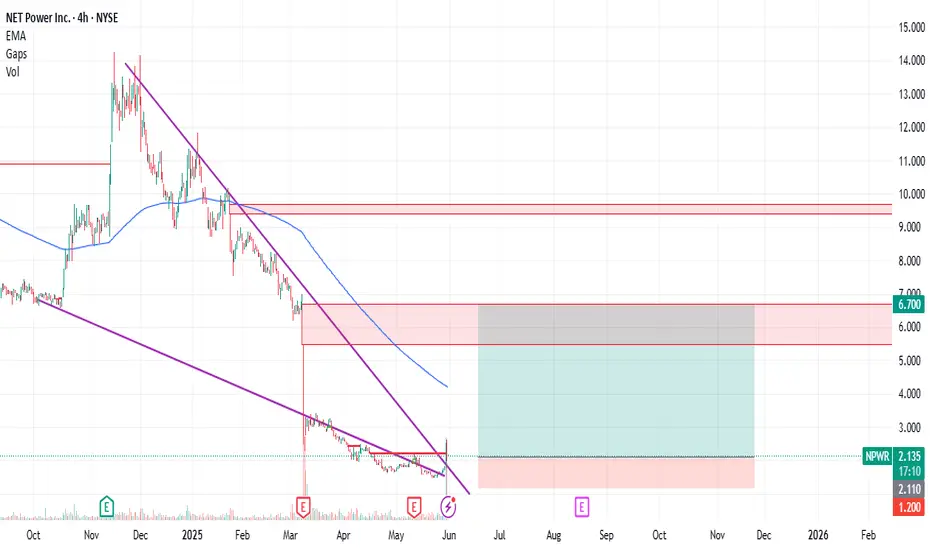
NPWR : Small Position Size Play with 5.00 Risk-Reward RatioNet Power Inc. NPWR stock has seen high volume and a tendency to break the falling wedge. Can this initiative close the gap that ended at 6.7 ?
This traded can be tried with very small position size.
Because Stop-Loss and Target are very wide.
Risk-Reward Ratio : 5.00
Stop-Loss : 1.20
Target: 6.70
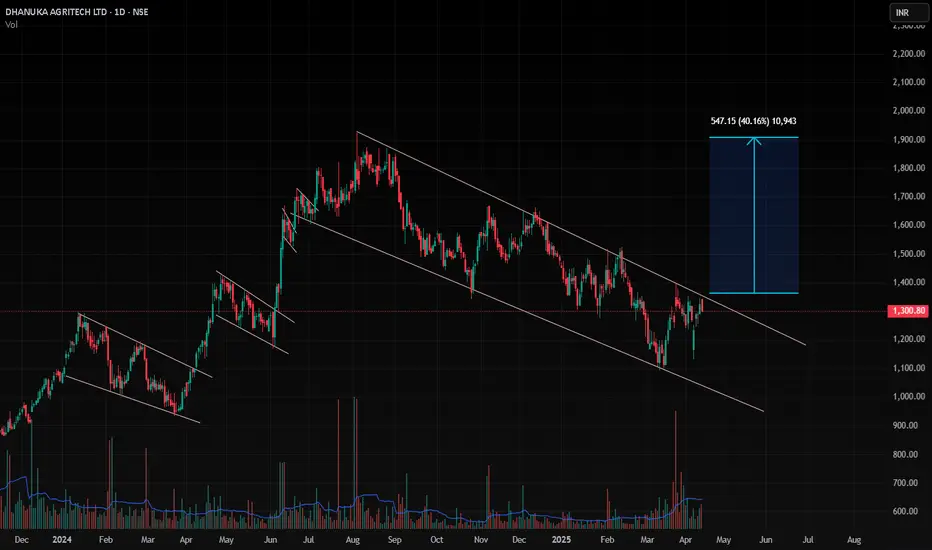
Dhanuka ,1DPattern Is looking very good for Breakout , Nifty is also Supporting also all the stocks for Bullish Breakouts , This Is best time to enter in breakout stocks .
Consider Only those stocks that seems Technically strong with Good Volume Breakouts and Strong close .
Risk According to your capacity and aim for 40% and Risk upto 4-5% for this trade , Mainly you have to give the Room to Fluctuate the Stock , according to this flucations you have to decide your Stop loss .
Take Only A+ Setups , so that your Accuracy Should Be High and Returns also High
Follow for more Swing Ideas Like this
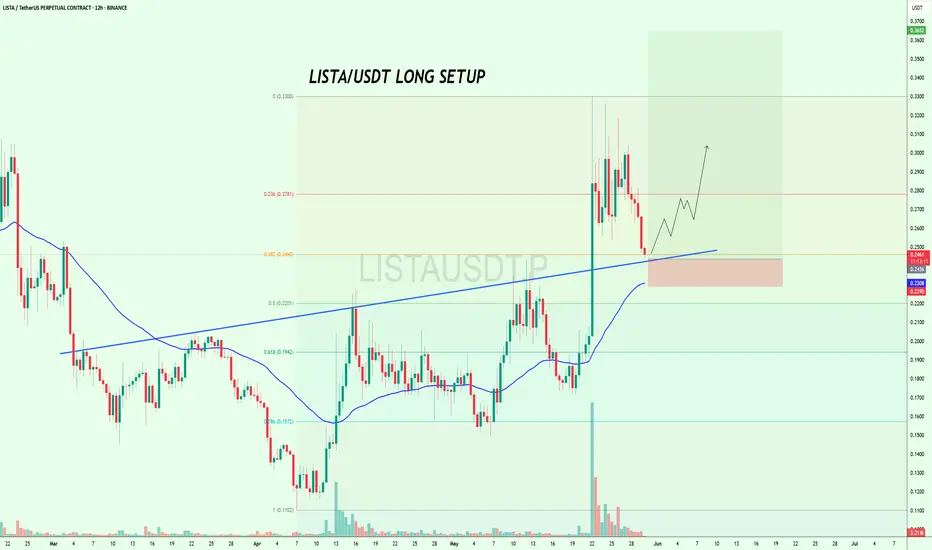
$LISTA at Key Support – Long Opportunity Loading?$LISTA looks good to long here with a short SL🚀
It is approaching a key confluence support zone right at the 0.382 Fib level (~0.2460), the rising trendline, and the 100EMA on the 12H chart.
This level held well in the last move and could once again act as the launchpad for a bullish breakout toward $0.30–$0.33.
But if it breaks below this support zone, short-term momentum could shift.
Watch how the price reacts here👀
BINANCE:LISTAUSDT
WLD (Worldcoin) – Long Spot Trade Setup After 180% RallyAfter a massive 180% surge, WLD is showing signs of exhaustion and is likely to retrace toward the next major support zone. A pullback into the $1.22 – $1.35 area provides a favorable entry opportunity for continuation of the trend, assuming support holds.
🔹 Entry Zone (Support):
$1.22 – $1.35
🎯 Take Profit Targets:
🥇 $1.65 – $1.85 (prior consolidation and resistance zone)
🥈 $2.40 – $2.65 (upper range resistance / extension target)
🛑 Stop Loss:
Just below $1.10 (below structural support and invalidation level)


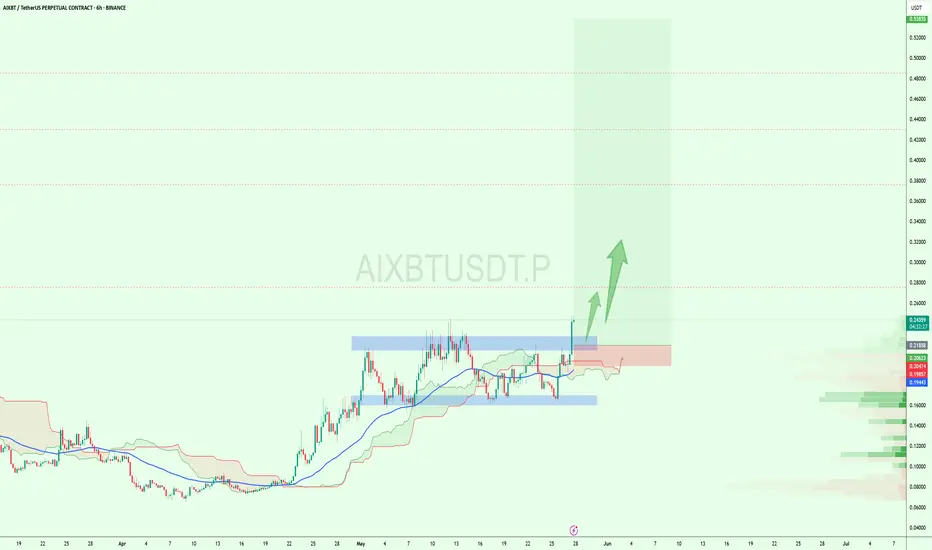
$AXIBT Breakout Confirmed – 2x Potential Ahead?$AXIBT just broke above a key accumulation zone after days of consolidation.🚀
Strong volume, bullish Ichimoku support, and a clean breakout above resistance suggest this could be the start of a major move.
If this rally continues, we could see a sharp push toward the $0.50+ zone, nearly 2x from here.
Reclaiming and holding above the $0.22–$0.24 zone is crucial for confirmation.
Eyes on this one.
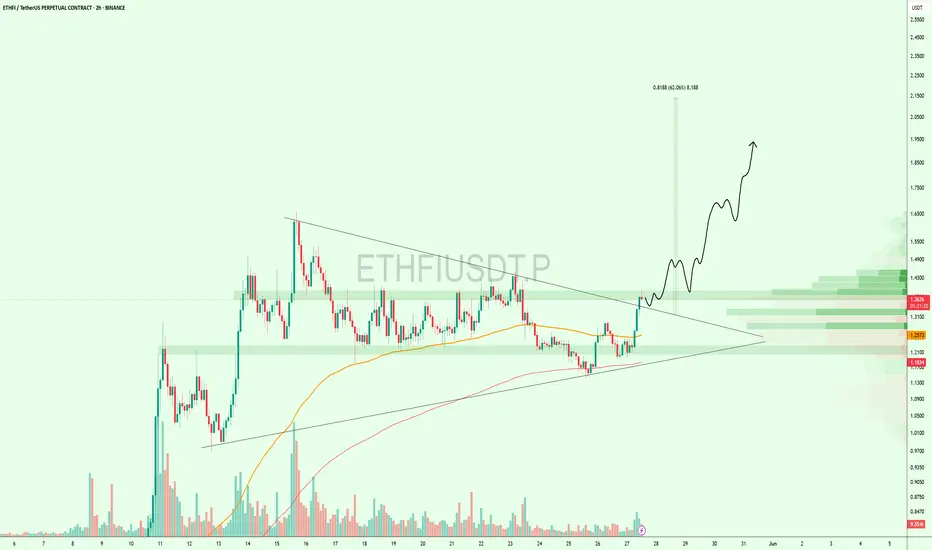
Symmetrical Triangle Breaks – $ETHFI Targets $2+CRYPTOCAP:ETHFI just broke out of a strong symmetrical triangle on the 2H chart finally escaping a long consolidation phase.
Price surged above resistance and reclaimed key EMAs, showing clear bullish momentum. If this breakout sustains, the next leg could take us toward $2.00+
Risk is tight below $1.27 the breakout zone and previous resistance-turned-support.
This move could be the start of something big.
Watch closely!
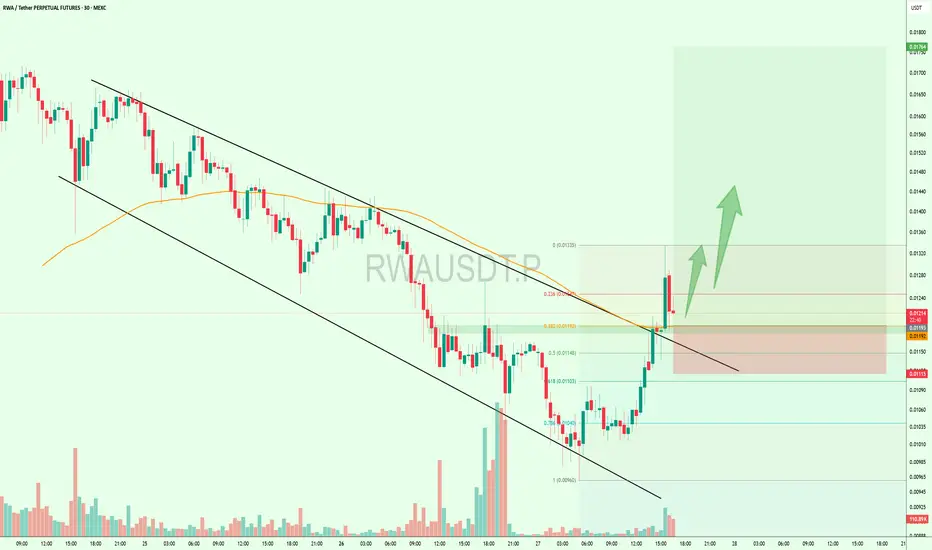
$RWA Breakout Alert – Trend Reversal in Play?LSE:RWA just broke out of a falling channel with strong volume — signaling a potential trend reversal.
It’s now retesting the breakout zone near the 0.382–0.5 Fib level, which could act as a support area before the next leg up.
If this reclaim holds, upside targets extend toward $0.017+—a 40%+ move from here.
Keep it on your radar.
DYOR, NFA.
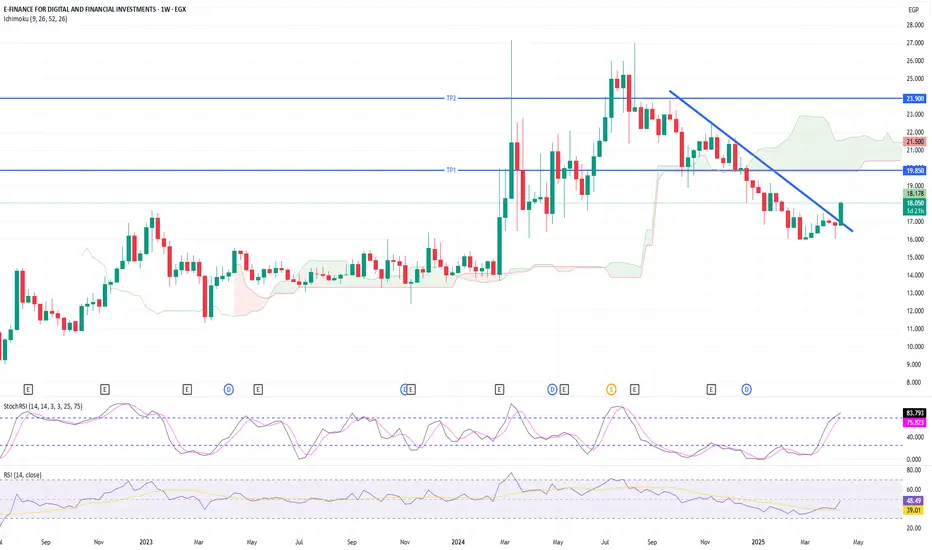
E-Finance Breakout: Trendline Breach Signals Fresh Upside PotentE-Finance (EGX) has just broken out of a descending trendline on the weekly chart, supported by momentum indicators turning bullish. The Ichimoku cloud shows that the price is attempting to re-enter bullish territory. With the MACD turning positive and the Squeeze Momentum shifting green, this breakout may be the start of a medium-term rally.
📌 Trade Plan
📥 Entry Zone: Between 17.50 – 18.25 EGP (current price or on a slight dip)
🎯 Take Profit Targets:
TP1: 19.85 EGP (upper Ichimoku cloud resistance)
TP2: 24.00 EGP (previous support-turned-resistance zone)
🛑 Stop Loss: Below 16.50 EGP (under recent swing low & trendline)
⏱️ Time Horizon: Medium-term (4–8 weeks)
$PENGU Approaching Apex – Breakout Watch On!CSECY:PENGU is forming a symmetrical triangle on the 4H chart, and price is getting close to the apex.
It’s currently holding above the support trendline and the 200 EMA a key zone to watch.
A breakout above the triangle could push the price toward the $0.022–$0.023 range.
I’m watching closely. If it breaks out with strong volume, it could be a solid setup.
Use a tight stop-loss and manage your risk properly.

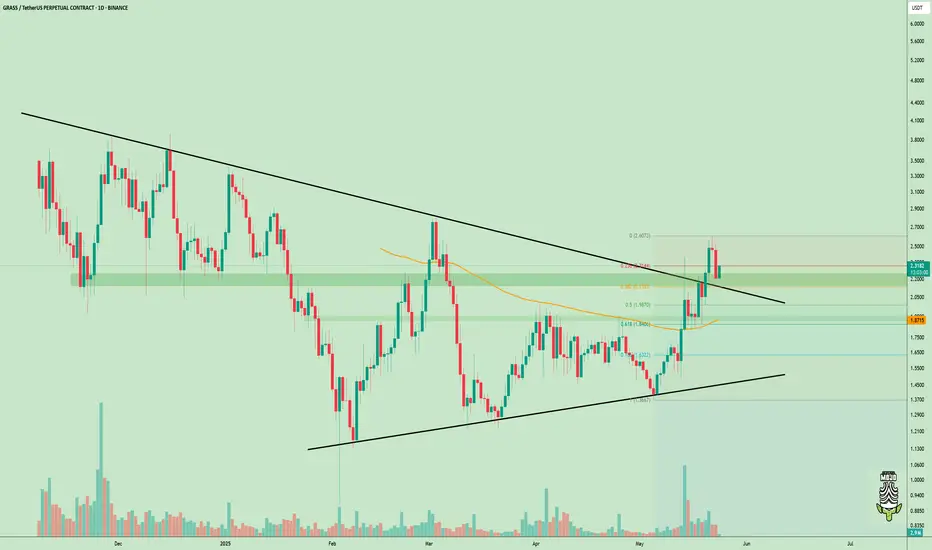
$GRASS just broke out of a long-term downtrend!$GRASS just broke out of a long-term downtrend!
#GRASS has broken out of a long-term symmetrical triangle and flipped the trend bullish.
Price is currently holding above the breakout zone and also respecting the 0.786 fib level from the recent range.
As long as it stays above the $2.13–$2.14 zone, the move toward $2.60+ looks likely.
This breakout could be the start of a bigger trend shift. Let’s see how it holds up in the coming days.
DYOR, NFA
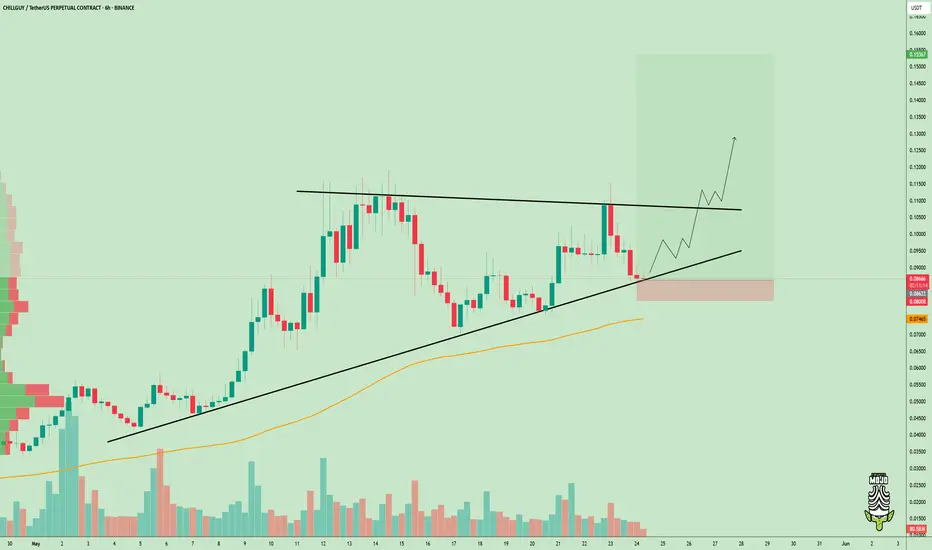
$CHILLGUY is holding strong!$CHILLGUY is holding strong!
Price is respecting the ascending trendline and gearing up for a breakout.
A move above that top resistance could open the gates to $0.13
Entry zone: $0.086–$0.088
Stop-loss: $0.080
Looks like a clean setup with a good risk-reward.
Just manage your risk properly and don’t chase.
DYOR, NFA
#chillguy #cryptocurrency
$PENGU is prepared for a bounce! CSECY:PENGU is prepared for a bounce!
Price is still moving inside the rising channel and just touched the lower support line.
As long as it stays above the $0.0128–$0.0132 zone, we could see a bounce toward the top of the channel near $0.018.
This setup offers a good risk-reward.
Entry: $0.0130
Stop-loss: $0.0119
DYOR, NFA
#cryptocurrencies

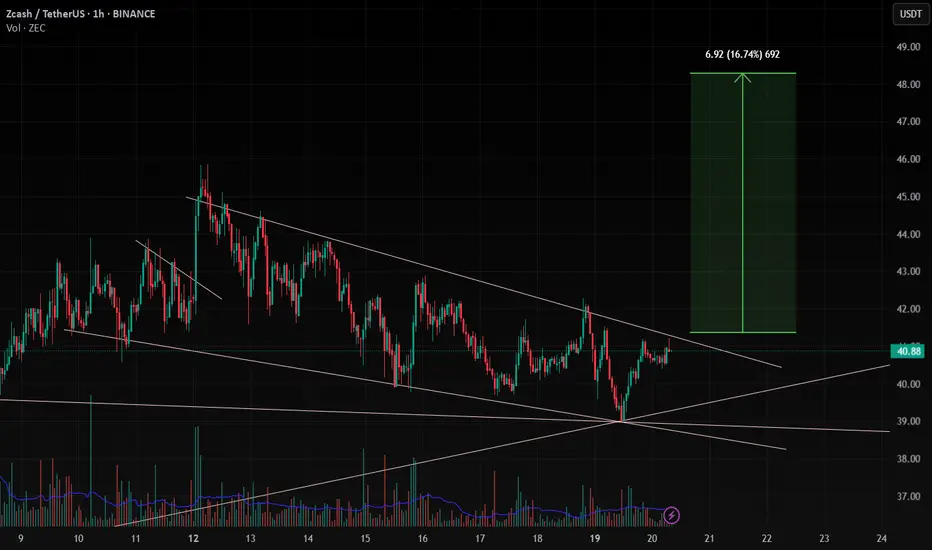
ZECUSDT , 1HrPattern is looking Good , If BTC is Sustaining Above 1,06,834 this level then , This ZEC pattern will Give a Good Breakout ,
Enter only When Upper Trendline is Breakout
Take Your Own Risk According to your Capital .
Follow for More Ideas Like This
Moving in the uptrend, bulls dominate⭐️GOLDEN INFORMATION:
Gold prices slipped by approximately 0.48% on Thursday, retreating from a two-week peak of $3,345 and falling below the key $3,300 level. The decline was driven by renewed strength in the US Dollar, even as Treasury yields pulled back from their intraday highs. The pressure on the yellow metal intensified after the US House of Representatives passed President Trump’s budget proposal, which now heads to the Senate for final approval. At the time of writing, XAU/USD is trading at $3,289, marking a 0.83% daily loss.
While sentiment in the broader market has seen a modest rebound, it remains fragile following Moody’s recent downgrade of US sovereign debt. The fiscal package approved by the House is expected to raise the national debt ceiling by a staggering $4 trillion, amplifying concerns over long-term fiscal sustainability.
⭐️Personal comments NOVA:
Gold price is still moving in the H1 uptrend line, buying power is still quite strong.
⭐️SET UP GOLD PRICE:
🔥SELL GOLD zone : 3344- 3346 SL 3351
TP1: $3335
TP2: $3322
TP3: $3307
🔥BUY GOLD zone: $3248- $3246 SL $3241
TP1: $3258
TP2: $3270
TP3: $3280
⭐️Technical analysis:
Based on technical indicators EMA 34, EMA89 and support resistance areas to set up a reasonable BUY order.
⭐️NOTE:
Note: Nova wishes traders to manage their capital well
- take the number of lots that match your capital
- Takeprofit equal to 4-6% of capital account
- Stoplose equal to 2-3% of capital account
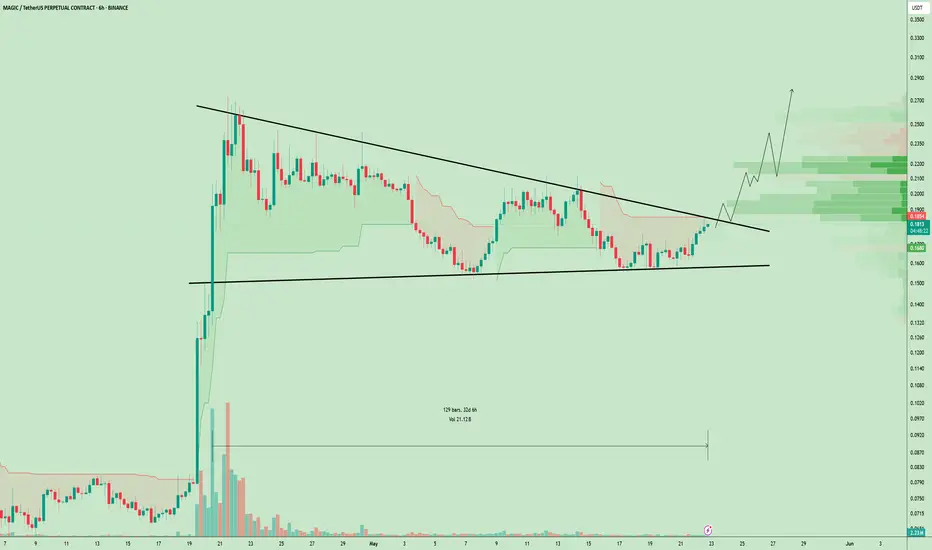
$MAGIC Loading Up for a Breakout After 32 Days of Silence!OMXTSE:MAGIC has been forming this symmetrical triangle pattern for over 32 days, that's more than a month of consolidation!
Price is squeezing tighter inside the range, and a breakout is getting closer.
If it breaks above the upper trendline with volume, we could see a move toward $0.22–$0.28 🚀
This setup is worth watching closely, long consolidation often leads to strong moves.
Retweet if you're bullish !!
#MAGIC #Alts
GALAUSDT📢 Crypto Signal – GALAUSDT 1-Hour TF
🖨️ Let the Chart Print Smart Money
Bullish divergence formed earlier, and price is now prepping a breakout. 📈 Buy Stop at 0.02078 catches the move with momentum confirmation.
🎯 Trade Setup
🛑 SL: 0.01904
🎯 TP1 (1:1): 0.02254
🎯 TP2 (1:2): 0.02426
📊 Bull Score: 2 vs 0
(✅ Bullish Divergence, ✅ Breakout Setup)
💰 Clear setup. Clean risk. Smart profits. 🟢📊🚀

BTC Long View by Mythic TraderBTC Long View by Mythic Trader. Let's take BTC again close to its ATH. Don't try to decode my trades because you can't. Sorry to say this but its Reality. People are still stucked in SMC and ICT. They don't even klnow that there are some more thing thats exists in the Market. And yes, now dont think that its EWT:)
