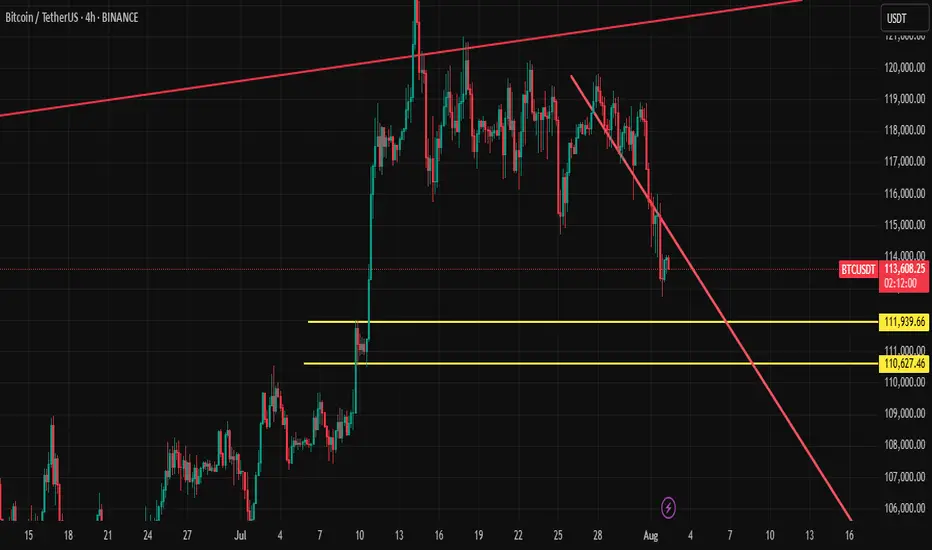
Bitcoin: New All-Time High — What’s Next?Bitcoin had an incredible run, breaking the old all-time high ($111,980) with strong bullish momentum and setting a fresh ATH at $123,218 (Binance). We just witnessed the first major corrective move of ~6% and a decent bounce so far — but the big question is:
What’s next? Will Bitcoin break higher over the summer or form a trading range here?
Let’s dive into the technicals.
🧩 Higher Timeframe Structure
May–June Range:
BTC was stuck between $110K–$100K, forming an ABC corrective pattern. Using trend-based Fib extension (TBFE) from A–B–C:
✅ C wave completed at $98,922 (1.0 TBFE)
✅ Upside target hit at $122,137 (-1 TBFE)
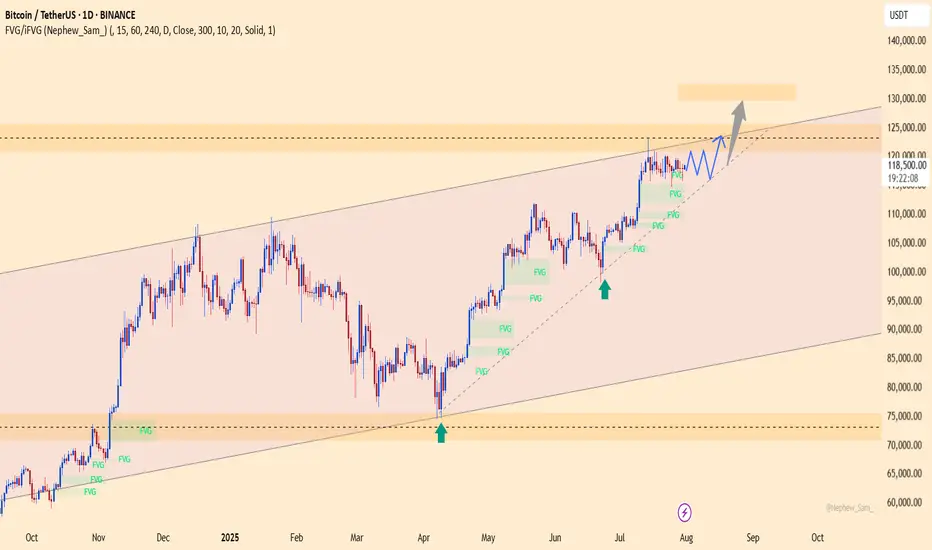
Full Bull Market TBFE:
➡️ 1.0 → $107,301 → previously rejected
➡️ 1.272 → $123,158 → recent rejection zone
Pitchfork (log scale):
➡️ Tapped the upper resistance edge before rejecting.
Previous Bear Market Fib Extension:
➡️ 2.0 extension at $122,524 hit.
2018–2022 Cycle TBFE:
➡️ 1.618 at $122,011 tapped.
Macro Fibonacci Channel:
➡️ Connecting 2018 low ($3,782), 2021 ATH ($69K), 2022 low ($15,476) →
1.618–1.666 resistance band: $121K–$123.5K.
✅ Conclusion: Multiple fib confluences mark the $122K–$123K zone as critical resistance.
Daily Timeframe
➡️ FVG / Imbalance:
Big daily Fair Value Gap between the prior ATH and $115,222 swing low.
BTC broke the prior ATH (pATH) without retest → a pullback to this zone is likely.
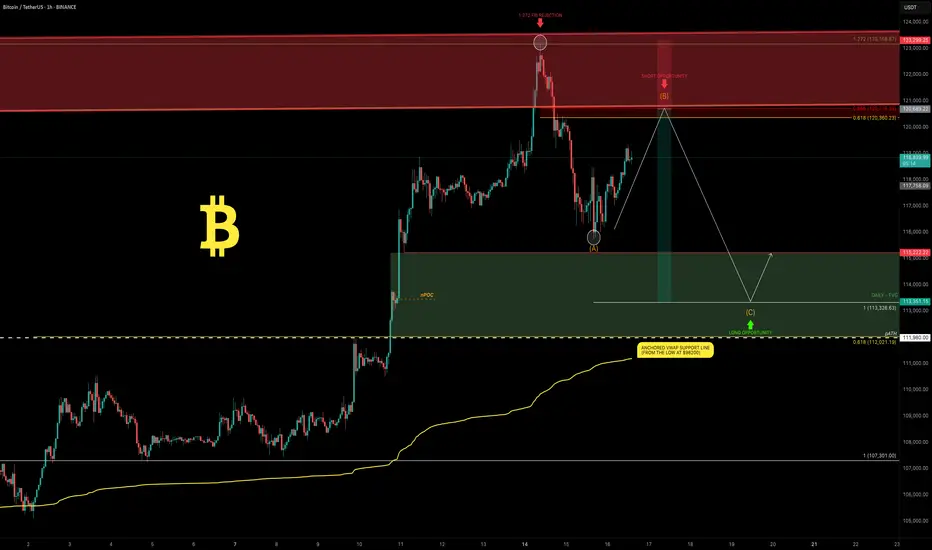
Lower Timeframe / Short-Term Outlook
We likely saw a completed 5-wave impulse up → now correcting.
The -6% move was probably wave A, current bounce = wave B, next leg = wave C.
➡ Wave B short zone: $120K–$121K
➡ Wave C target (1.0 TBFE projection): ~$113,326
➡ Confluence at mid-FVG + nPOC
Trade Setups
🔴 Short Setup:
Entry: $120,300–$121,000
Stop: Above current ATH (~$123,300)
Target: $113,500
R:R ≈ 1:2.3
🟢 Long Setup:
Entry: Between Prior ATH and $113,000
Stop: Below anchored VWAP (~$110,500)
Target: Higher, depending on bounce confirmation.
🧠 Educational Insight: Why Fibs Matter at Market Extremes
When markets push into new all-time highs, most classic support/resistance levels disappear — there’s simply no historical price action to lean on. That’s where Fibonacci extensions, channels, and projections become powerful tools.
Here’s why:
➡ Fibonacci extensions (like the 1.272, 1.618, 2.0) help estimate where trend exhaustion or profit-taking zones may appear. They are based on the psychology of crowd behavior, as traders anchor expectations to proportional moves from previous swings.
➡ Trend-Based Fib Extensions (TBFE) project potential reversal or continuation zones using not just price levels, but also the symmetry of prior wave moves.
➡ Fibonacci channels align trend angles across multiple market cycles, giving macro context — like how the 2018 low, 2021 ATH, and 2022 low project the current 1.618–1.666 resistance zone.
In short:
When you don’t have left-hand price history, you lean on right-hand geometry.
That’s why the $122K–123K zone wasn’t just random — it’s a convergence of multiple fib levels, cycle projections, and technical structures across timeframes.
⚡ Final Thoughts
Bitcoin faces major resistance around $122K–$123K backed by multiple fib and structural levels. A retest of the prior ATH zone (~$112K–$113K) looks probable before the next big directional move. Watch lower timeframe structure for signs of completion in this corrective phase.
_________________________________
💬 If you found this helpful, drop a like and comment!
Want breakdowns of other charts? Leave your requests below.
Longsetup
BTC defies expectations –Absorbs 9 billion USD, aiming for 130K?BTCUSDT maintains its bullish momentum despite Galaxy Digital offloading 80,000 BTC (worth ~9 billion USD). Price only saw a slight dip before bouncing back quickly, signaling strong demand and a more mature market sentiment.
Citi analysts point to ETF inflows and retail participation as the primary drivers of BTC’s rally, even as investors remain cautious ahead of the Fed’s rate decision.
On the daily chart, BTC continues to trade within an ascending channel, with the 116,200 zone acting as a potential buy area on any pullback. The next target is set at 129,500 USDT, aligning with the channel’s upper boundary and technical resistance.
Suggested strategy: Look to buy near 116,200–117,000. Target 129,500. Stop-loss below 115,000.
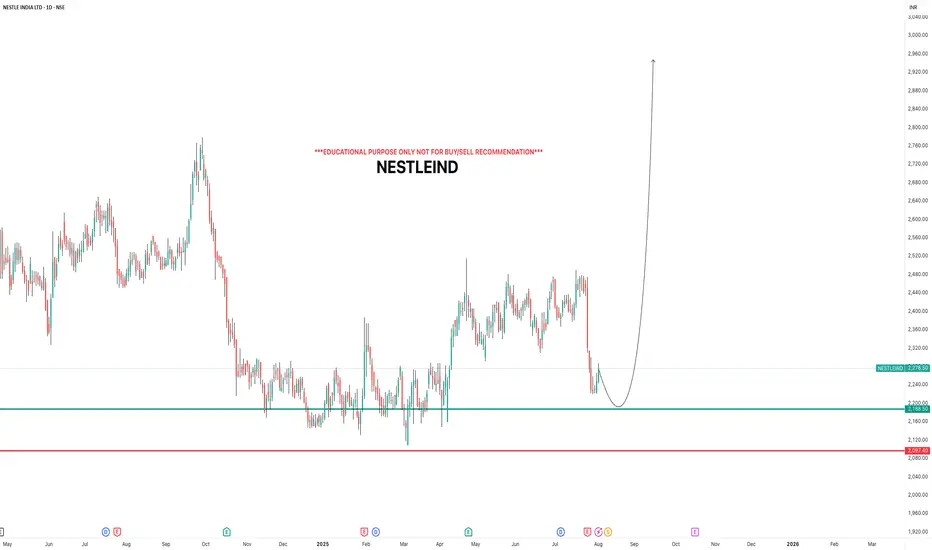
NESTLEINDIAi Observed these Levels based on Price Action and Demand & Supply which is my own Concept "PENDAM CONCEPTS"... Please don't take any trades based on this chart/post... Because this chart is for educational purpose only not for Buy or Sell Recommendation... Thank Q
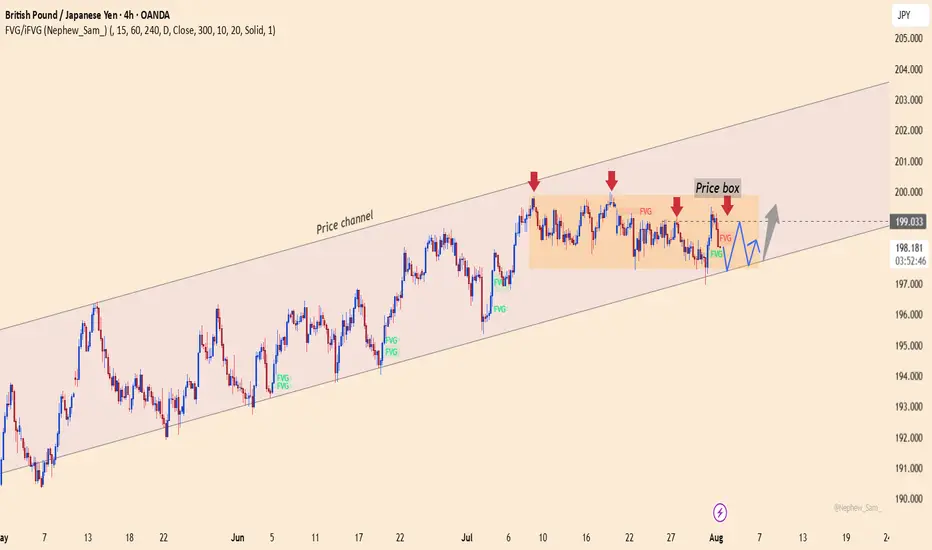
GBPJPY holds momentum, waiting for the final pushThe GBPJPY pair is moving sideways between 197.400 and 199.000, while maintaining its position inside the ascending price channel. Each pullback is quickly absorbed near the lower support, indicating that buying pressure is quietly building.
💡 Bullish factors supporting the trend:
– UK Services PMI beats expectations, strengthening economic outlook.
– BOJ maintains negative interest rates, weakening the JPY.
– Risk-on sentiment drives capital back into the GBP.
🎯 Suggested strategy:
Buy near 197.400 or on a breakout above 199.000.
Target: 201.500 | Stop-loss: below 196.800.
New targets for Reddit RDDT In this video I recap the previous reddit analysis where we looked for the long which is playing out really well .
I also look at the current price action and simulate what I think could be a target for the stock moving forward using Fib expansion tools as well as levels below for price to draw back too.
Welcome any questions below the chart . Thanks for viewing

XAUUSD – Downtrend Confirmed, Bears in ControlOn the H4 timeframe, gold has completely broken its short-term uptrend structure and formed a series of lower highs and lower lows. Every bounce is rejected at the strong resistance zone of 3,326 – 3,333 USD, confirming the clear downtrend.
Although the recently released Core PCE index was lower than expected, this is not enough to drive a recovery as other data, such as the Employment Cost Index and statements from the Fed, still show persistent inflationary pressure. Therefore, the monetary policy remains hawkish, causing money to flow out of gold.
Currently, the price is approaching the critical support zone of 3,247. If this level is broken, the scenario of further declines to 3,192 is entirely possible.

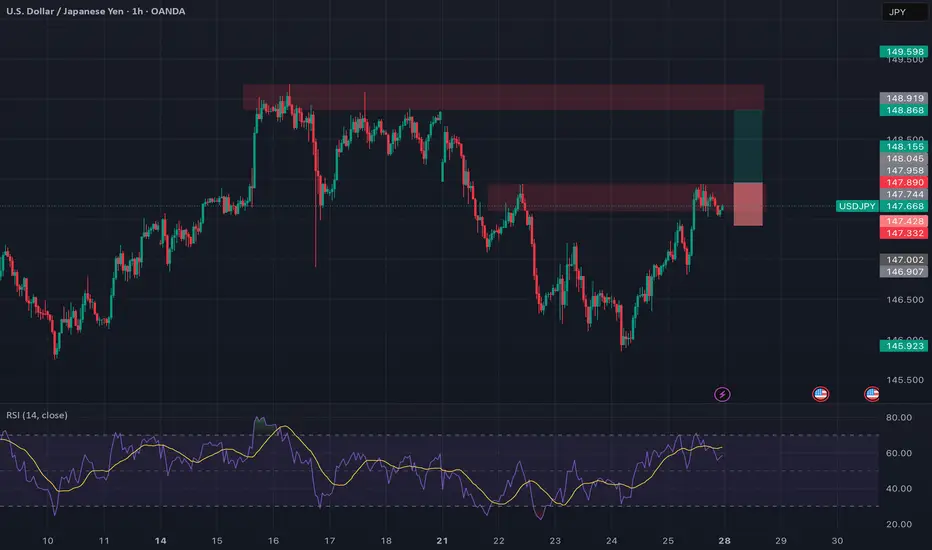
USDJPY: Breaking Out With Macro Backing 🟢 USDJPY | Breakout Opportunity Above Resistance
Timeframe: 1H
Bias: Bullish
Type: Break and Retest
📊 Technical Setup
USDJPY is currently consolidating at a key 4H resistance zone (147.75–147.90). A clean breakout and retest of this area will confirm bullish continuation.
• Entry: Above 147.90 (after confirmed candle close + retest)
• SL: Below 147.30
• TP: 148.90 / 149.60
• RR: ~1:2.5
• Indicators: RSI showing strong upside momentum, holding above 50
🧠 Fundamentals + Macro Confluence
• USD Strength: Strong macro & delayed rate cuts support USD upside
• JPY Weakness: BOJ remains dovish; risk-on sentiment weighing on JPY
• COT + Conditional Score: USD score increased to 17, JPY dropped to 8
• Risk Sentiment: VIX at 14.2 = RISK ON → bearish JPY bias
🧭 Gameplan
“Wait for confirmation above resistance before entering”
🔔 Set alerts around 147.90 and monitor lower timeframes for retest and bullish candle structure.
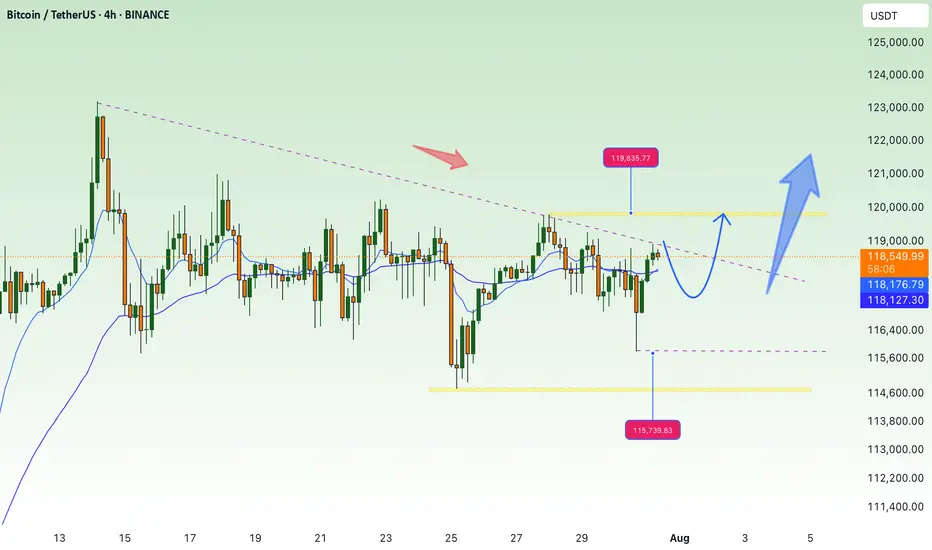
Accumulate waiting for btc price increase💎 BTC PLAN UPDATE – End of July (31/07)
📊 BTC Technical Analysis (4H Timeframe – End of July)
✅ Positive Signals:
• BTC has broken out of the consolidation triangle pattern (blue diagonal line), indicating a potential strong uptrend.
• The current price is retesting the breakout support zone around 117,800–118,000 → showing a good reaction and creating upward momentum.
• MA50 and MA200 are starting to slope upwards → confirming increasing buying strength.
📈 Bullish Scenario:
• If BTC holds above 118,000, it is likely to move toward the nearest resistance zone at 119,900.
• After breaking 119,900, the next targets are:
→ 122,792 (Fibonacci 1.618)
→ Further target: 127,900 (Fibonacci 2.618)
🛑 Risk Note:
• If the price drops below 117,000, it’s important to monitor again, as it may retest a deeper support zone around 114,500.
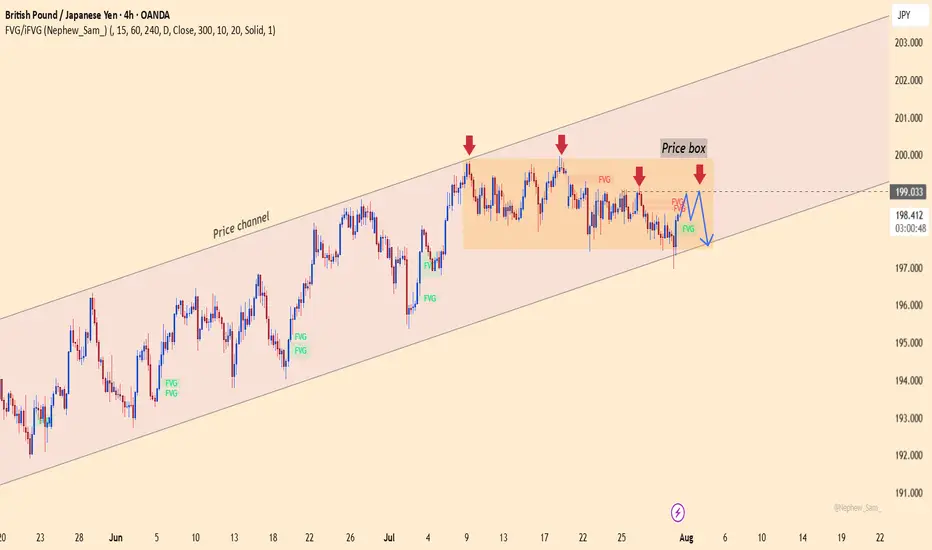
GBPJPY – Losing control zone, downtrend taking shapeGBPJPY is still trading within a long-term ascending price channel. However, what’s concerning is that recent price action has broken out of the previously established price box – which had acted as a stabilizing structure for the uptrend. Buyers failed to maintain momentum, repeatedly getting rejected at the top of the box.
Currently, GBPJPY is showing signs of breaking below the short-term support inside the price box, raising the risk of a deeper correction toward the lower boundary of the channel. A “lower high” structure is clearly forming, confirming that selling pressure is taking over.
From a news perspective, the Japanese yen is gaining strength as risk-off sentiment increases, while the pound is losing ground due to cautious tones from the Bank of England following a string of weak economic data. This shift is weakening GBP's appeal and could accelerate the bearish trend.
Strategy:
Wait to SELL if price pulls back to the former resistance zone within the price box and shows rejection signals. The downtrend will be confirmed if the recent low is broken. Stay out if there’s no clear confirmation.
What do you think will happen next with GBPJPY?
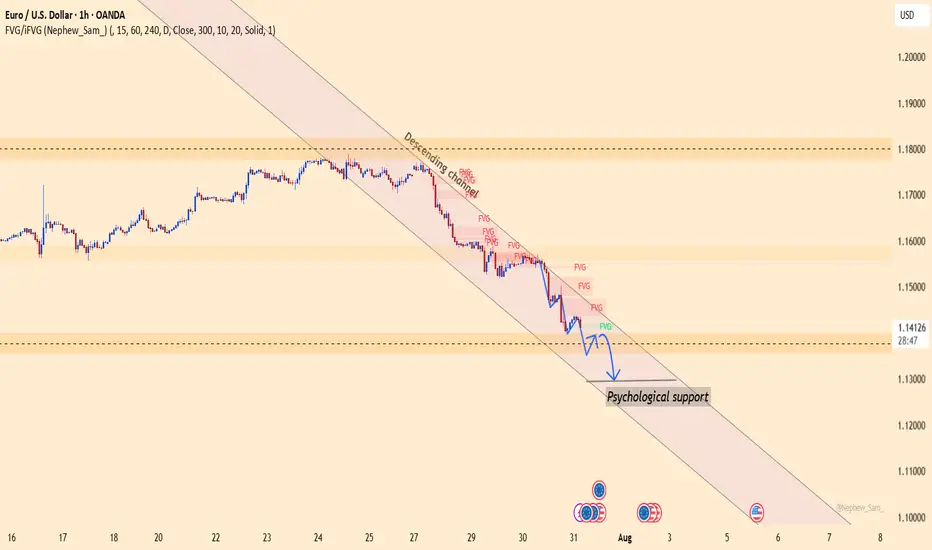
EURUSD plunges without brakes – The bears take full control!EURUSD continues its steep decline as both macroeconomic and technical pressures mount. A trade deal unfavorable to the EU, combined with the Fed’s hawkish stance, has fueled USD strength and dragged the euro sharply lower. At the same time, strong U.S. labor data and rising employment costs further reinforce the bearish outlook.
On the H1 chart, EURUSD is clearly moving within a descending channel. Key price zones have been broken with no significant bullish reaction, indicating that sellers remain firmly in control. The market is heading toward a psychological support area, with no signs of reversal as RSI stays weak.
I remain biased toward SELL setups on any short-term pullbacks, avoiding countertrend trades in this environment. If downside momentum continues, deeper targets may still be ahead.
In a market dominated by bearish sentiment, trading with the trend remains the smartest and safest approach.
LONG ON EUR/USDEUR/USD is currently at a major demand level after sweeping sell side liquidity.
The Dxy (Dollar) is overall bearish. I expect the dollar to fall and EUR/USD to rise to the previous high / supply level for over 200-300 pips.
News most likely will affect this pair in terms of volatility.

Continued recovery, positive after NFP news✍️ NOVA hello everyone, Let's comment on gold price next week from 08/04/2025 - 08/8/2025
⭐️GOLDEN INFORMATION:
Gold prices surged over 1.5% on Friday, climbing toward $3,350, as a weaker-than-expected U.S. Nonfarm Payrolls (NFP) report signaled a faster-than-anticipated slowdown in the labor market. Heightened geopolitical tensions between the U.S. and Russia further boosted safe-haven demand for the precious metal.
Following the disappointing July jobs data, markets began pricing in a potential interest rate cut by the Federal Reserve. While the Unemployment Rate held relatively steady, signs of labor market softness supported recent comments from Fed officials Michelle Bowman and Christopher Waller, who advocated for a 25-basis-point rate cut at the July 29–30 meeting.
Additional data added to the cautious sentiment: the ISM’s July report confirmed that U.S. manufacturing activity remains in contraction territory, while consumer confidence took a hit, according to the University of Michigan’s latest survey.
⭐️Personal comments NOVA:
Gold prices continue to be positively affected after last week's NFP news, market expectations of an early rate cut are rising
🔥 Technically:
Based on the resistance and support areas of the gold price according to the H4 frame, NOVA identifies the important key areas as follows:
Resistance: $3384, $3434
Support: $3331, $3307, $3268
🔥 NOTE:
Note: Nova wishes traders to manage their capital well
- take the number of lots that match your capital
- Takeprofit equal to 4-6% of capital account
- Stoplose equal to 2-3% of capital account
- The winner is the one who sticks with the market the longest

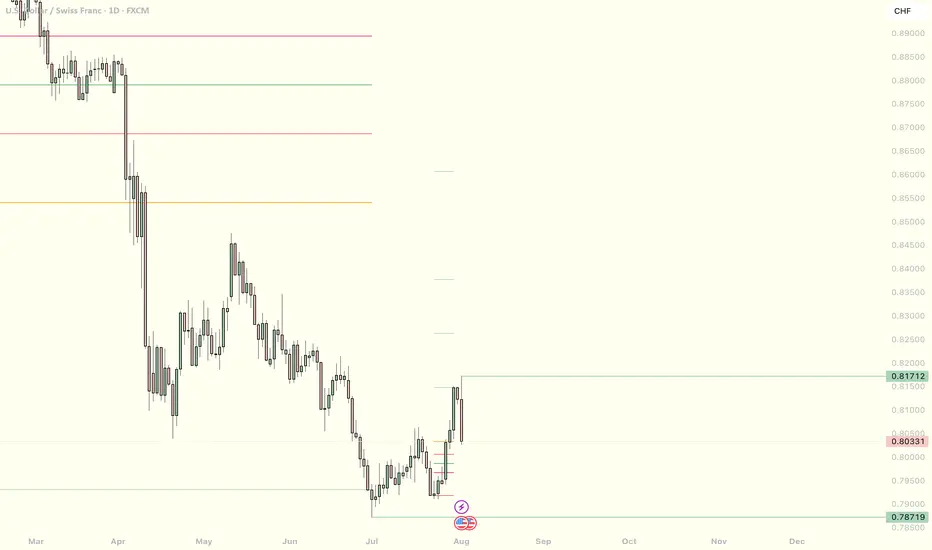
USDCHF Short term bullish?As dxy looks like it wants to run higher, USDCHF will likely also go higher for a short-term buying for a retracement to then continue its down trend. this pair looks good.
Reddit breaks out for bullish run I have been watching Reddit for a couple of weeks and identified that we had put in the .786 low from the correction since February and then formed a range that was well respected for the past 4 months .
In this video I highlight zones where i expect price to gravitate too and where a nice entry will be if you are looking to long reddit.
Tools used Fib suite , trend based fib , tr pocket , 0.786 + 0.382 and fixed range .

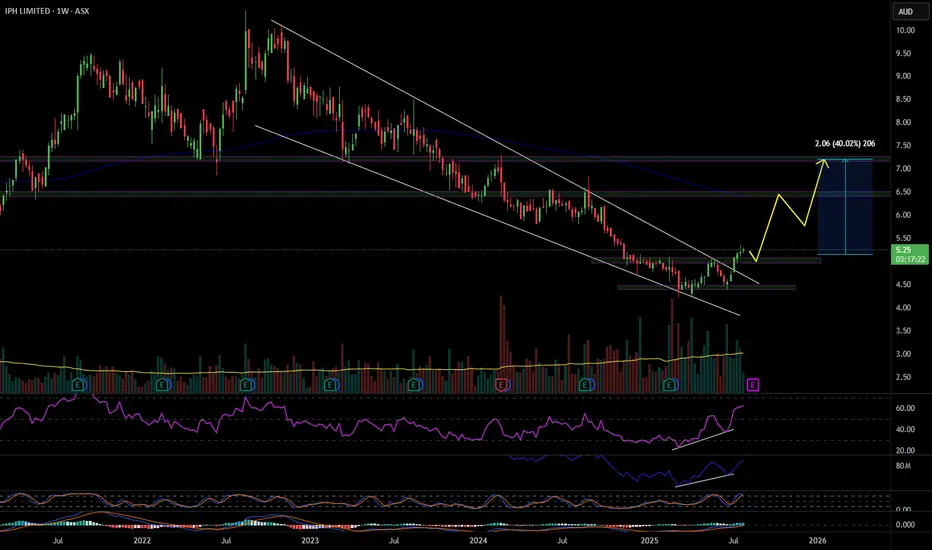
IPH 40% move coming?IPH has recently emerged from a descending wedge pattern, supported by bullish divergences in both the RSI and OBV, along with several divergences observed in shorter time frames. A pullback to the $5 level is anticipated, as the stock appears weaker on these smaller time frames. If IPH can maintain its position above the recent low of $4.40, it will indicate a structural shift, establishing higher highs and higher lows. My initial target is in the $6.50 range, followed by a potential move just above $7, representing a 40% increase. Good luck and happy trading 🍀
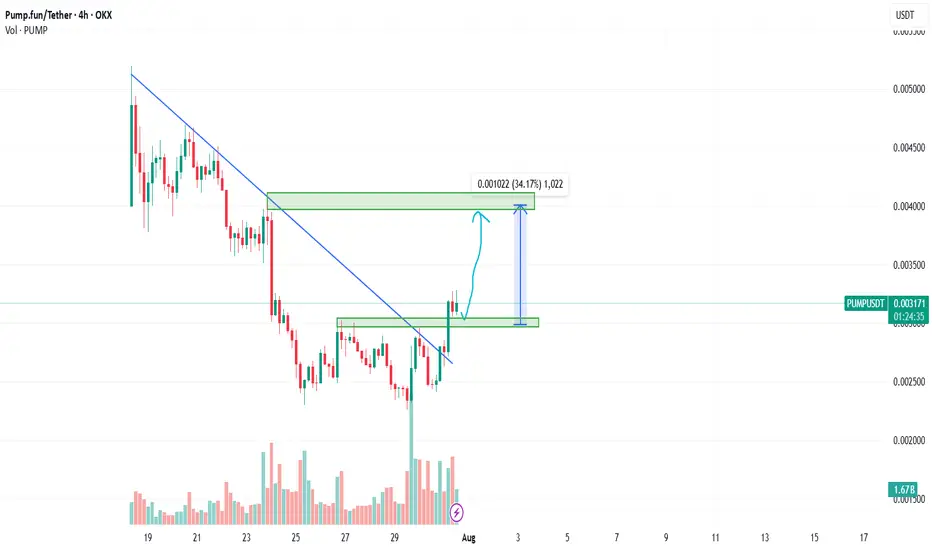
PUMPUSDT: Bullish Breakout and Retest - A Potential 34% Upside?Hello, traders!
Today we're looking at the PUMP/USDT pair on the 4-hour timeframe, and a very clean technical setup is unfolding that points towards potential bullish continuation. Let's break down the key elements of this analysis.
The Analysis
The chart presents a classic breakout and retest scenario, which is often a strong indicator of a trend reversal or continuation.
Descending Trendline Breakout: The most significant feature is the decisive breakout from a major descending trendline that had been capping the price for a considerable period. Breaking this trendline is a primary signal that the previous bearish momentum is weakening and buyers are starting to take control.
Break of Horizontal Resistance (S/R Flip): Following the trendline break, the price also successfully pushed through a key horizontal resistance zone, identified on the chart between approximately $0.002966 and $0.003044. This level has now, as expected, turned into a new support base.
The Retest: We are currently witnessing a pullback to this newly established support zone. This "retest" is a critical phase. A strong bounce from this level would confirm the breakout's validity and suggest that the market has accepted this price floor, paving the way for the next leg up.
Volume Confirmation: Notice the volume bars at the bottom of the chart. There was a visible spike in volume during the initial breakout candles, which adds conviction to the move. It indicates that the breakout was backed by significant buying interest.
The Trade Idea
Based on this structure, a potential long opportunity presents itself.
Entry: A favorable entry point could be found within the current support zone ($0.002966 - $0.003044), especially upon seeing confirmation of a bounce (e.g., a bullish engulfing candle or a hammer on the 4H or 1H chart).
Target: The analysis points to a primary target at the next major resistance level, located around the $0.004000 psychological mark. As measured on the chart, this represents a potential upside of over 34%.
Invalidation: This bullish outlook would be invalidated if the price fails to hold the current support and decisively closes back below the $0.002966 level. Placing a stop-loss below this zone is a prudent risk management strategy.
Conclusion
In summary, PUMPUSDT is displaying a textbook bullish setup. The combination of a trendline breakout, an S/R flip, and a live retest offers a compelling case for potential upside. As always, manage your risk carefully and wait for your preferred confirmation signals before entering a trade.
Disclaimer: This is not financial advice. The analysis provided is for educational and informational purposes only. Trading cryptocurrencies involves a high level of risk. Please conduct your own research and risk assessment before making any investment decisions.
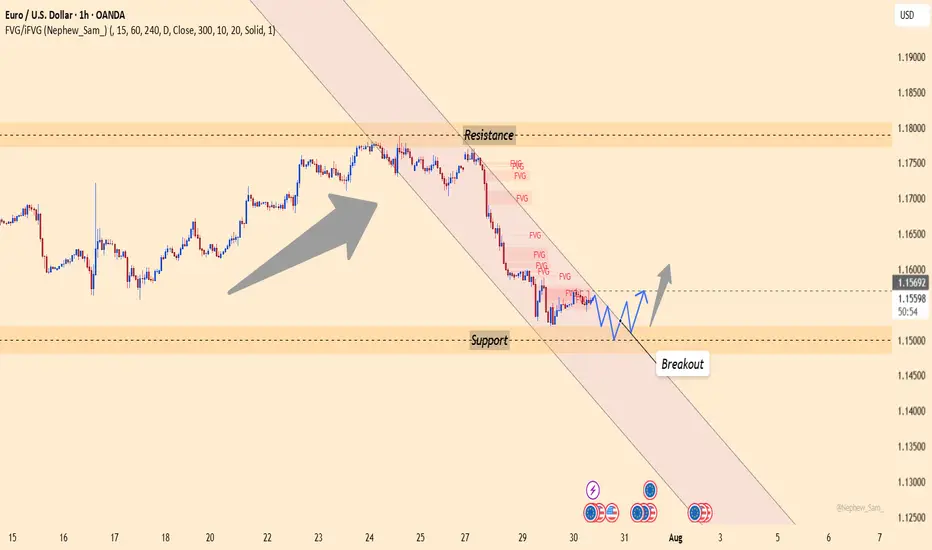
EURUSD – German GDP boosts EUR, but USD still holds the reins Germany’s recently released GDP data exceeded expectations, acting as a catalyst for EURUSD to rebound after a steep decline. However, this upward move remains fragile, as the USD continues to dominate the market—especially with several key U.S. economic reports set to be released later this week.
On the chart, EURUSD has just bounced from the 1.15000 support zone, which has historically served as a strong floor. If the price holds above this level and breaks the downtrend line, the short-term target could move toward the 1.15700 resistance zone.
Still, the path ahead won’t be easy. The market is closely watching upcoming U.S. data, such as the jobs report and the Core PCE index—the Fed’s preferred inflation gauge. If these figures come in strong, the USD could regain strength and put pressure back on EURUSD.
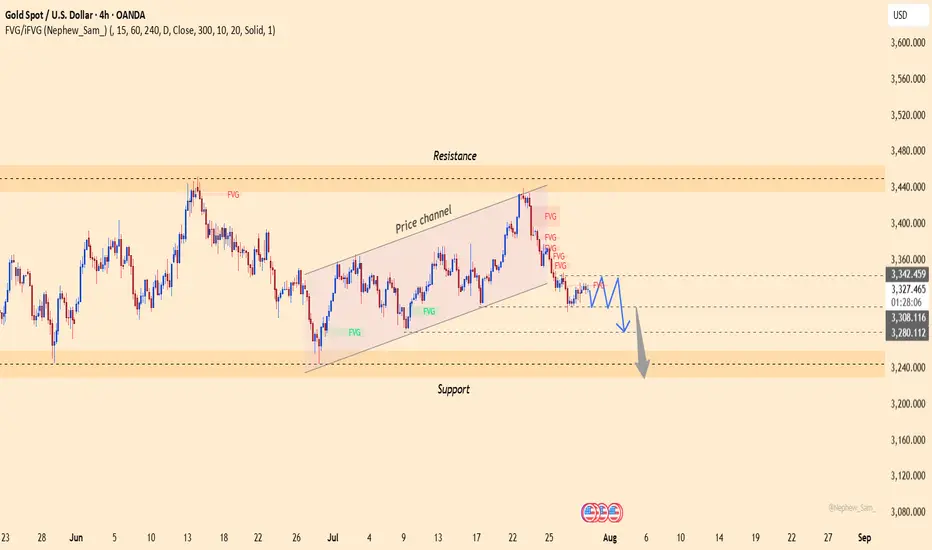
XAUUSD – Downtrend Continues as USD StrengthensGold remains under significant pressure as the U.S. dollar continues to gain strength following a series of positive economic data from the U.S. Specifically, GDP grew by 2.5%, beating expectations, while ADP Non-Farm Employment data also came in strong. This suggests the U.S. economy remains resilient, supporting the Fed's hawkish stance and keeping the dollar strong.
On the 4H chart, XAUUSD has broken below the previous ascending price channel and is now trading under the 3,340.400 resistance zone – an area packed with unfilled FVGs. The current price structure leans bearish, with any rebounds likely to be temporary pullbacks.
If USD strength continues, gold could drop further toward the support zone at 3,279.200 or even lower near 3,240.
Trading Strategy: Focus on SELL
Entry: Around 3,325 – 3,340.400 upon price rejection signals.
Target: 3,279.200 or lower.
Stop-loss: Above 3,342.459
LONG ON NZD/USDNZD/USD is at a major demand level.
Dollar is bearish. Economic News this afternoon should assist and pushing this pair up.
Looking to catch 200 pips to the previous high.

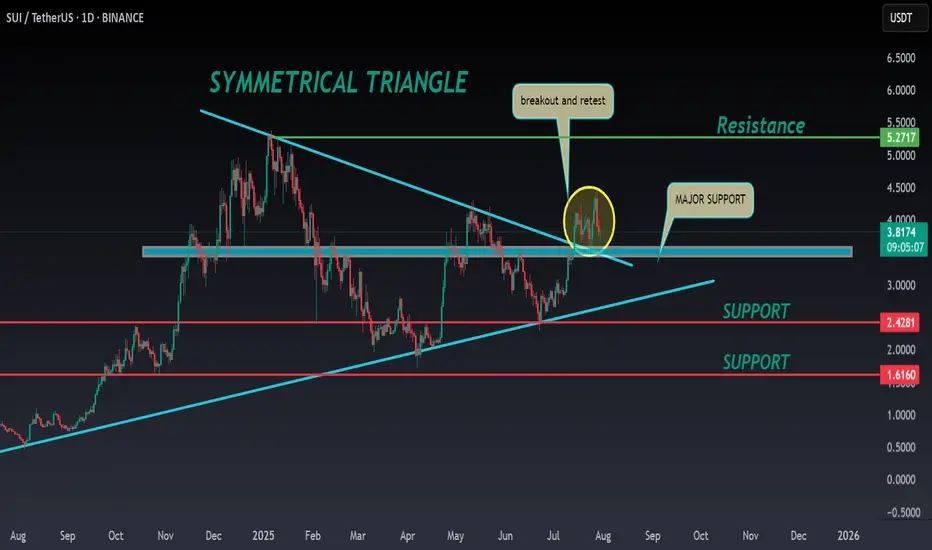
SUI ANALYSIS🔮#SUI Analysis 💰💰
#SUI is trading in a symmetrical triangle in a weekly time frame and if it breakouts with high volume then we can see a bullish momentum in #SUI. Before that we will see little bit bearish movement towards its support zone and that a bullish movement.
🔖 Current Price: $3.81
⏳ Target Price: $5.27
⁉️ What to do?
- We can trade according to the chart and make some profits in #SUI. Keep your eyes on the chart, observe trading volume and stay accustom to market moves.💲💲
🏷Remember, the crypto market is dynamic in nature and changes rapidly, so always use stop loss and take proper knowledge before investments.
#SUI #Cryptocurrency #Pump #DYOR
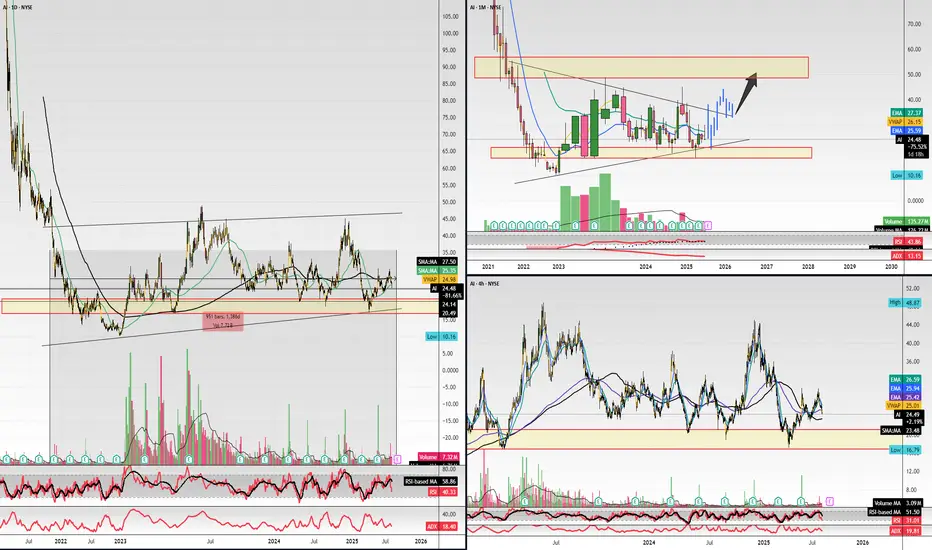
$AI they sleep, i eat. Quiet danger..Hello,
Name has been on my watch for a week or so now, finally just sitting back and getting to a multi analytical chart.
To begin: Yes, I see the head and shoulders pattern forming, scary, I know. Aside from that just zoom out, this name has traded in this range for 1,200 days... the range of $20 to $30 with some bumps in the $40's and low $20's with taps in the teens. This name is quiet, not a loud player like other AI tickers. Something smells fun here. I'm going to be gearing in some $40 calls for 2026. I may risk 20% of my port here. I feel confident in this one, I do. The name is holding good support in the low $20 range and there are a lot more green candles than red. I know other names are getting more attractive like BBAI, you still have SMCI, CRWV, NVDA and so forth, which is fine, means nothing. This was a meme name type of stock about a year ago. I believe this will go on a run towards $50. If you have patience, $50 calls for 2027 would be appropriate and at a fair price for a swing and a possible short squeeze. For those who want to play the shorter term volatility $40 calls for Jan. 2026.
Good luck.
WSL.
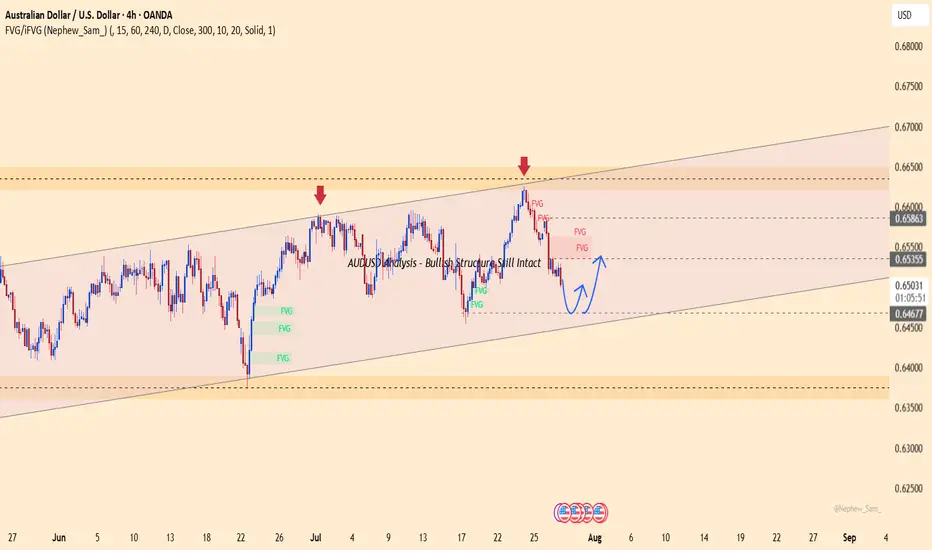
AUDUSD Analysis – Bullish Structure Still IntactAUDUSD is trading within a clear ascending channel on the H4 chart. After dropping from the FVG zone around 0.65800, price has reacted well to the lower boundary support near 0.64650.
Currently, price action suggests the potential formation of a short-term bottom. If this level holds and the pair rebounds, the next target could be the red FVG zone near 0.65400.
Recent Supporting News:
U.S. consumer confidence slightly weakened, causing the dollar to cool off — offering technical rebound support for AUD.
Trading Strategy:
Prefer short-term Buys near 0.64650 if a confirmed bounce appears, with target around 0.65400. Be cautious if price breaks below the ascending channel.
Do you think AUD will continue to rise within this bullish channel?