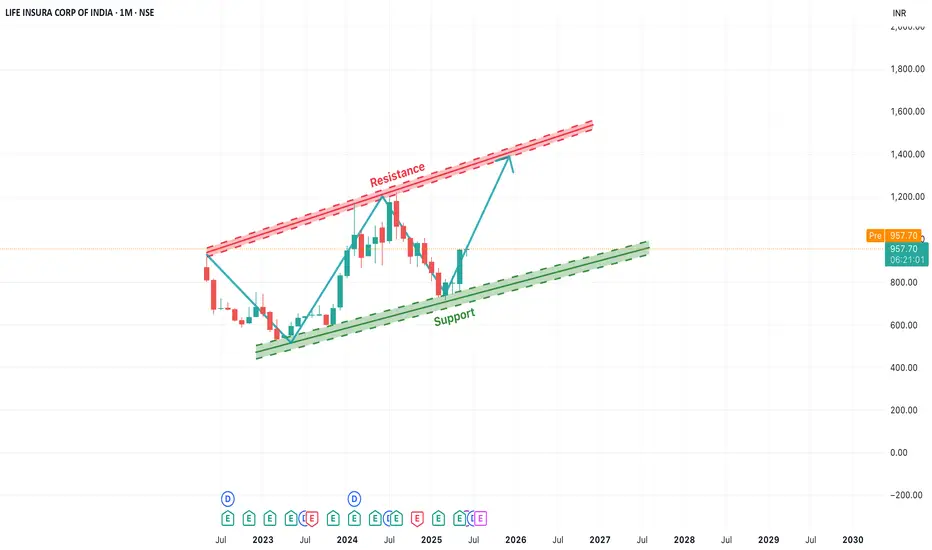
[Long-Term]LICI Rising Channel Pattern Indicates Bullish OutlookIn this monthly chart of LICI, we observe a clear ascending channel pattern forming over the past two years. The price has consistently respected both the support and resistance trendlines, creating a strong bullish structure.
Currently, the stock is bouncing off the lower support trendline, indicating a potential upward move towards the upper resistance zone. This offers a positive long-term outlook, especially if the momentum sustains. The key levels to watch are:
Support Zone: Around ₹850–₹900
Resistance Zone: ₹1250–₹1300
Traders and investors can monitor for a gradual rise toward the resistance level. A breakout beyond this channel may open up new highs, while a breakdown below the support trendline would invalidate the pattern.
Longsetup
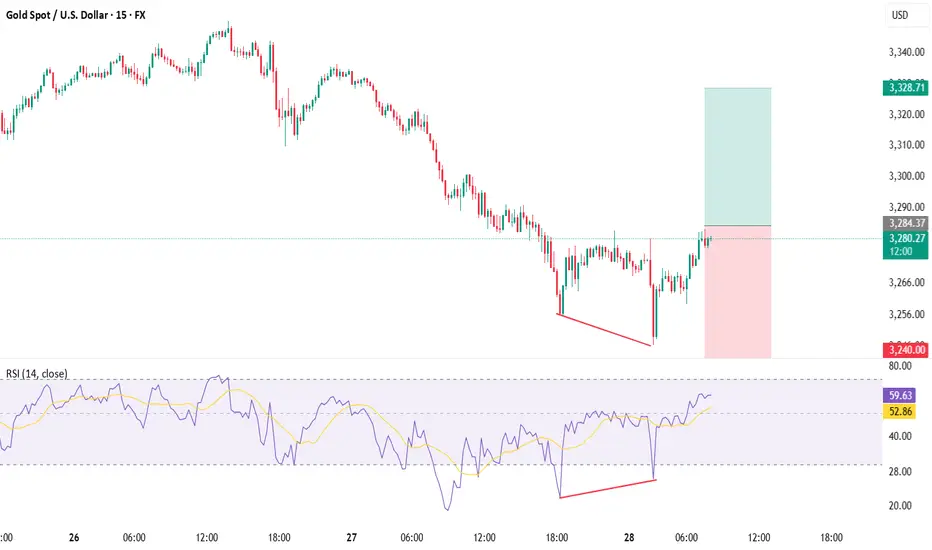
XAUUSD📉 The Setup: Bullish Divergence on XAUUSD (15m/30m)
Buy only on Breakout
🔍 Observation:
On the 30-minute timeframe, price made a lower low while the RSI indicator printed a higher low — classic sign of bullish divergence 🔄.
💡 Translation: Bears are losing steam! Bulls may be preparing to charge in! 🐂⚡
📊 Trade Plan – Long Entry
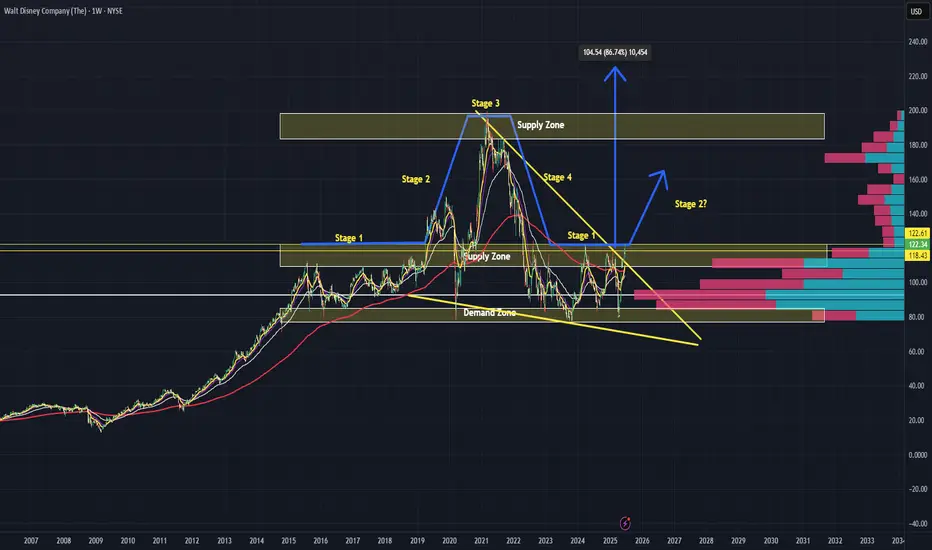
Disney: A Magical Breakout in the Making?
🏰After 3 years of consolidation, Disney ( NYSE:DIS ) is finally showing signs of life on the charts. Price action is breaking out of a well-defined falling wedge, aligning almost perfectly with a classic Wyckoff Price Cycle — and it now looks poised to enter Stage 2: The Uptrend.
For traders waiting on confirmation, a clean break and retest of the $122 supply zone could serve as a high-conviction signal that the tide is turning — and that the Magical Kingdom may soon be sprinkling profits across portfolios.
🔥 Fundamentals Catching Up to the Chart
Streaming strength is real:
Disney+ and Hulu combined reached 180.7 million subscribers in Q2 FY 2025, adding 2.5 million new users in a single quarter. Disney+ alone accounts for 126 million subscribers, with 1 million added in North America alone.
Strategic moves underway:
Disney is also in the process of acquiring a 70% stake in FuboTV, integrating it with Hulu + Live TV to supercharge its live-streaming and sports bundling strategy. The deal is awaiting regulatory and shareholder approval before closing.
💡 Bottom Line
With technical momentum and streaming fundamentals finally aligned, Disney could be setting up for a strong multi-year upside move.
Stay sharp. Stay disciplined. And as always — this isn’t financial advice. Do your own due diligence.
Happy Hunting!
$CELH rounding bottoming formatiion. PT $45 before end of 2025- We gotta see re-acceleration in growth and orders from NASDAQ:PEP to re-enter the growth trajectory.
- Technicals look good but I suggest adding in increments + weekly spaced buying

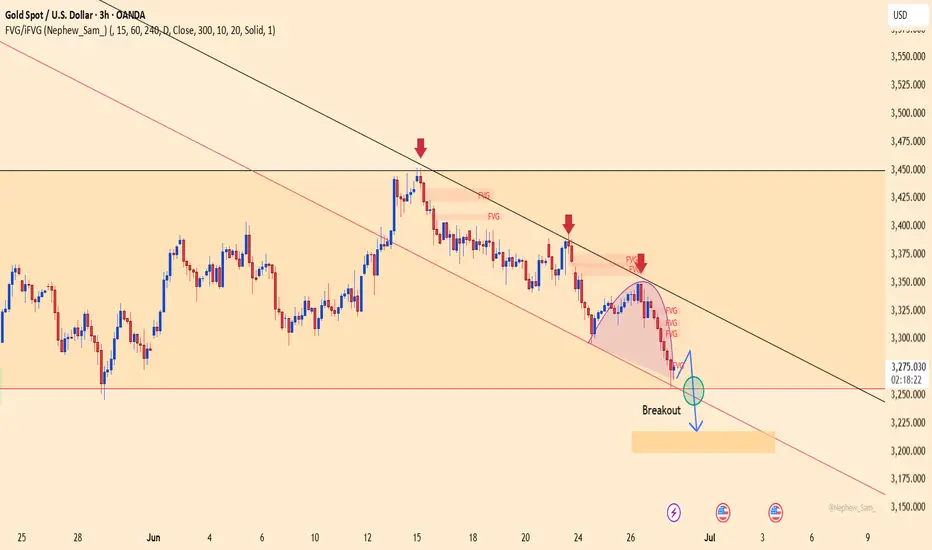
XAUUSD – Bearish Trend Continues After Channel BreakoutGold is currently moving within a clearly defined descending channel, with successive lower highs confirmed at each retest of the dynamic resistance line. Following news of a temporary ceasefire between Iran and Israel, gold's safe-haven appeal weakened, triggering strong selling pressure that drove prices sharply lower, breaking below the key $3,260 support.
A rounded top pattern and a clean breakout beneath the channel indicate that sellers are in control. The next downside target lies around the $3,218 confluence zone, where a temporary bullish reaction may occur. The nearest resistance on a pullback is around $3,349 – aligned with the broken upper channel boundary and a dense FVG zone.
If the price fails to quickly reclaim the broken channel, the bearish trend is likely to persist in the short term. Traders should closely monitor price action near the $3,218 zone for potential entries or reversals.
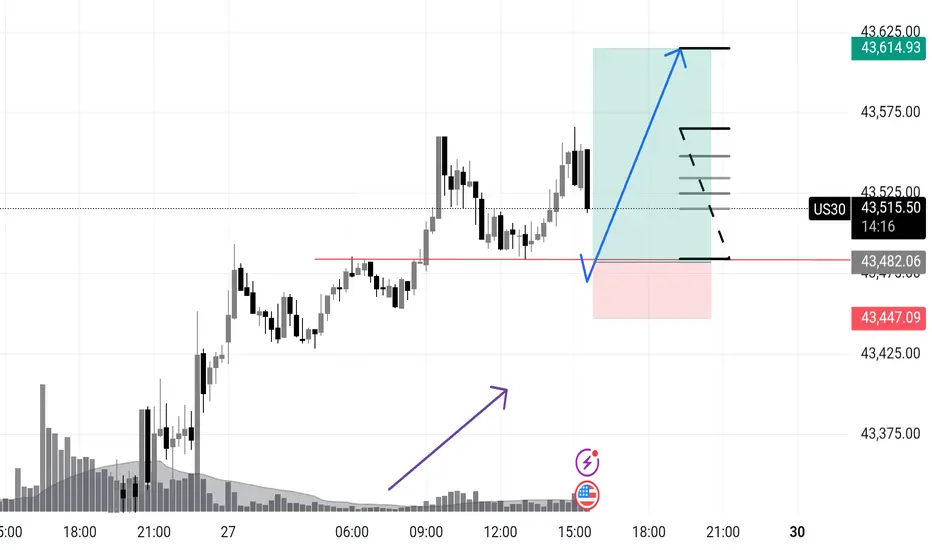
US 30 Potential longUS30 – Wyckoff Spring Setup for NY Session | Intraday Execution Play
Price rallied in the London session with rising volume and structure breaks —
Now we’re anticipating a classic Wyckoff spring scenario just ahead of NY open.
📍 Key Expectations:
Sweep of intraday support around 43,482
Strong buyer reaction (spring confirmation)
Expansion into the 43,600+ zone — possible 1.5R+ continuation
⚠️ Volume buildup + stop placement below prior structure make this zone ripe for a fakeout → reversal.
I’m watching for a quick flush below the line → wick rejection → engulfing confirmation to trigger longs.
This is a trap trade — smart money baits shorts, I’m betting they get squeezed.
🔫 Entry: On confirmation after spring
📉 Invalidation: Below the spring low
🎯 Target: 43,610 zone and trailing after break of 43,570
Let them walk into the trap. Then pull the trigger.
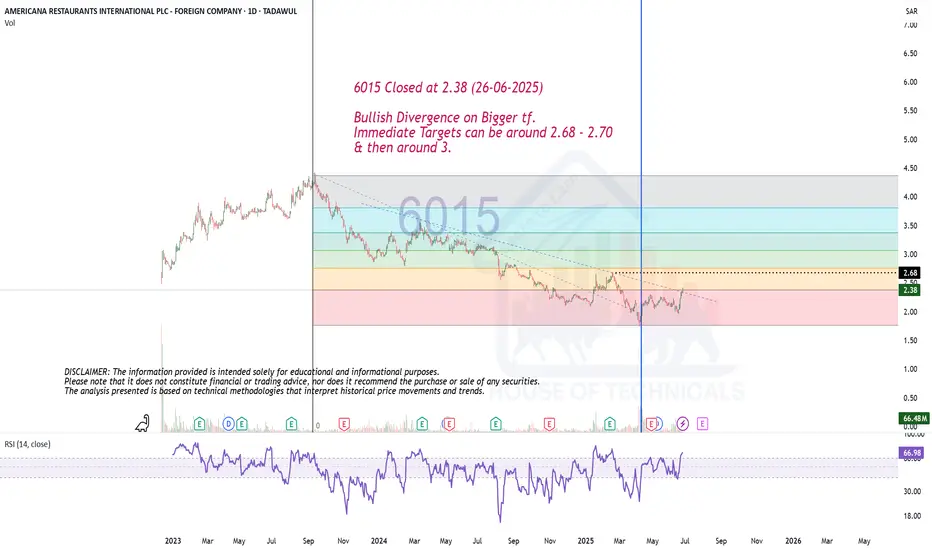
Bullish Divergence on Bigger tf.6015 Closed at 2.38 (26-06-2025)
Bullish Divergence on Bigger tf.
Immediate Targets can be around 2.68 - 2.70
& then around 3.
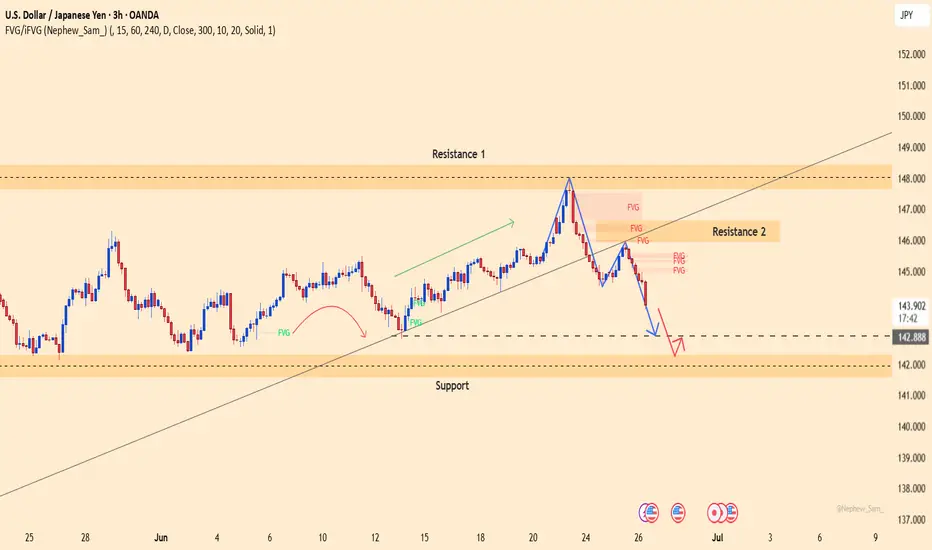
USDJPY – Uptrend Still Intact, But Waiting for a BounceUSDJPY is currently pulling back toward the key support zone at 142.244 after being rejected from the 148.000 resistance area. This recent drop reflects strong selling pressure from the dense FVG zones near Resistance 2.
However, the overall structure remains bullish, with a series of higher highs and higher lows still intact. The current support zone is crucial—if it holds, USDJPY could rebound toward 145.800 and potentially retest the 148.000 level.
On the news front:
– A fragile ceasefire between Iran and Israel has improved global risk sentiment, reducing demand for USD as a safe haven.
– The Bank of Japan kept interest rates unchanged and signaled caution in reducing bond purchases—supporting the yen, but not enough to reverse the dollar's edge.
– The wide interest rate differential still favors the USD.
Strategy: Watch for bullish confirmation at 142.244. If buyers step in clearly, it may present a long opportunity in line with the dominant uptrend.
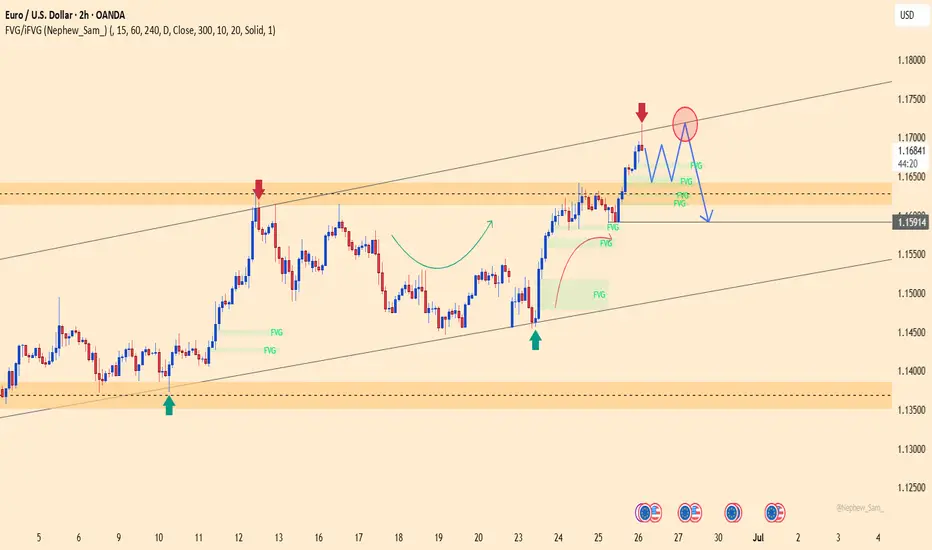
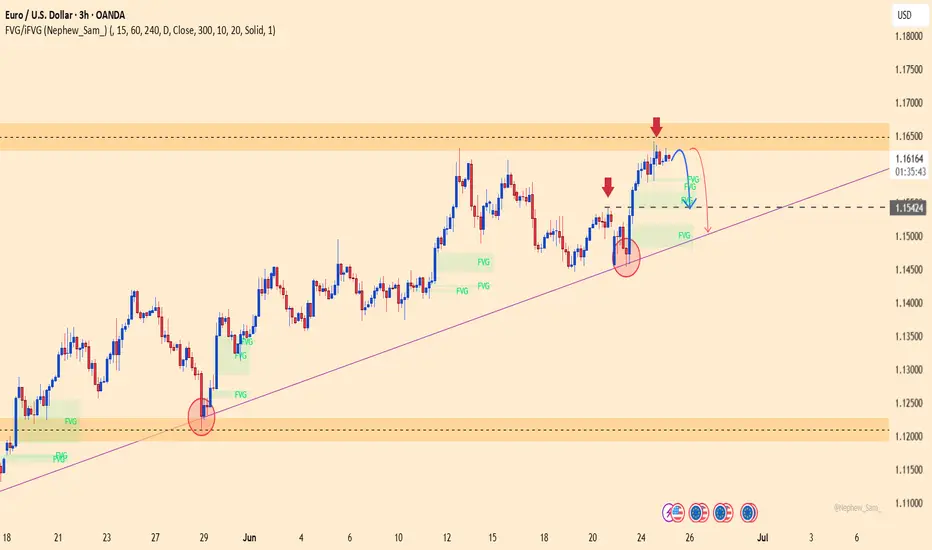
EURUSD – Short-Term Top Signal, Sellers Getting ReadyEURUSD has reached the upper boundary of the ascending channel around 1.17190 and immediately faced selling pressure. This zone previously acted as a strong reversal area, and with a rejection candlestick and a forming FVG, the risk of a downward correction is increasing.
Currently, the price is moving sideways just below the high, forming lower highs — suggesting a possible distribution pattern before breaking the bullish structure. If price breaks below the FVG zone near 1.165–1.166, the move could extend toward the technical target at 1.15900 — aligning with the channel bottom and a historical liquidity area.
Recent fundamental drivers:
U.S. economic data remains strong (Jobless Claims, Core PCE) → supports USD strength
The ECB remains cautious and hasn’t committed to further rate hikes → slightly weakens the euro
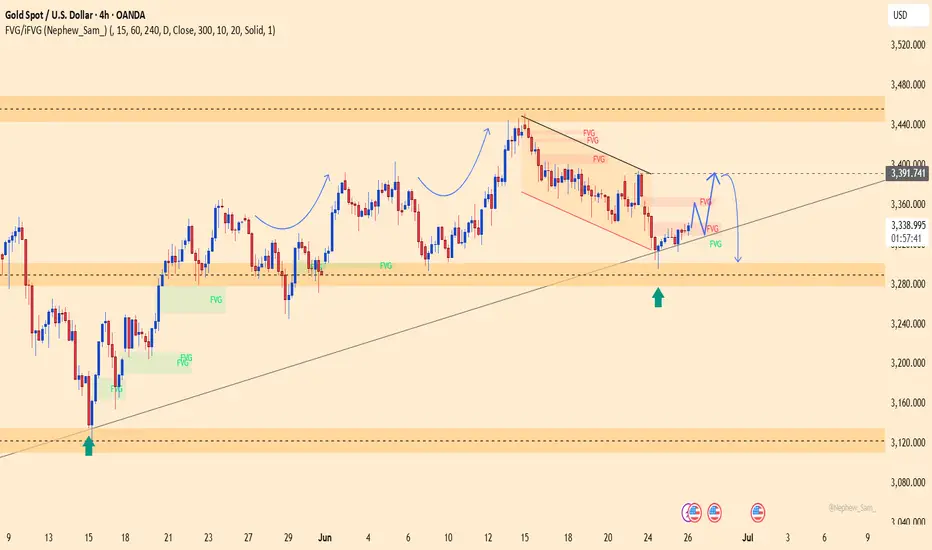
Is Gold Setting a Trap for Traders?Gold is currently retesting the FVG zone around 3,392 after breaking below a key trendline — a classic sell-trigger area if price gets rejected.
Bearish momentum is supported by:
U.S. jobless claims: 244K < 245K forecast → Stronger USD
Iran–Israel ceasefire → Reduced demand for safe-haven assets
If price fails to break above 3,392, the next downside target is the 3,299 support zone.
Trade idea: Watch for a rejection around 3,390–3,392 to consider short positions.
Bearish bias remains valid as long as price stays below 3,392.
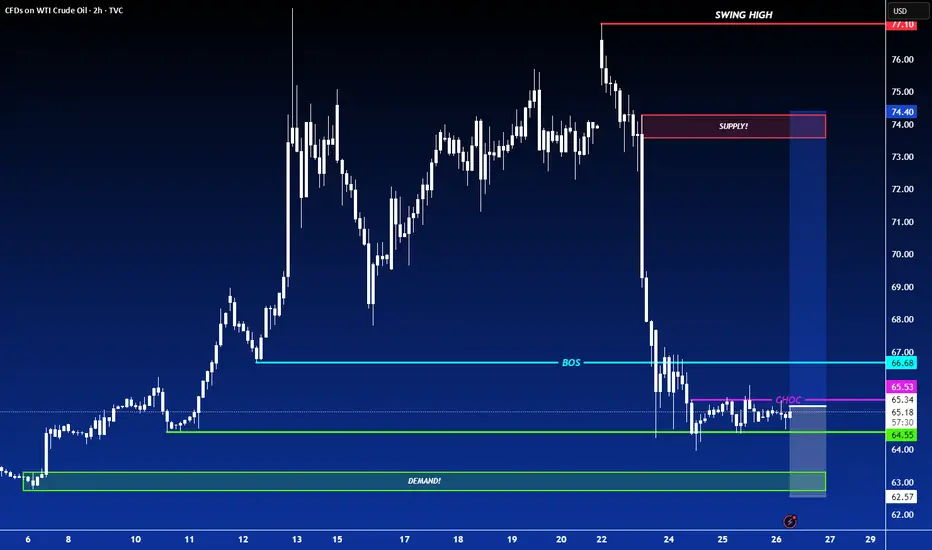
LONG ON OILUSOIL is consolidating at a major demand area.
We have a small choc (change of character) from down to up on the lower timeframe.
I will be buying oil to the next supply level looking to catch 500-1000 pips.
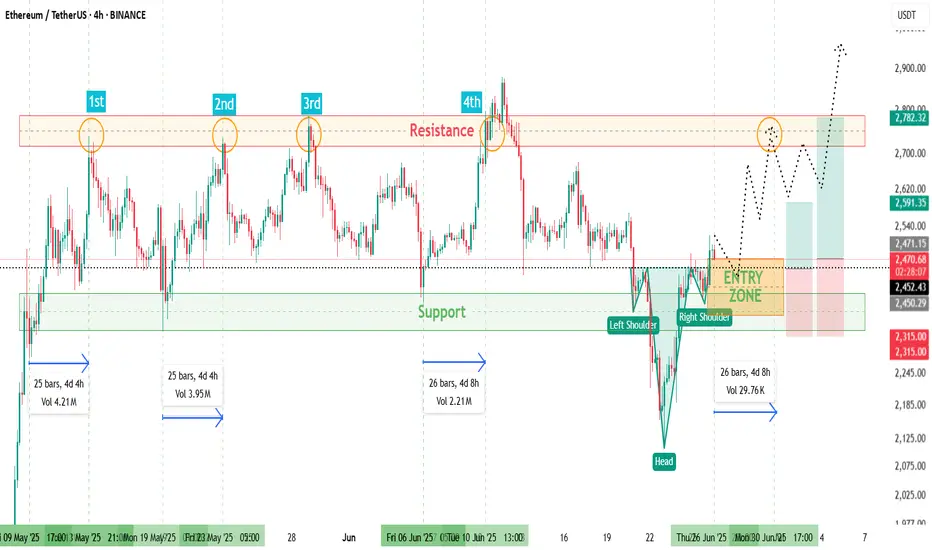
ETHUSD📊 ETH/USD 4H Trade Setup For Long
🔍 Watching an Inverse Head & Shoulders 🫱🫳👤
🔼 Entry: At Fib levels or marked zone
🛡️ Stop Loss: Below support / right shoulder
⏳ Time to Move: ~4 to 5 days from Support ➡️ Resistance
🚪 Tried to break major resistance 4 times
🌍 Geopolitical tensions 🌐 caused pullback
⚡ Now, resistance is weakening —
💥 Breakout likely
🎯 High Risk:Reward setup
📈 Get ready for the move!
EURUSD – Signs of Weakness, Risk of Trendline BreakEURUSD is showing signs of weakness after a strong rejection at the 1.16300 resistance zone — a level that previously acted as a distribution area. Despite a brief rebound driven by mixed PMI data, the Euro failed to maintain its momentum and is now turning lower.
If price breaks below the support zone around 1.15400 — which aligns with both the trendline and an old FVG — a deeper decline toward the 1.15000 level could be triggered. Continued failure to surpass the 1.16300 resistance would further strengthen the corrective pressure.
On the fundamental side, expectations for the ECB to hold rates steady and weaker-than-expected Eurozone data are dampening the Euro’s outlook. Meanwhile, the US Dollar remains firm on safe-haven demand, with upcoming US GDP and Core PCE data likely to drive short-term direction.
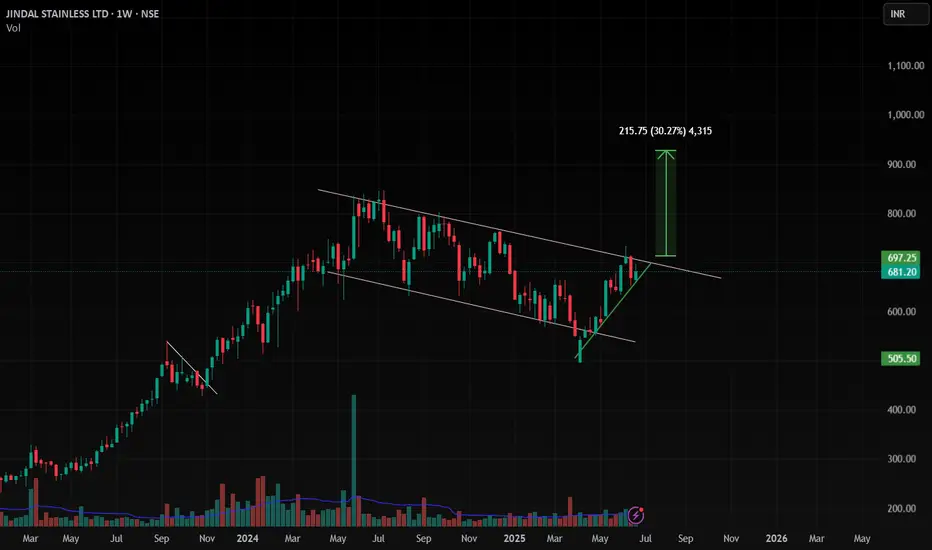
JSL , 1W Pattern is looking soo good and it is ready to Breakout from this pattern ,
do not enter into this until it give a Good Weekly close , if you enter it can be a trap also , so enter after Confirmation and Risk according to your Capital .
Follow for More Swing Ideas Like this
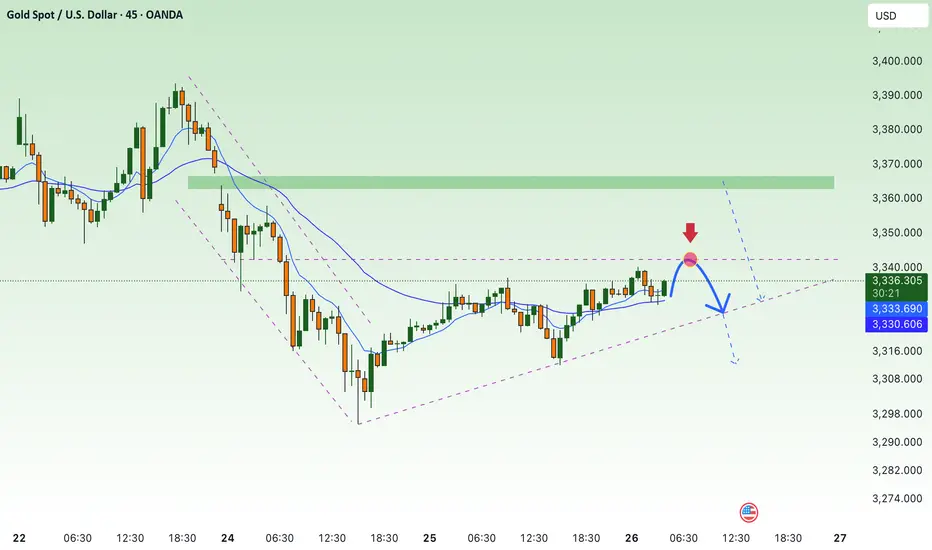
GDP and price range accumulated above 3300⭐️GOLDEN INFORMATION:
Gold prices held firm during the North American session on Wednesday, climbing over 0.30% as easing tensions between Israel and Iran boosted risk sentiment. Meanwhile, disappointing US housing data could prompt future action from the Federal Reserve (Fed). However, Fed Chair Jerome Powell's continued hawkish stance has limited further upside for the precious metal.
At the time of writing, XAU/USD is trading around $3,334, up 0.34%, as the US Dollar pares earlier gains and Wall Street posts modest advances.
⭐️Personal comments NOVA:
moving in accumulation range following 2 trend lines, trading above 3300
⭐️SET UP GOLD PRICE:
🔥SELL GOLD zone: 3364- 3366 SL 3371
TP1: $3352
TP2: $3345
TP3: $3330
🔥BUY GOLD zone: $3302-$3300 SL $3295
TP1: $3315
TP2: $3328
TP3: $3340
⭐️Technical analysis:
Based on technical indicators EMA 34, EMA89 and support resistance areas to set up a reasonable BUY order.
⭐️NOTE:
Note: Nova wishes traders to manage their capital well
- take the number of lots that match your capital
- Takeprofit equal to 4-6% of capital account
- Stoplose equal to 2-3% of capital account
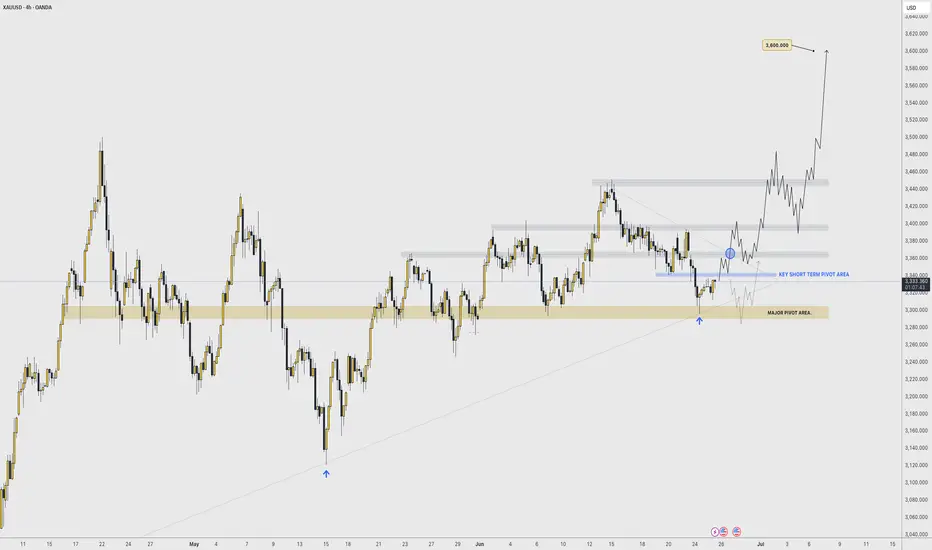
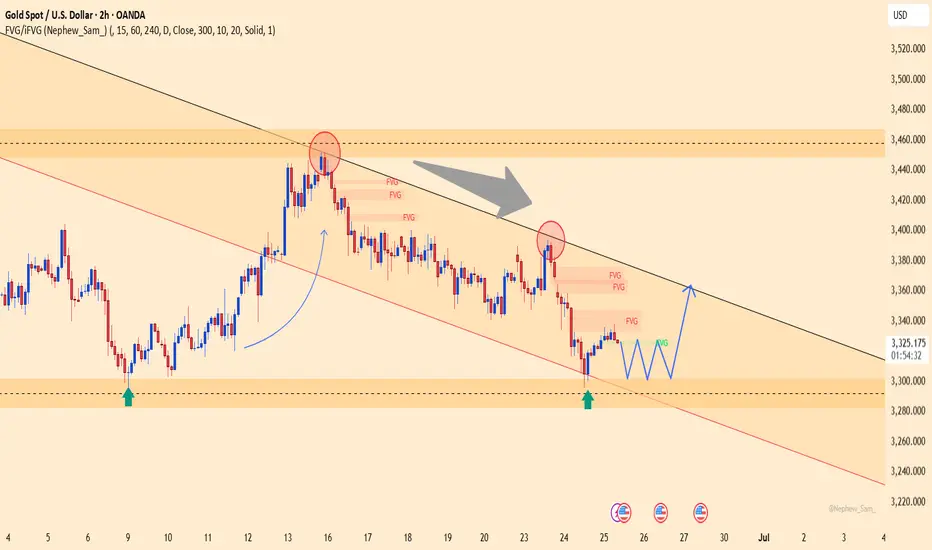
BULLS HOLDING KEY PIVOT 〉ATH AROUND THE CORNER As illustrated, Im trying to visualize what a potential bull run could look like starting from what seems to be a "bullish signature" move by gold: a diagonal double bottom.
Don't believe me; go back in time and study how gold makes bottoms and how new bull runs start. The fact that it was NY that manipulated BOTH times and got the best price, is a strong footprint that MIGHT just indicate a potential bottom (at least of this current bearish correction.
I won't say "this is it" and ATH are next FROM this potential rebound; HOWEVER, it could indicate at least the next 10 to 24 hours of potential bullish impulse to retest a degree of the bearish drop since Sunday's weekly open.
Hammer candle from Tuesday's NY session low + today's 4H bullish engulfing, are also powerful components that show bullish strength indicating 3300 to be a major support area.
I'm expecting (BUT NOT ADVISING) Asia to break aggressively to the upside confirming that this could have been this current correction's bottom, and/or at least this week's low.
Should Thursday close above Tuesday's high or consolidating near it, also shows signs of bullish strength and opens the door for Friday to make a second bullish impulse move.
This would reflect on the Weekly candle leaving a long rejection wick and closing (potentially) back above 3350 - 3360.
Should this be the case, the following week would have the road paved to lift off price to retest previous 4H highs of 3440 - 3450 range.
...
July is a bullish month historically. Don't believe me; search "seasonality tool, gold" and see it for yourself.
It is a matter of weeks for Gold to breakout of this wide accumulation phase it has been since end of April, and start a fresh and brand new bull run that could/should last until the end of the year.
-
GOOD LUCK
Persa
BTC recovers, price range sideways trend line💎 Update Plan BTC (June 25)
Notable news about BTC:
🌐 Growth stimulus factor
Reducing geopolitical tensions: The ceasefire agreement between Iran and Israel has helped improve investor psychology, promote capital inflows into risky assets like Bitcoin.
The dollar weakened: The USD index dropped to the lowest level in a year due to concerns about the economic impact from President Trump's tax policies, making Bitcoin a more attractive choice for investors to search for replacement assets.
Expectations for monetary policy: The decision of the US Federal Reserve (Fed) on keeping interest rates stable and interest rate cutting capacity in July has motivated the cryptocurrency market.
Technical analysis angle
Bitcoin may increase to the highest level of all time
Bitcoin price reached the lowest level of $ 98,200 on Sunday but has recovered strongly 5% in the next two days, closed on the dynamic average line according to the 50 -day exponential jaw at $ 103,352. At the time of writing on Monday, the price continued to trade higher at about $ 106,500.
If BTC continues to increase, the price can expand the momentum to the highest level of all time is $ 111,980 on May 22.
The relative power index (RSI) on the daily chart is 54, higher than the neutral level of 50, showing the motivation for price increase. The average divergent divergence (MACD) is referring to the price intersection (the MACD is about to cut on the signal line), if completed, the purchase signal will be made.
==> Comments for trend reference. Wishing investors successfully trading
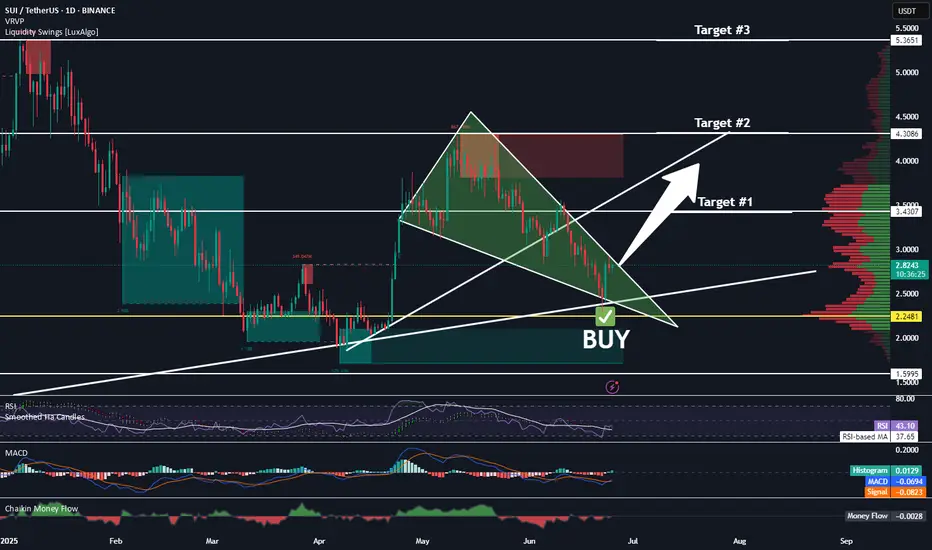
SUI Is Ready To Run!Good Morning Trading Fam,
I'm putting out a quick trade setup here on SUI, a coin I am honestly a long-term hodl'er of. I believe this coin has an exciting future ahead of it with tremendous potential to change the blockchain landscape for the better.
But this post is for those of you interested in trading it.
We have a perfect setup here. Descending bullish triangle, which we are nearing the end of. Strong long-time support underneath us. And my proprietary indicator has given us a buy signal at the point of confluence of both of the above. I have set three targets for you. Obviously, the higher the target, the higher the risk. Trade accordingly and let me know in the comments how you did. It makes me happy to know my followers are successful in their trades.
Best,
Stew
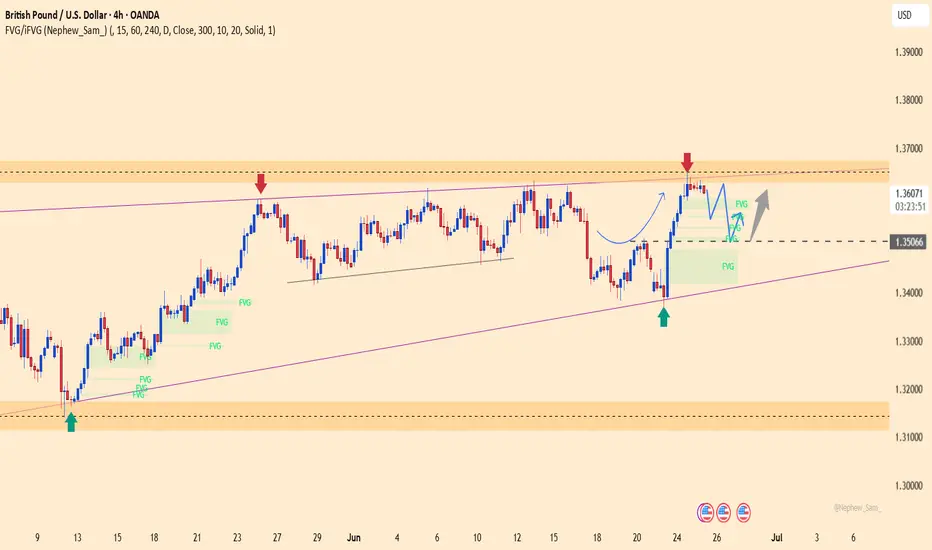
GBPUSD – Bullish Structure Holds, Waiting for a Clean RetestGBPUSD recently bounced strongly from the ascending trendline and hit resistance at 1.36300. The price is now slightly correcting, with a high probability of retesting the 1.35000 support zone – an area of FVG and technical confluence.
The bullish structure remains intact as long as price holds above this level. Positive UK Services PMI data further supports the medium-term uptrend.
Are you waiting for the pullback to jump in?
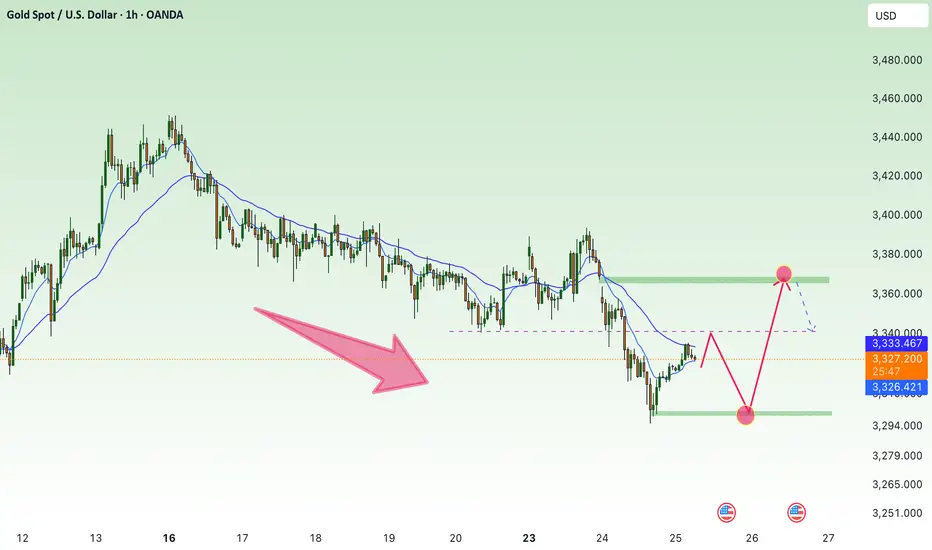
XAUUSD – Short-Term Decline, Long-Term Bullish AccumulationAfter a sharp drop of over 1,250 pips yesterday, gold reacted at the key demand zone around 3,300, where initial buying pressure has emerged. The chart still shows a valid short-term downtrend, but this area also aligns with the lower boundary of a long-term channel—previously a launch point for significant upward moves.
Currently, XAUUSD is consolidating below multiple unfilled Fair Value Gaps, awaiting a confirmed breakout toward the 3,361.500 region to potentially reverse the trend.
In terms of news, tensions in the Middle East escalated as the U.S. launched airstrikes on Iran’s nuclear facilities, triggering strong volatility in gold. Upcoming key U.S. economic data—including quarterly GDP and the Fed’s preferred inflation gauge, Core PCE—will play a crucial role in determining whether gold has the momentum to break out or remains in consolidation.
For now, the short-term bias remains bearish, but buyers are quietly accumulating strength for a potential long-term rally.
Gold price short term recovery 3366⭐️GOLDEN INFORMATION:
Kansas City Federal Reserve President Jeff Schmid stated on Wednesday that the central bank has sufficient time to assess the impact of tariffs on inflation before making any decisions regarding interest rates. His remarks suggest a cautious approach and align with Fed Chair Jerome Powell’s comments from the previous day.
Chair Powell reaffirmed the view that there is no urgency to alter monetary policy, emphasizing a patient, data-driven approach as the Fed monitors economic developments. This less dovish tone from Fed leadership may help cap downside pressure on gold in the near term.
Meanwhile, money markets are fully pricing in two rate cuts by the end of 2025, with a September move seen as more probable than one in July—although expectations for a July cut have slightly increased since last week.
⭐️Personal comments NOVA:
Gold price recovered and continued to accumulate, pay attention to the GAP 3366 area at the beginning of the week, selling pressure is still maintained.
⭐️SET UP GOLD PRICE:
🔥SELL GOLD zone: 3366- 3368 SL 3373
TP1: $3358
TP2: $3345
TP3: $3330
🔥BUY GOLD zone: $3303-$3301 SL $3296
TP1: $3315
TP2: $3328
TP3: $3340
⭐️Technical analysis:
Based on technical indicators EMA 34, EMA89 and support resistance areas to set up a reasonable BUY order.
⭐️NOTE:
Note: Nova wishes traders to manage their capital well
- take the number of lots that match your capital
- Takeprofit equal to 4-6% of capital account
- Stoplose equal to 2-3% of capital account
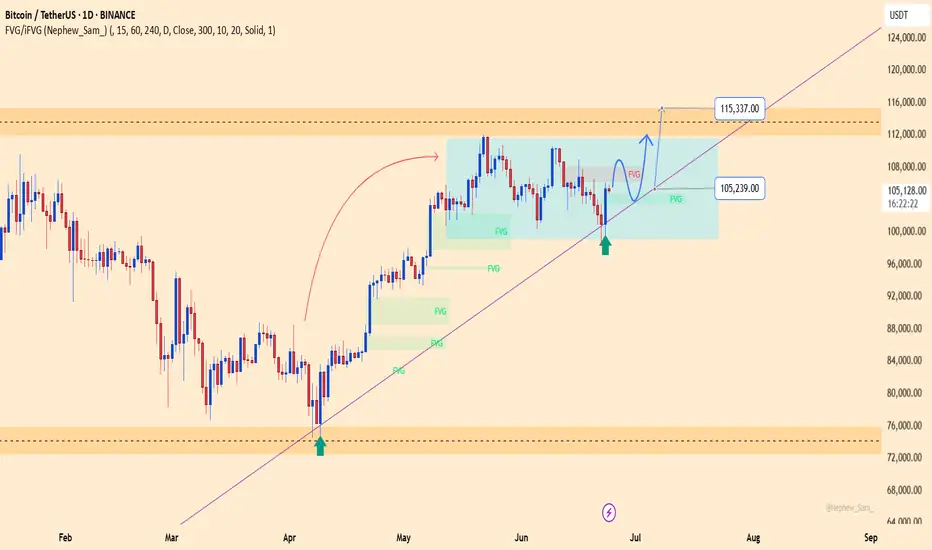
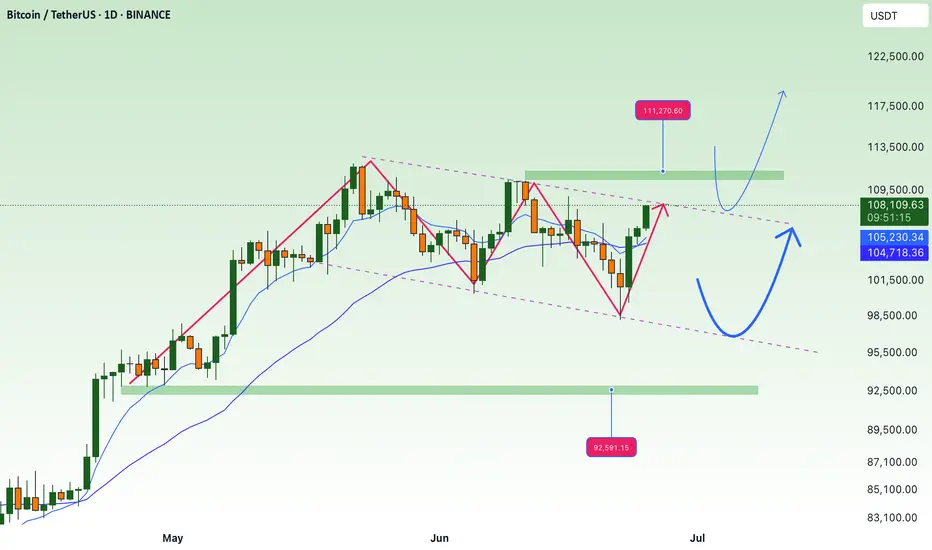
BTCUSDT – Rebound from trendline, targeting 115,300On the daily chart, BTCUSDT has bounced from a confluence support zone around 105,200, where the rising trendline meets the FVG, confirming that the bullish structure remains intact. The current price pattern suggests a continuation of the uptrend, with a short-term target at the 115,300 resistance zone — a level that has previously rejected price multiple times.
If this level is broken, momentum could extend toward the 120,000 area in the medium term. As long as the price holds above the trendline, the bullish outlook remains valid.
On the news front, market sentiment is improving as Bitcoin spot ETFs in the U.S. show signs of renewed inflows, coupled with growing expectations that the Fed might pause rate hikes due to recent signs of economic weakness.