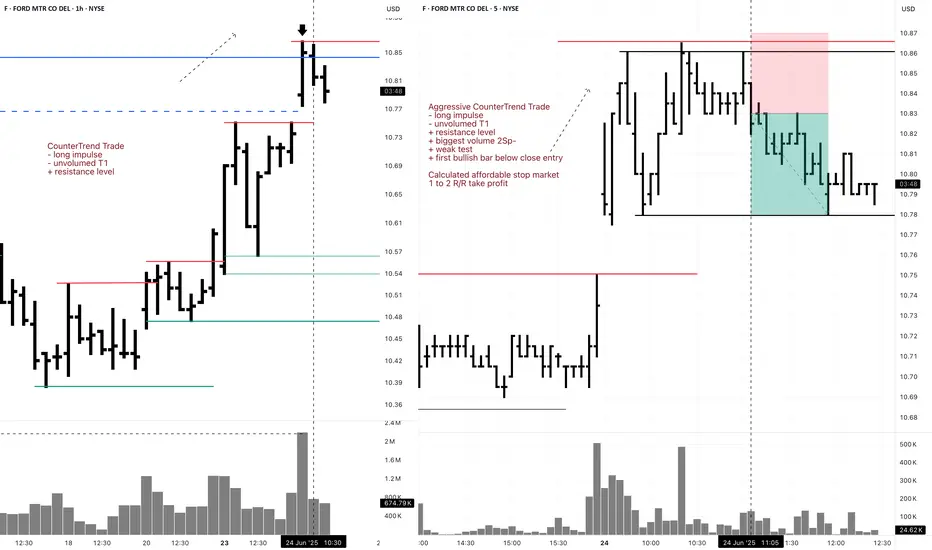
F 5M Long Daytrade Aggressive CounterTrend TradeAggressive CounterTrend Trade
- long impulse
- unvolumed T1
+ resistance level
+ biggest volume 2Sp-
+ weak test
+ first bullish bar below close entry
Calculated affordable stop market
T2 5M take profit
1H CounterTrend
"- long impulse
- unvolumed T1
+ resistance level"
1D CounterTrend
"- long impulse
- unvolumed T1
+ resistance level"
1M CounterTrend
"+ short impulse
- exhaustion volume
+ T2 level
+ resistance level
- unvolumed interaction bar
- reaction bar looks to close bullish in 6 days"
1Y CounterTrend
"+ long impulse
+ volumed T2 level
+ volumed 2Sp+
+ 1/2 correction
+ weak test"
Longsetup
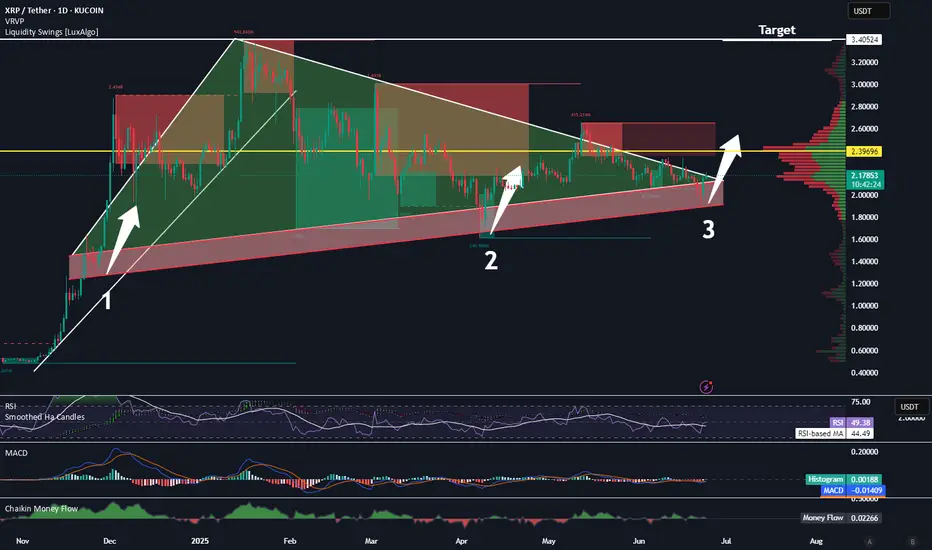
XRP About to Break Out! 3.40 Target.Trading Fam,
It's really this simple. This is a bullish triangle. Three hits in the premium buy zone (bottom of the triangle) and we're done. Once we break, there will be some resistance at that VRVP PoC (2.39) and then we're gone. 3.40 is an easy target.
Stew
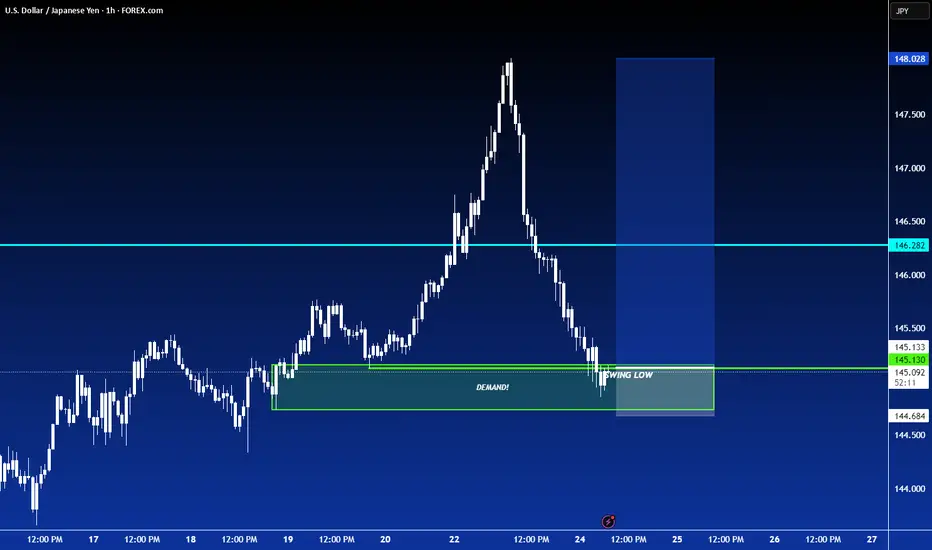
LONG ON USD/JPYLong on UJ
- Price is respecting a major demand zone after a break and retest
- DXY (Dollar) is bullish
- Yen Bearish
Hype's path to $55BYBIT:HYPEUSDT.P is currently forming a wedge shape pattern, is it indicating that it will break out and follow Path A, the blue path? I'm not so sure, I am sure we'll hit $55 either way.
If we take the red path, Path B, we'll come down to some heaviy support which could give us the fuel needed to get to $55
Out of all of the oscillators I was using, all except the chop zone on the daily mind you, were in bearish mode. So logically one would choose the red Path B right?
I can't wait to see how this plays out, shall we dip some and buy some more BYBIT:HYPEUSDT.P on Path B or experience more of a continuation of the current trendline to $55?
Let me know what you think in the comments, that'ls all for today, let's go HYPE!!! straight to $55!

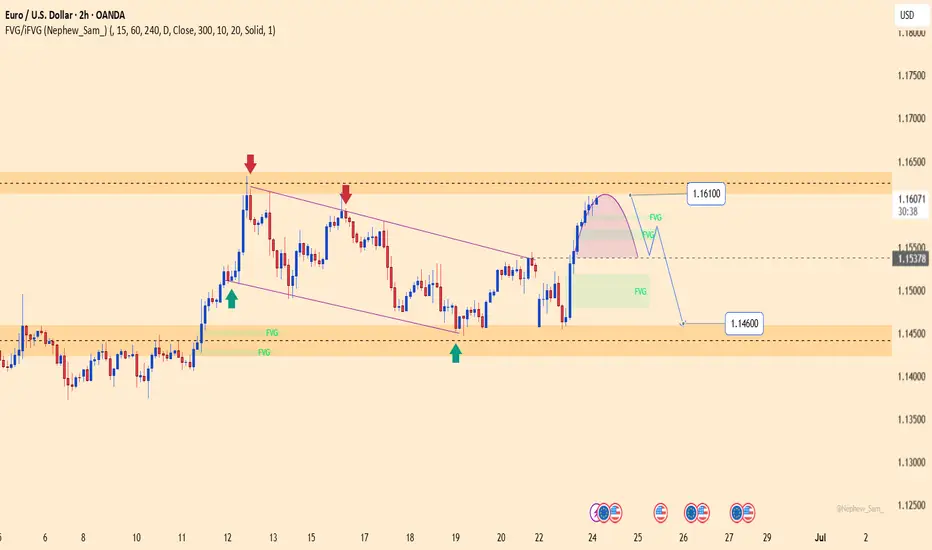
EURUSD – Rejected at 1.16100, bearish pressure re-emergingEURUSD has just completed a technical rebound toward the 1.16100 resistance zone, which has previously rejected price multiple times. The current structure suggests a mild reversal, with a potential pullback toward 1.15378. A break below this support could extend the decline toward 1.14600.
Recent upside momentum came mainly from temporary USD weakness, but the greenback remains supported by expectations that the Fed will keep interest rates elevated, while Eurozone PMI data continues to disappoint.
In summary, 1.16100 remains a key resistance level. If price shows clear rejection here, EURUSD may be poised for a deeper correction in the short term.
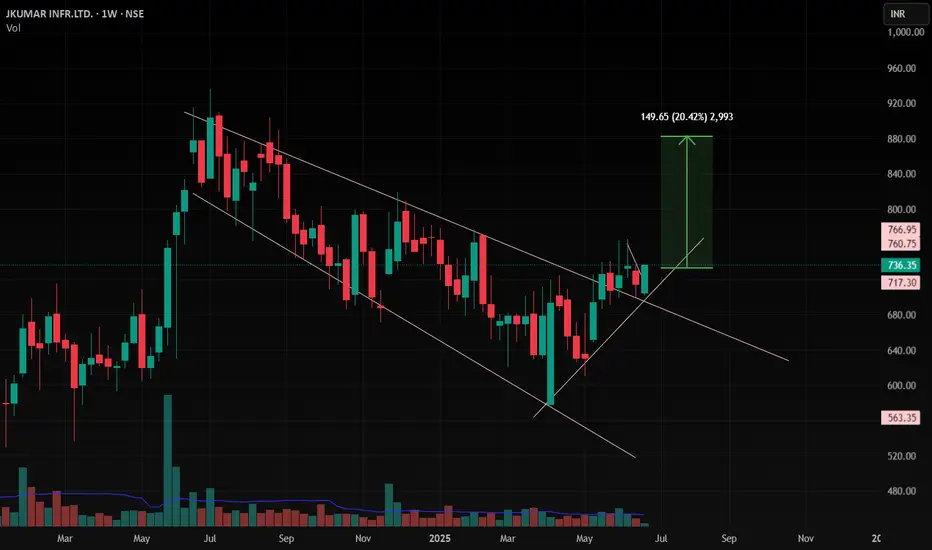
JKIL , Bullish A Very Good Pattern Breakout and come at Retest of Upper Trendline , and at Retest in 1D and Weekly supporting 20 EMA and Sustaining Above that , so we can Expect A Bullish Move in this Stock , As Nifty also giving good bullish move .
Follow for more Swing Ideas Like this
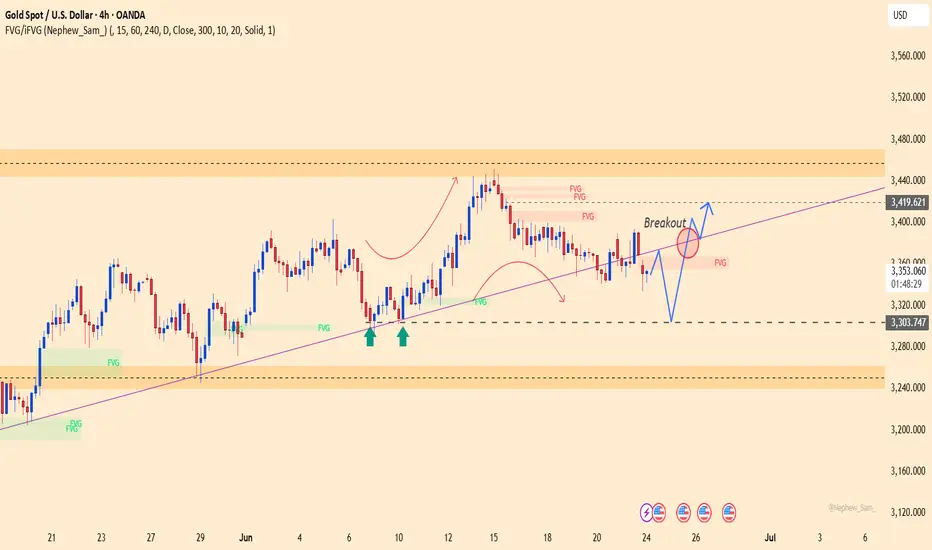
XAUUSD – Holding Support, Potential Rebound in SightOn the H4 chart, gold recently dropped over 1,250 pips, but is now showing signs of stabilizing around the key support zone at 3,303 USD. Although price temporarily broke below the ascending trendline, current price action suggests a possible false breakout. If support holds, a rebound toward the 3,418 USD resistance – aligning with the previous trendline and an unfilled FVG – becomes likely.
Yesterday’s decline was largely triggered by news that the U.S. carried out airstrikes on Iranian nuclear sites, boosting the USD and pressuring gold. However, the broader market remains sensitive, with traders awaiting crucial U.S. data – including Q1 GDP and Core PCE, the Fed’s preferred inflation gauge.
If these upcoming releases signal economic slowdown or easing inflation, gold may regain upside momentum. As long as 3,303 USD holds, the technical structure favors a short-term bullish scenario.
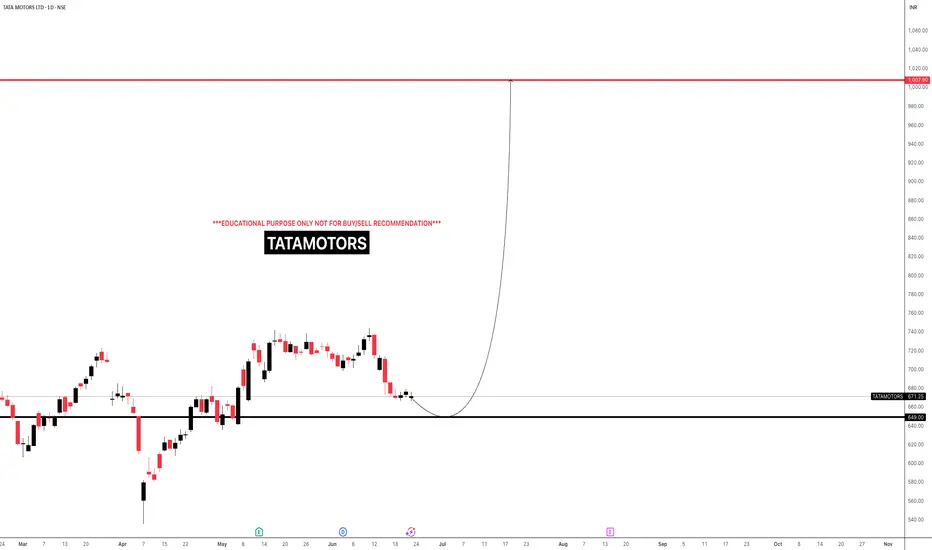
TATAMOTORSi Observed these Levels based on Price Action and Demand & Supply which is my own Concept "PENDAM CONCEPTS"... Please don't take any trades based on this chart/post... Because this chart is for educational purpose only not for Buy or Sell Recommendation... Thank Q
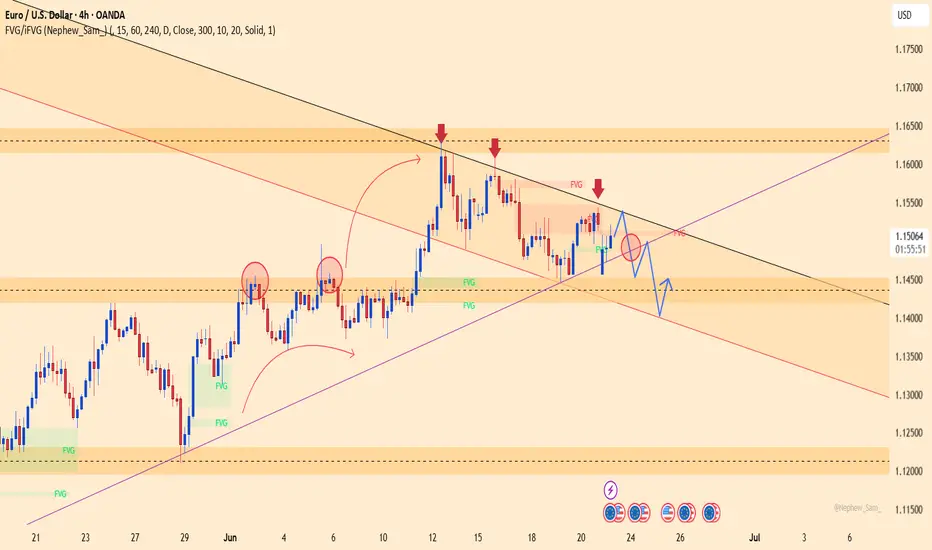
Euro – Eyes 1.15400, Awaits Powell's ToneEuro has just filled a GAP and rebounded strongly from the FVG zone around 1.14500. It is now approaching the 1.15400 resistance area, where a descending trendline intersects with a supply FVG. The bullish momentum remains intact within the short-term correction channel, but a rejection at this level could trigger a pullback.
On the news front, US Flash Manufacturing PMI is expected to decline, while Fed Chair Jerome Powell is set to testify this week. If he adopts a dovish tone, the USD may weaken further, potentially giving EURUSD the push it needs to break through resistance.
Strategy: Wait for a clear breakout above 1.15400 to confirm further upside. If rejected, watch the 1.14000 zone as a key support.
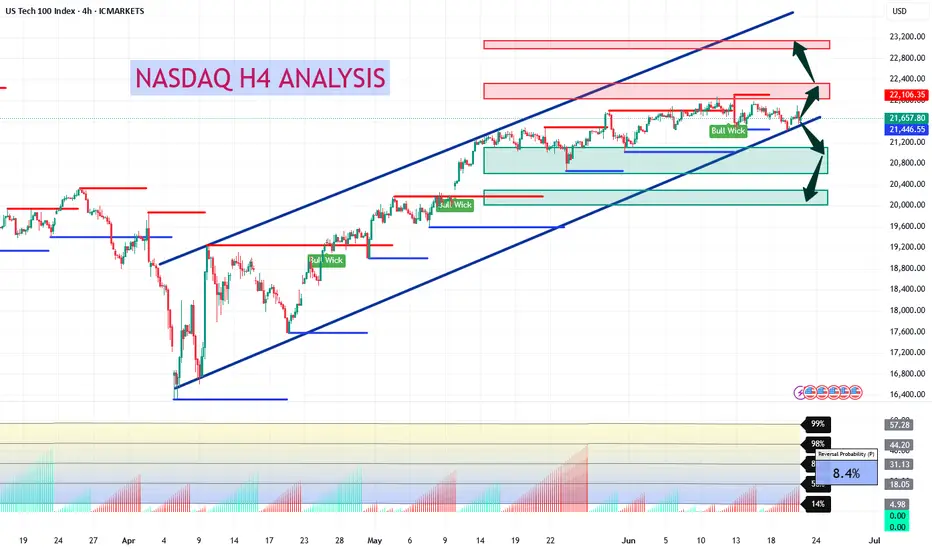
USTECH H4 AnalysisUSTECH Showing a bullish Flag. If it breaks this zone above, Most probably can fly up to 22,106.35 and higher TO 23,200. If no, Can rally between 20,800, 20,400 or even lower. Trading Analysis from 23-06-25 to 27-06-25. Take your risk under control and wait for market to break support or resistance on smaller time frame. Best of luck everyone and happy trading.🤗
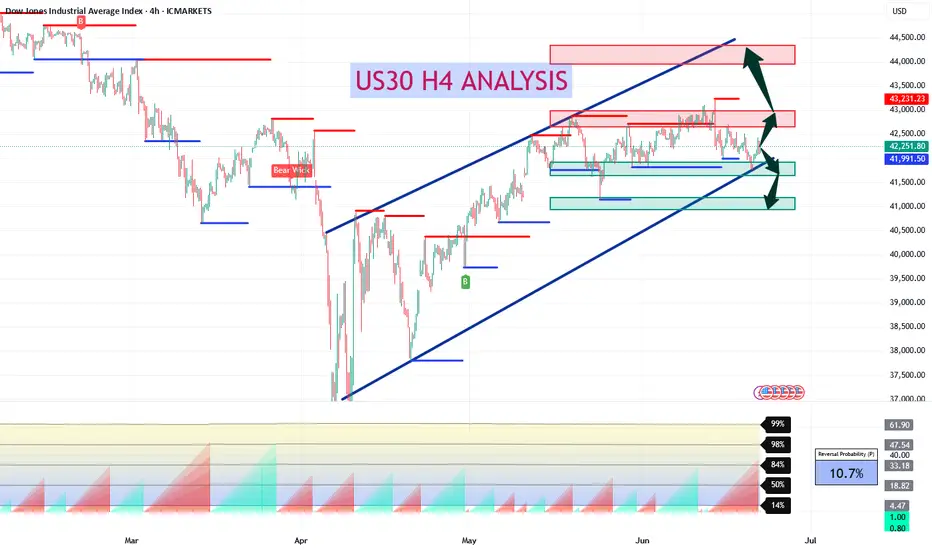
US30 H4 AnalysisUS30 Showing a bullish Flag to 42,762. If it breaks this zone, Most probably can fly upto 44,000 and higher. Trading Analysis from 23-06-25 to 27-06-25. Take your risk under control and wait for market to break support or resistance on smaller time frame. Best of luck everyone and happy trading.🤗
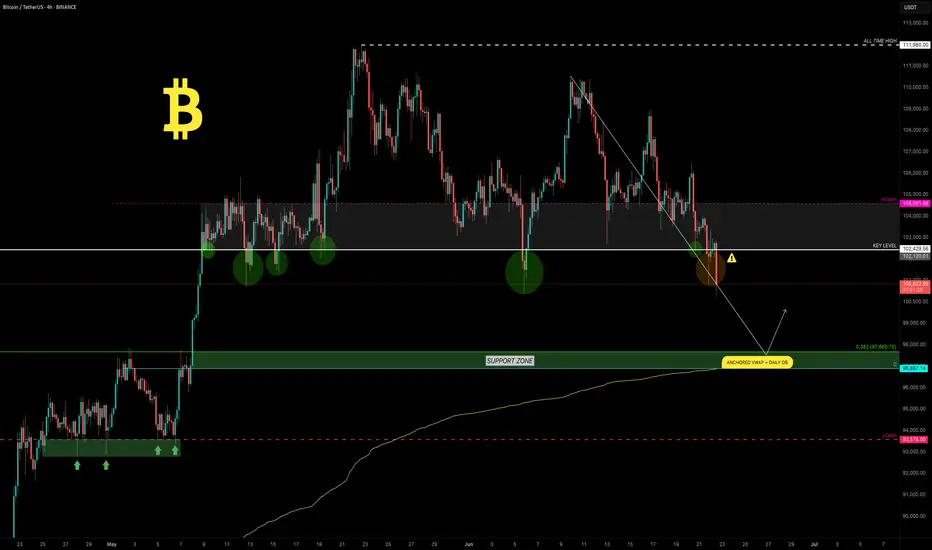
BTC Loses Key Level — Will 100K Hold or Fold?Bitcoin has been locked in a range for the past 45 days, clinging above the critical psychological support at $100K. But cracks are starting to show…
Every bounce from the key level at $102,430 has been weakening — and now, for the first time, we’re breaking cleanly below it. Things are starting to tilt bearish.
So the question is…
⛏️ Will 100K be tested next?
🔍 Key Support Zone: $97.7K–$96.9K
Using the Fibonacci retracement from the swing low at $74.5K to the recent ATH, the 0.382 retracement lands at $97,655 — just below the $100K mark.
But there’s more…
Here’s why the zone between $97.7K and $96.9K is crucial:
0.382 Fibonacci retracement: A common pullback level in strong uptrends.
Anchored VWAP from $74.5K: Currently sitting around $96.9K, tracking cumulative volume-weighted average price — a key level.
Daily Order Block: Sits right at $96,887, aligning with the VWAP and reinforcing the area as demand-rich.
1.272 Fibonacci extension: From the previous move — providing another layer of confluence.
Fair Value Gap (FVG): The imbalance lies right in this zone. Price often fills these before continuing trend.
All of this stacks up to a high-probability long setup.
🕵️♂️ What to Do Now?
Set alerts at $100K and watch for a reaction. If price slices through, shift focus to the 0.382 Fib — monitor price action closely for signs of a reversal.
The first clean test of this zone could present a solid long — but as usual don’t trade blindly. Wait for confirmation.
_________________________________
💬 If you found this helpful, drop a like and comment!
Want breakdowns of other charts? Leave your requests below.
BTC pressure, price under a lot of selling pressure💎 Update Plan BTC weekend (June 22)
Notable news about BTC:
Market overview: Bitcoin's consolidation lasts in the context of increasing macro instability
US President Donald Trump expressed his caution on Thursday when he delayed the decision involving a potential direct attack on Iran for a maximum of two weeks. The global market, including cryptocurrencies, has reacted, slightly increased in Asian and European sessions when investors absorb the impact of crude oil prices in the context of interrupted transport routes.
However, traders are very cautious, reflecting the tough stance of Fed President Jerome Powell on the economy, with the reason for the expectation of inflation in the short term due to tariffs.
Bitcoin -large holders continue to accumulate despite the cautious attitudes of traders on the spot and derivative markets.
Technical analysis angle
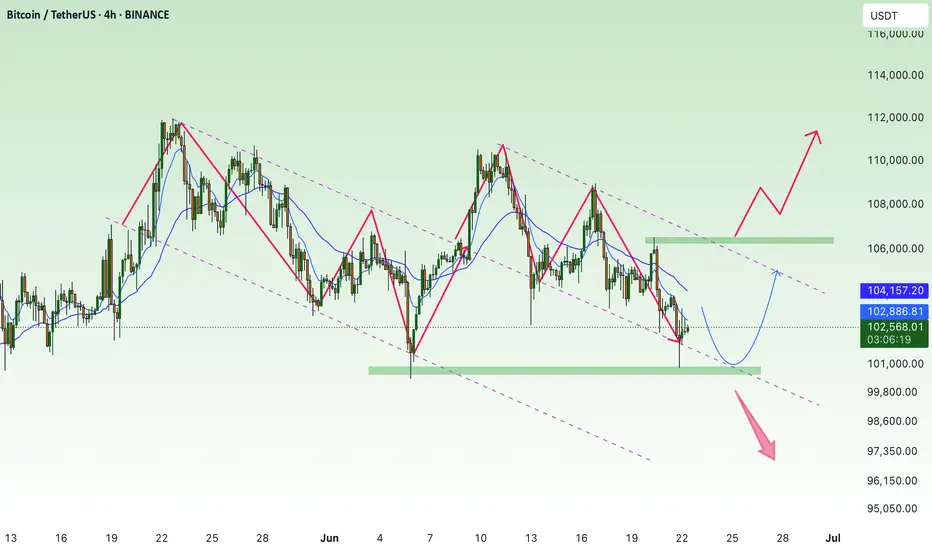
Bitcoin price fluctuates around $ 104.057 after cutting up the day from the peak of $ 106,457 of Friday. Main technical indicators, such as relative power index (RSI), strengthen the trend of discounts when the price slip down the average line 50.
Money Flow Index (MFI) indicator, monitoring the amount of money poured into BTC, shortening the trend of increasing, stable around the middle line. This reflects the limited interest in Bitcoin on both spot markets and derivative markets.
If the weakness of the Organizing Committee overshadows the demand on the chain and network activity, supporting the exponent dynamic line (EMA) 50 days at $ 103,169 can be helpful, temporarily absorbing the pressure of selling. Overcoming this level, high fluctuations can accelerate the decline, bringing the main levels, such as EMA 100 days at $ 99,085 and EMA 200 days at $ 93,404, in.
==> Comments for trend reference. Wishing investors successfully trading
Middle East War - Gold Price Increases✍️ NOVA hello everyone, Let's comment on gold price next week from 06/23/2025 - 06/27/2025
⭐️GOLDEN INFORMATION:
Gold prices held steady on Friday, hovering near $3,369 and on track to post a weekly loss of nearly 1.90%, as markets digested US President Donald Trump’s decision to forgo immediate military action against Iran in favor of a diplomatic approach. At the time of writing, XAU/USD is down 0.11%.
While easing geopolitical tensions helped lift risk sentiment, additional pressure on gold emerged from concerns over potential US restrictions on allies operating semiconductor plants in China, as reported by Bloomberg. Trump's restraint on Iran encouraged a risk-on tone, weighing on the appeal of the safe-haven metal.
⭐️Personal comments NOVA:
Middle East tensions escalate, gold prices continue to recover above 3400, early next week
🔥 Technically:
Based on the resistance and support areas of the gold price according to the H4 frame, NOVA identifies the important key areas as follows:
Resistance: $3395, $3448
Support: $3302, $3256
🔥 NOTE:
Note: Nova wishes traders to manage their capital well
- take the number of lots that match your capital
- Takeprofit equal to 4-6% of capital account
- Stoplose equal to 2-3% of capital account
- The winner is the one who sticks with the market the longest
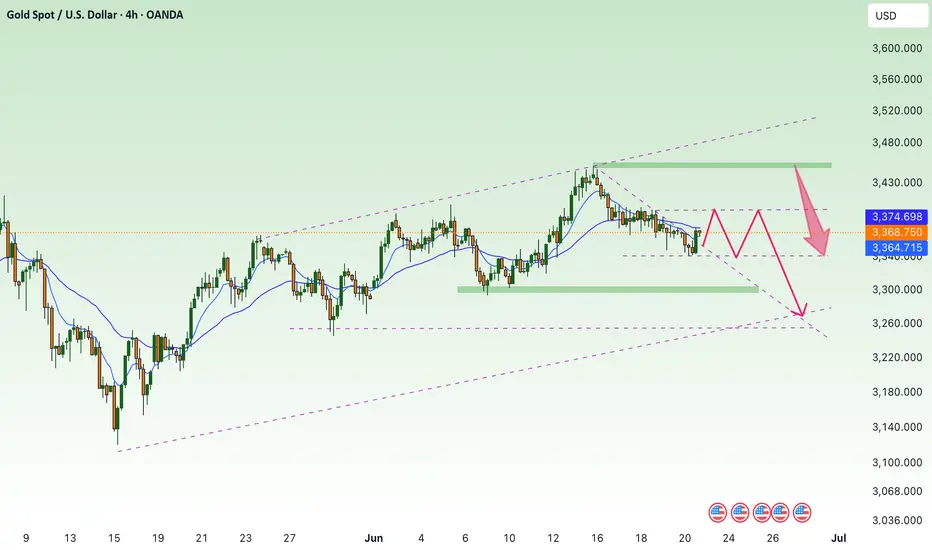
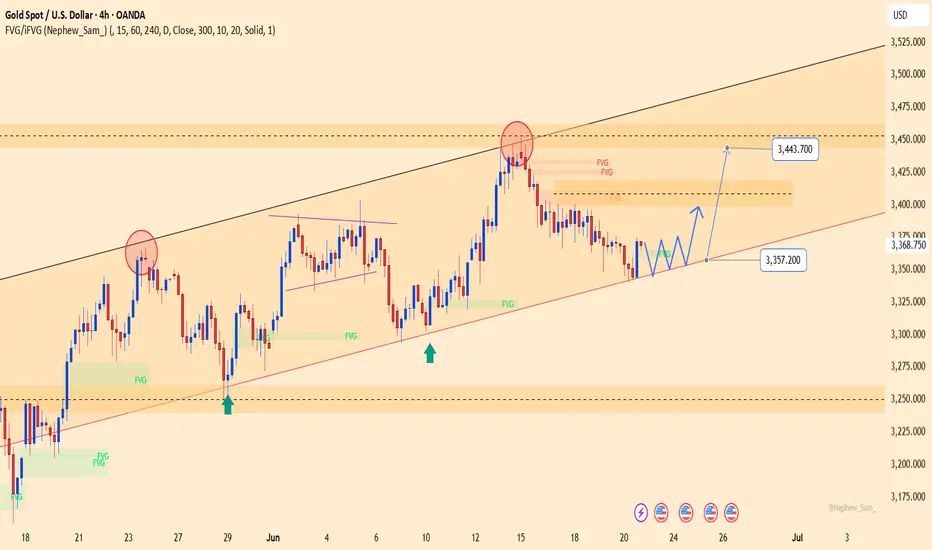
XAUUSD – Weak consolidation near 3,357, eyes on 3,443 retestYesterday, gold traded within the 3,344 to 3,371 USD range and closed at 3,368.75 USD (+0.72%). Despite the slight rebound, price action remains weakly consolidative within a broad ascending channel, repeatedly rejected at the 3,443 USD resistance area — where multiple FVGs (Fair Value Gaps) remain unfilled.
On the H4 chart, price is holding above the key confluence support at 3,357 USD, which aligns with the medium-term ascending trendline. If this level holds, a technical bounce back toward 3,443 USD is likely.
However, it's worth noting that recent upward moves have lost momentum near the upper FVG zones. Traders should wait for a clear confirmation signal — particularly a strong bullish candle at the current support — before considering entry.
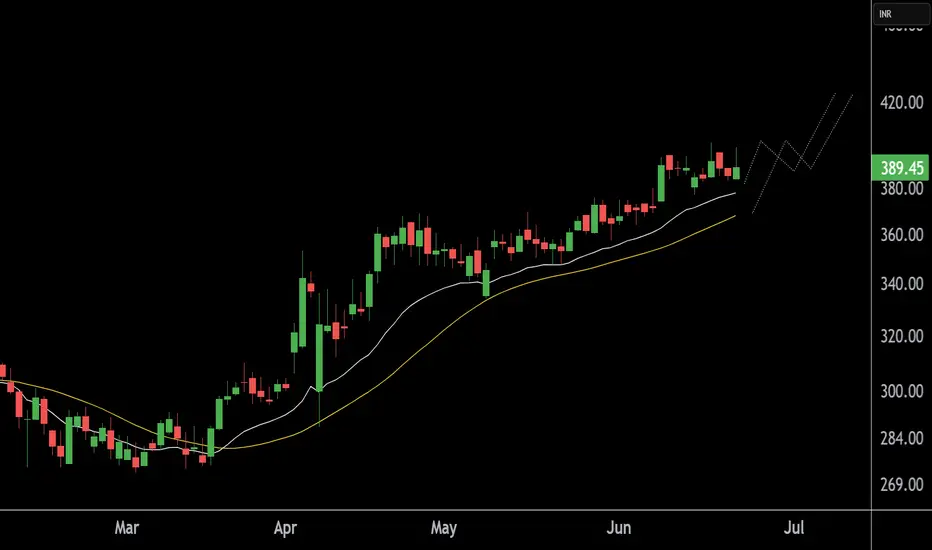
CSBBANK at Best Support !!This is the Daily Chart of CSBBANK.
CSBBANK is currently showing momentum while taking support from the EMA and SMA at 380 and 368 range.
If this level is sustain , then We may see higher prices in CSBBANK
Thank You !!
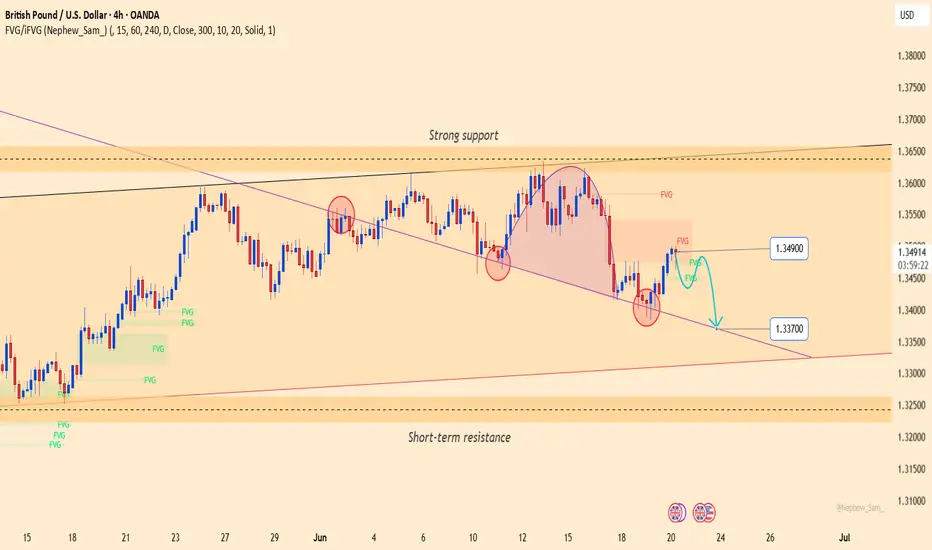
GBPUSD: Bearish pressure persistsGBPUSD is consolidating below a key medium-term resistance zone, with a rounding top and a minor head-and-shoulders pattern forming. The price is currently retesting the Fair Value Gap near 1.34900 — a potential reversal zone if it fails to break higher.
On the fundamental side, the Bank of England's decision to hold interest rates on June 19 disappointed the market. Meanwhile, the US dollar remains supported by safe-haven demand and the Federal Reserve’s hawkish tone, adding further pressure on GBP.
If GBPUSD fails to hold the trendline support near 1.33700, the risk of a deeper decline increases. Both the technical structure and macro fundamentals favor the bears.
$100 a barrel coming soon for Crude oil futures In this video we focus on the current accumulation in the oil chart and the prospect of higher prices ahead .
I highlight how the respect of the previous quinquennial pivots gave us a 45% move to the upside in the past 8 weeks .
Looking ahead on the monthly timeframe we have the following confluences above the current price of $75 .
Above the current pa we have the point of control at $ 88 and the avwap at $97, if we can reclaim the poc I think we will continue to push up to the fib levels that I have mentioned in the video.
In addition to the above we also have the decennial pivots at $107/$112 alongside the value area high .
All of this validates for me why oil will be pushing back up throughout the course of the year .
Tools used in the video
Tr pocket , pivots , fived range volume profile and fib expansion

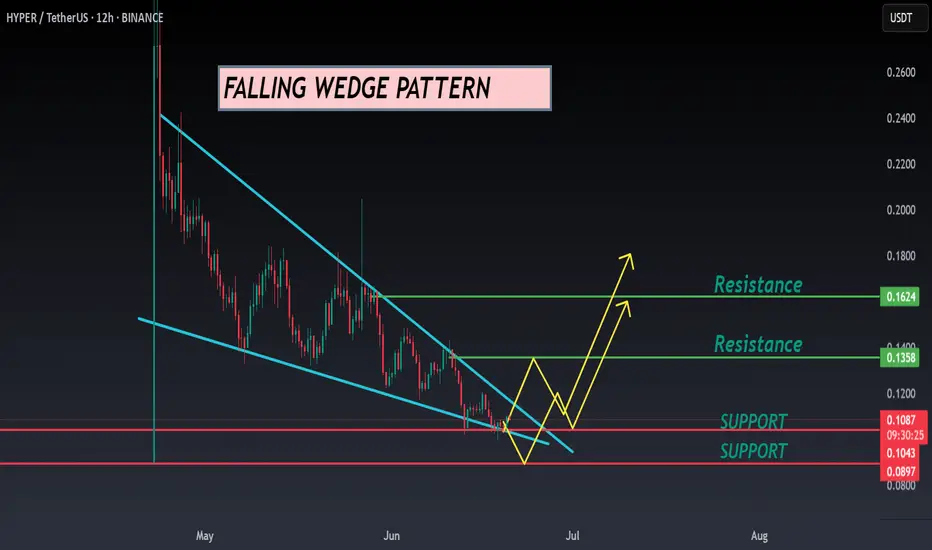
HYPER ANALYSIS🔮 #HYPER Analysis - Update 🚀🚀
💲 We can see that there is a formation of Falling Wedge Wedge Pattern in #HYPER and we can see a bullish movement after a good breakout. Before that we would see a little retest and and then a bullish movement.
💸Current Price -- $0.1087
📈Target Price -- $0.1358
⁉️ What to do?
- We have marked crucial levels in the chart . We can trade according to the chart and make some profits. 🚀💸
#HYPER #Cryptocurrency #Breakout #DYOR
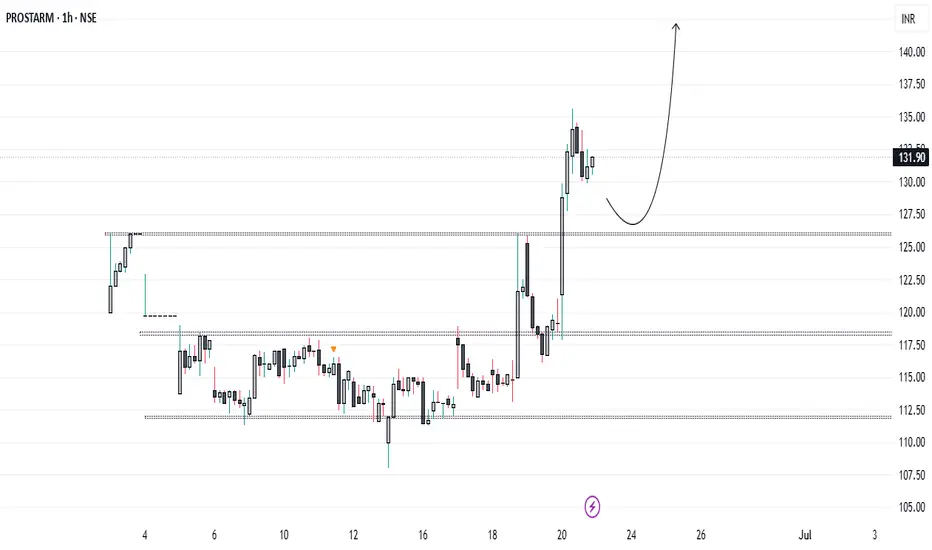
What’s Next for PROSTARM Investors...?Prostarm has decisively broken its all-time high. Since its IPO on June 3rd, it has successfully surpassed the major resistance level of 126 and is holding strong above it. We should take advantage of this opportunity and establish a long position on the retest of the 126 level.