Apple Near Key Support — Long Setup DevelopingIntroduction:
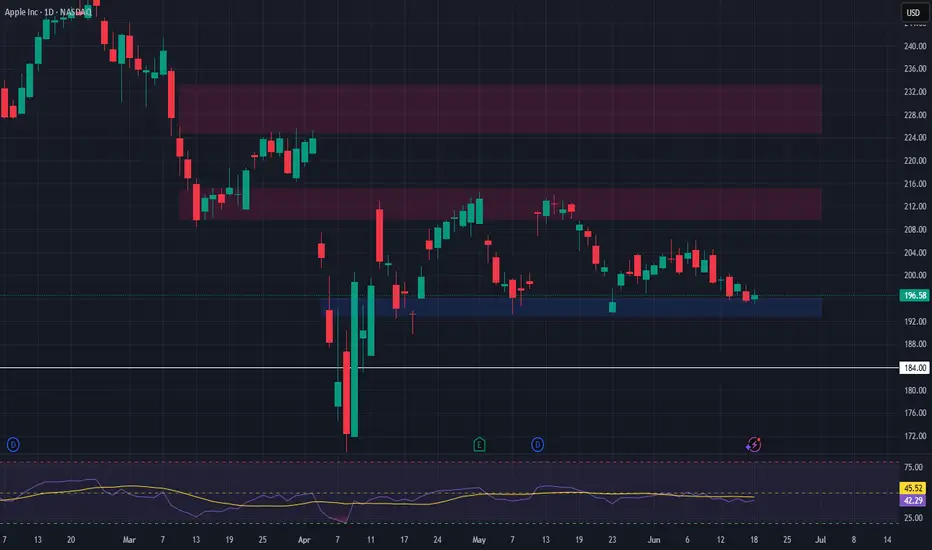
Apple NASDAQ:AAPL is approaching a critical support zone that has consistently held over the past two months. As price retraces toward this level, it presents a potential long opportunity for traders looking to position ahead of the next bullish leg.
Technical Setup:
Support Zone: $193 – $196
This area has acted as a strong demand zone, providing multiple bounce points since April.
Price is now pulling back into this region, offering a potential entry for a long trade.
Trade Idea:
Entry: $193 – $196 (on confirmation of support holding)
Take Profit Targets:
First Target: $210 – $215
Second Target: $225 – $233
Stop Loss: Just below $184 (to protect against a breakdown from support)
#AAPL #Apple #Stocks #TechnicalAnalysis #SupportZone #LongSetup #TradingStrategy #NASDAQ #TechStocks #RiskReward
Longsetup
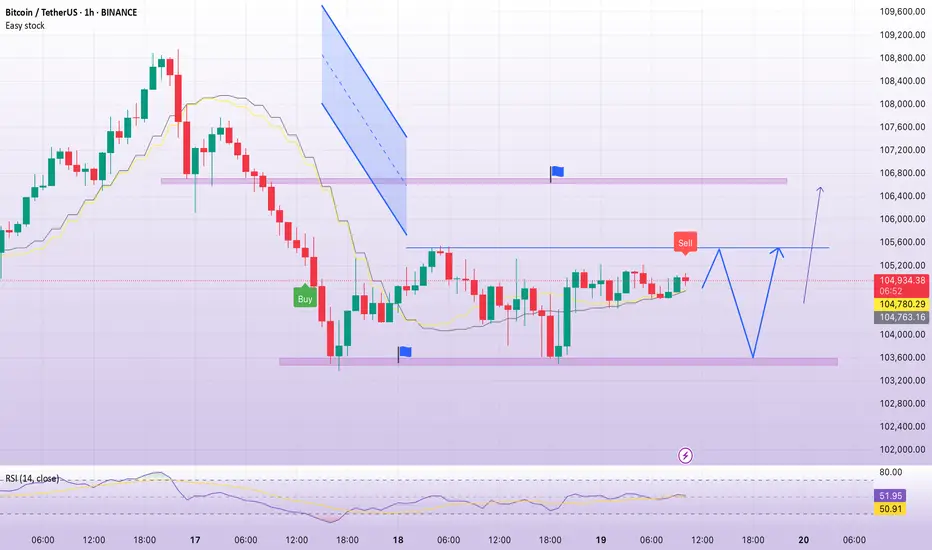
BTC continues to accumulate above 103,500Plan BTC today: 19 June 2025
Related Information:!!!
Bitcoin (BTC) price edges slightly higher, trading near $104,700 at the time of writing on Thursday, after stabilizing above a key level — the 50-day Exponential Moving Average (EMA) at $103,100. A breach below this level could trigger a sharp fall in BTC. Risk aversion could intensify, as reports indicate that US officials are preparing for a strike on Iran in the coming days. Despite this risk-off sentiment in global markets, institutional demand remains strong, with US spot Bitcoin Exchange Traded Funds (ETFs) seeing positive inflows for eight consecutive days
personal opinion:!!!
btc continues to accumulate above 103,500, the market is no longer sensitive to interest rate information yesterday
Important price zone to consider :!!!
support zone : 103.500 \ 101.000
Sustainable trading to beat the market
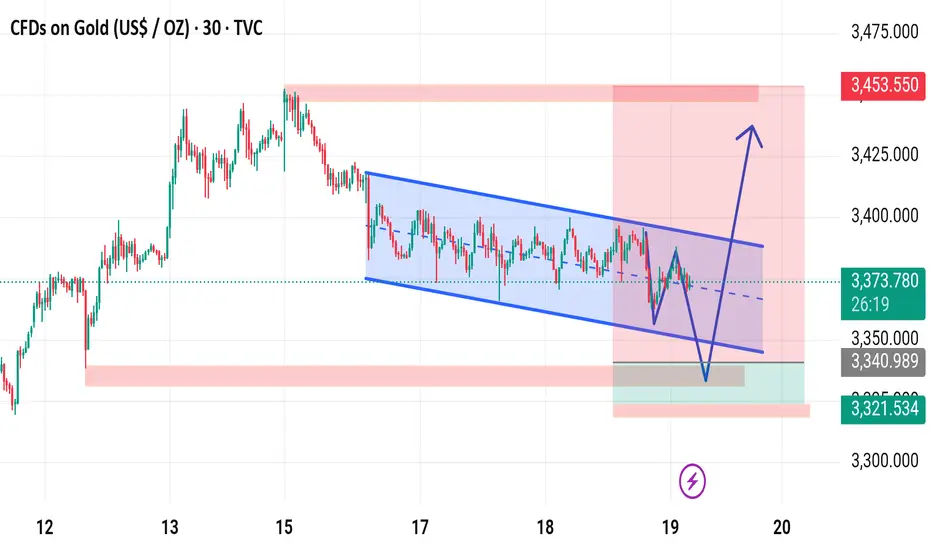
XAUUSD MARKET UPDATE 19 - 06 - 2025This chart presents a technical analysis of Gold CFDs (XAU/USD) on the 30-minute timeframe. Here's a breakdown of the key elements:
Chart Structure & Patterns:
Descending Channel: Price has been consolidating in a downward-sloping channel (marked in blue).
Projected Move: The sketch on the chart shows a potential false breakdown below the channel support, followed by a strong bullish reversal.
Support Zone: Around $3,321.534 to $3,341, highlighted in green/red — this is the expected reversal zone.
Resistance/Target Zone: A sharp upward arrow suggests the price could move towards the $3,453.550 area, the previous high and a key resistance.
Current Price:
$3,373.133 (as per the chart), sitting near the middle of the channel.
Analysis Summary:
This is a bullish setup expecting:
1. A dip to retest or fake out below the channel.
2. Reversal from the demand zone (highlighted green).
3. Breakout from the descending channel leading to a strong rally.
Invalidation likely occurs below $3,321.
Trade Idea (based on the chart):
Buy near: $3,340–$3,325
Stop loss: Below $3,321
Target: $3,440–$3,453
Would you like a written trading plan or risk management breakdown for this idea?
RELIANCE INFRASTRUCTU - Bullish Flag & Pole Breakout (Daily T/F)Trade Setup
📌 Stock: RELIANCE INFRASTRUCTU ( NSE:RELINFRA )
📌 Trend: Strong Bullish Momentum
📌 Risk-Reward Ratio: 1:3 (Favorable)
🎯 Entry Zone: ₹385.00 (Breakout Confirmation)
🛑 Stop Loss: ₹293 (Daily Closing Basis) (-23 % Risk)
🎯 Target Levels:
₹412.50
₹441.95
₹472.55
₹506.05
₹542.30
₹580.65
₹616.10
₹654.00 (Final Target)
Technical Rationale
✅ Bullish Flag & Pole Breakout - Classic bullish pattern confirming uptrend continuation
✅ Strong Momentum - Daily RSI > 60, Weekly RSI >60 Monthly rsi >60
✅ Volume Confirmation - Breakout volume 2.73M vs previous day's 2.69M
✅ Multi-Timeframe Alignment - Daily and weekly charts showing strength
Key Observations
• The breakout comes with significantly higher volume, validating strength
• Well-defined pattern with clear price & volume breakout
• Conservative stop loss at recent swing low
Trade Management Strategy
• Consider partial profit booking at each target level
• Move stop loss to breakeven after Target 1 is achieved
• Trail stop loss to protect profits as price progresses
Disclaimer ⚠️
This analysis is strictly for educational purposes and should not be construed as financial advice. Trading in equities involves substantial risk of capital loss. Past performance is not indicative of future results. Always conduct your own research, consider your risk appetite, and consult a financial advisor before making any investment decisions. The author assumes no responsibility for any trading outcomes based on this information.
What do you think? Are you watching NSE:RELINFRA for this breakout opportunity? Share your views in the comments!

XAUUSD – Support Under Threat, Deeper Decline LoomsGold is stalling below the 3,444 USD resistance, forming a series of lower highs — a clear sign of weakening bullish momentum. The support area around 3,358 USD is under pressure, and a break below this level could trigger a drop toward 3,280 USD.
On the news front, the FOMC has reaffirmed its hawkish stance, making no mention of a rate cut despite signs of slowing economic growth. This has strengthened the USD, placing additional downward pressure on gold.
In summary, XAUUSD is on the verge of breaking its bullish structure. If current support fails, sellers may take full control of the market.
XAUUSD Trade Idea:
Position: SELL if price breaks below 3,358 USD
Target: 3,304 – 3,280 USD
Stop Loss: Above 3,400 USD
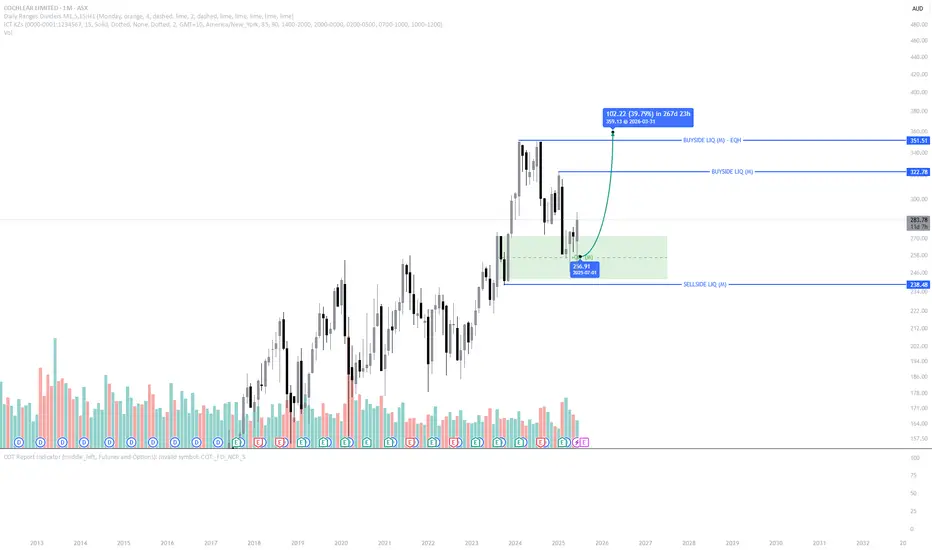
High Dividend Stock on the Move? COH – Eyes on 351.51 Cochlear Limited (ASX: COH) is showing strong bullish potential after price tapped into a respected Monthly Order Block (OB). This region aligns with a historically strong demand zone, offering a prime entry opportunity for longer-term investors and SMC traders alike.
From a Smart Money Concept (SMC) perspective, the structure remains bullish:
- Price swept a low into the Monthly OB, indicating engineered liquidity grab.
- The reaction shows strong displacement to the upside, validating the OB.
- Volume also suggests institutional interest at this level.
- There’s now a clean path toward Equal Highs at 351.51, a natural draw for buy-side liquidity.
With COH offering consistent dividend payouts, this could be a double win – capital appreciation + income.
🧠 As always: Do Your Own Research (DYOR).
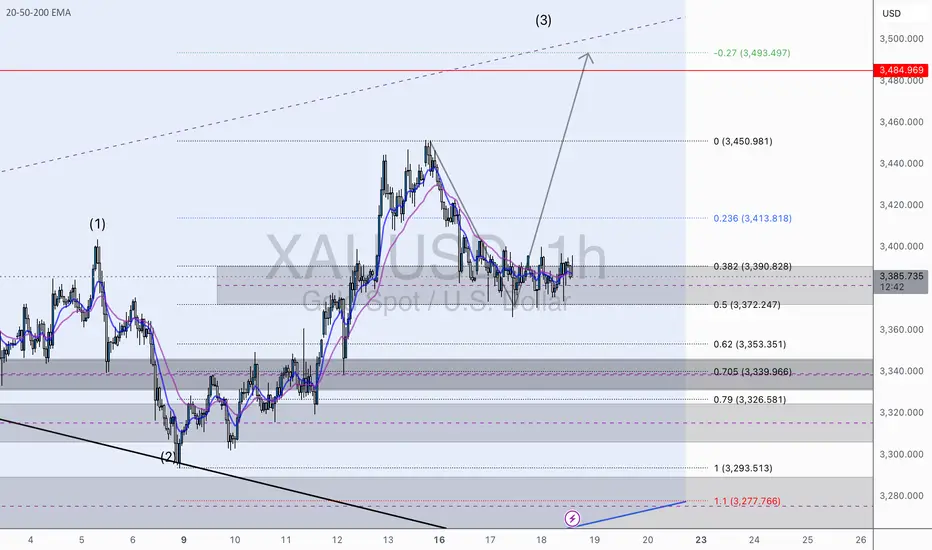
XAU/USD – Wave 3 in Motion?We’re currently monitoring what appears to be a textbook Elliott Wave 1-2 structure, with Wave (2) bottoming near $3,293. Price has since pushed up and consolidated above the 0.5–0.382 retracement zone, holding firm at key EMAs and structure.
🔍 Key Technical Highlights:
Wave (1): Clean impulsive structure.
Wave (2): Corrective decline finding strong support at $3,293.
Current consolidation suggests accumulation before potential Wave (3) breakout.
Confluence of Fib extensions & upper trendline project Wave (3) towards $3,484, aligning with the -0.27 extension.
🧠 What I’m Watching:
Break and retest of the $3,400–$3,415 level (0.236 Fib) to confirm bullish continuation.
Holding above $3,372–$3,390 (the golden pocket and 0.5/0.382 zone) is key to maintaining the bullish bias.
A clean break below $3,353 invalidates this immediate structure.
📈 Bias: Bullish
🎯 Next target: $3,484
⛔️ Invalidation: Break below $3,350
💬 Let me know your thoughts. Are we about to ride Wave 3, or will gold give us one more dip before lift off?
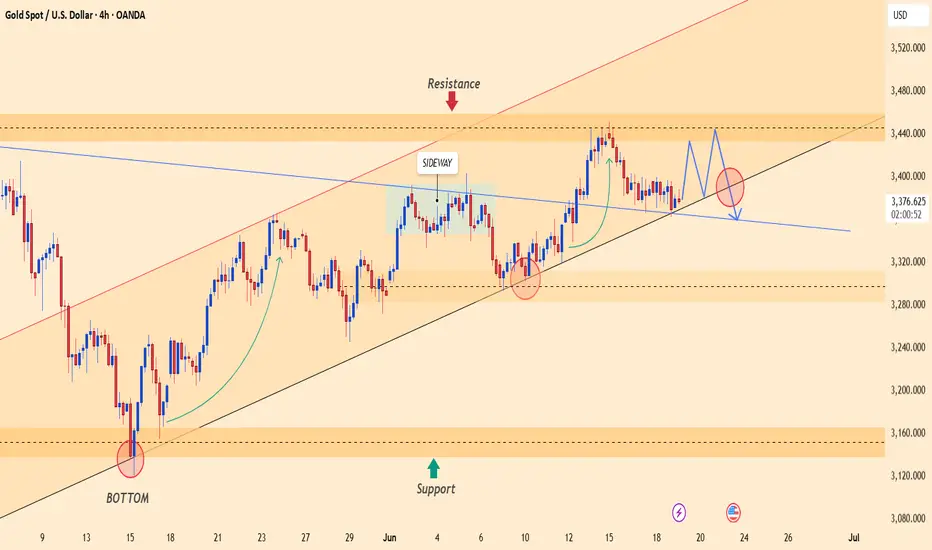
XAUUSD – Gold breaks trend: Is a deeper fall coming?Gold has officially broken the ascending trendline that had held since mid-May, confirming a breakdown in the bullish structure. After failing to breach the strong resistance at 3,445 USD, selling pressure intensified, driving the price down to 3,390 USD — yesterday’s closing level.
This move came right after the FOMC meeting, where the Fed held interest rates steady but maintained a hawkish tone, strengthening the USD and weighing heavily on gold.
While tensions in the Middle East continue to offer short-term support, U.S. monetary policy remains the dominant force. Without a fresh geopolitical shock, gold appears increasingly vulnerable to a deeper correction.
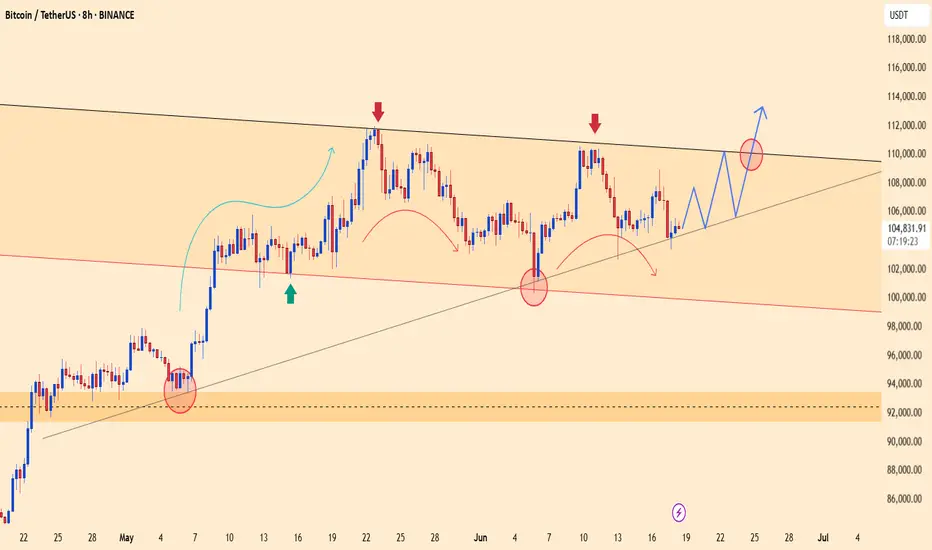
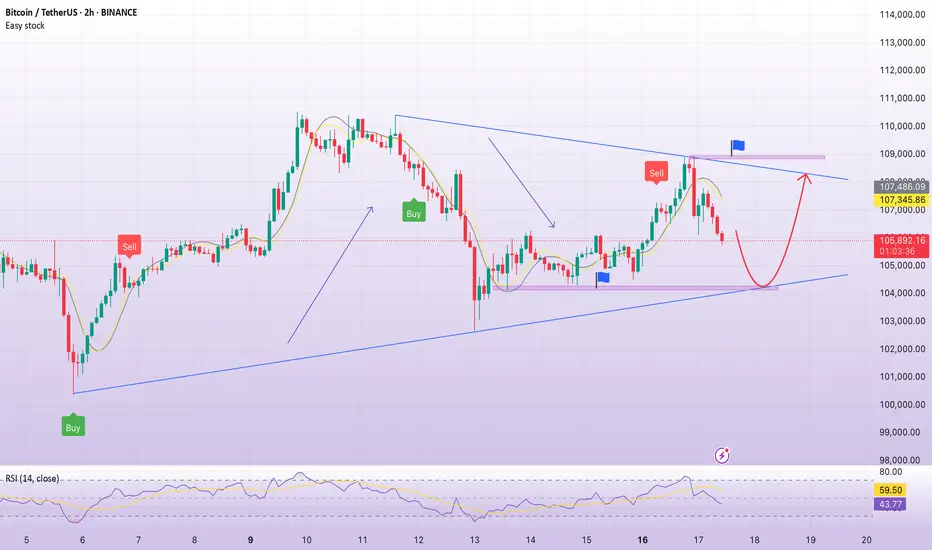
BTCUSDT – Price Poised to Break Descending ChannelBTCUSDT has been maintaining a series of higher lows since early May, consistently rebounding from its dynamic support trendline. Currently, the price is consolidating just below the descending channel resistance around the 108,000 USDT level. A clear double-bottom pattern accompanied by solid recovery momentum suggests a potential breakout from the prolonged correction phase that has persisted throughout June.
If BTC breaks above the descending trendline, the next target could be the major resistance zone near 113,000 USDT.
On the news front, the market is reacting positively to BlackRock’s announcement of expanding investment in crypto ETF products. At the same time, recent soft U.S. inflation data has strengthened expectations that the Fed may halt its tightening cycle. This combination is improving investor sentiment and driving renewed interest in risk assets like Bitcoin.
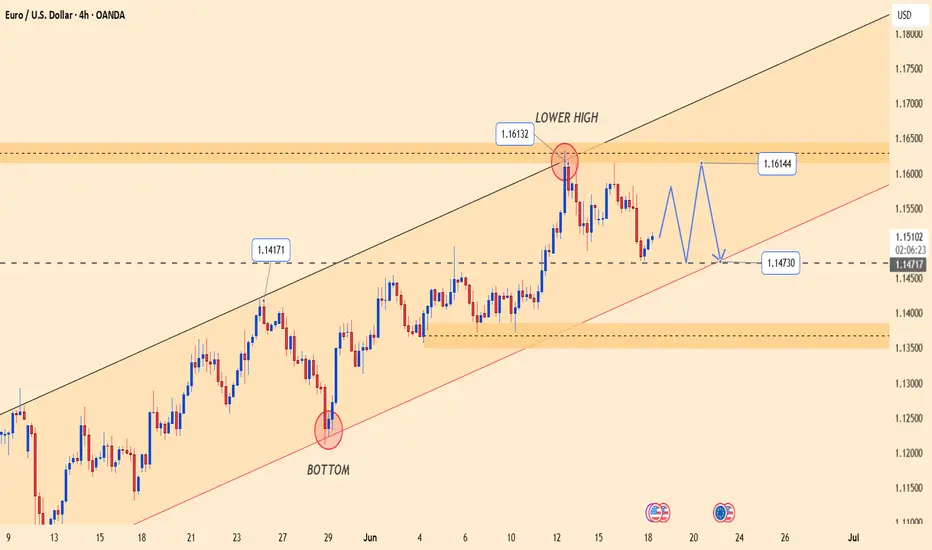
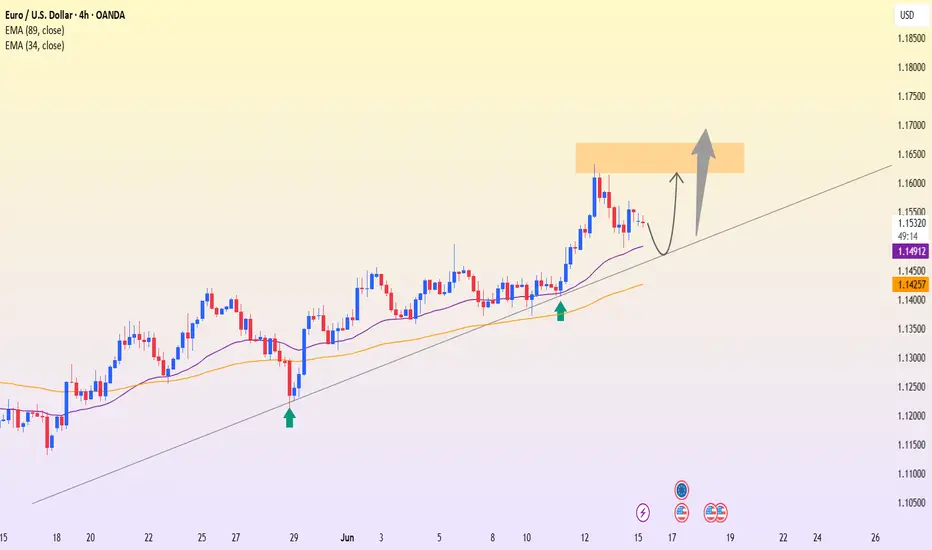
EURUSD – Bullish momentum fades, downside pressure intensifiesEURUSD formed a lower high near 1.1613, signaling weakening bullish momentum. Price is now testing a key trendline, and a break below 1.1473 could confirm a bearish move toward 1.1350.
Market sentiment is currently dominated by the Fed’s hawkish stance following the latest FOMC meeting, where the central bank kept rates unchanged but expressed readiness to hike further if necessary. Meanwhile, although tensions in the Middle East are escalating, they have yet to deliver a significant blow to the USD.
Given the current backdrop, EURUSD is under considerable pressure and may soon break its bullish structure unless strong buying interest re-emerges.
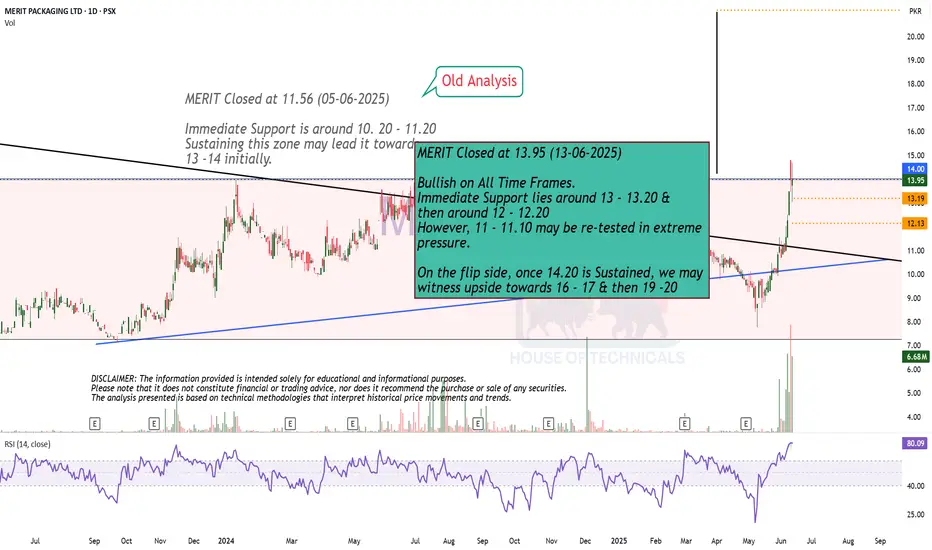
Bullish on All Time Frames.MERIT Closed at 13.95 (13-06-2025)
Bullish on All Time Frames.
Immediate Support lies around 13 - 13.20 &
then around 12 - 12.20
However, 11 - 11.10 may be re-tested in extreme
pressure.
On the flip side, once 14.20 is Sustained, we may
witness upside towards 16 - 17 & then 19 -20
Accumulate around 3400, Keep interest rate today⭐️GOLDEN INFORMATION:
Gold prices slipped below the $3,400 threshold on Tuesday, weighed down by renewed strength in the US Dollar (USD), despite a worsening global risk sentiment. The resilience of the greenback limited gains in the safe-haven asset, though mounting tensions between Israel and Iran continue to offer underlying support. At the time of writing, XAU/USD is trading at $3,380, down 0.05%.
Although risk appetite remains subdued, gold has struggled to rally, as the US Dollar regains ground. The US Dollar Index (DXY), which measures the currency against a basket of six major peers, climbed 0.46% to 98.58.
Meanwhile, geopolitical tensions intensified after US President Donald Trump abruptly departed the G7 summit in Canada on Monday in response to unfolding events in the Middle East. In a stark warning posted to his social platform, he urged, “Everyone should immediately evacuate Tehran,” signaling a sharp escalation in the conflict that began last Friday.
⭐️Personal comments NOVA:
Gold price is moving in accumulation zone below 3400 - 3365. Break and return above 3400, continue to accumulate.
⭐️SET UP GOLD PRICE:
🔥SELL GOLD zone: 3437- 3439 SL 3444
TP1: $3425
TP2: $3410
TP3: $3395
🔥BUY GOLD zone: $3338-$3340 SL $3333
TP1: $3346
TP2: $3355
TP3: $3370
⭐️Technical analysis:
Based on technical indicators EMA 34, EMA89 and support resistance areas to set up a reasonable BUY order.
⭐️NOTE:
Note: Nova wishes traders to manage their capital well
- take the number of lots that match your capital
- Takeprofit equal to 4-6% of capital account
- Stoplose equal to 2-3% of capital account
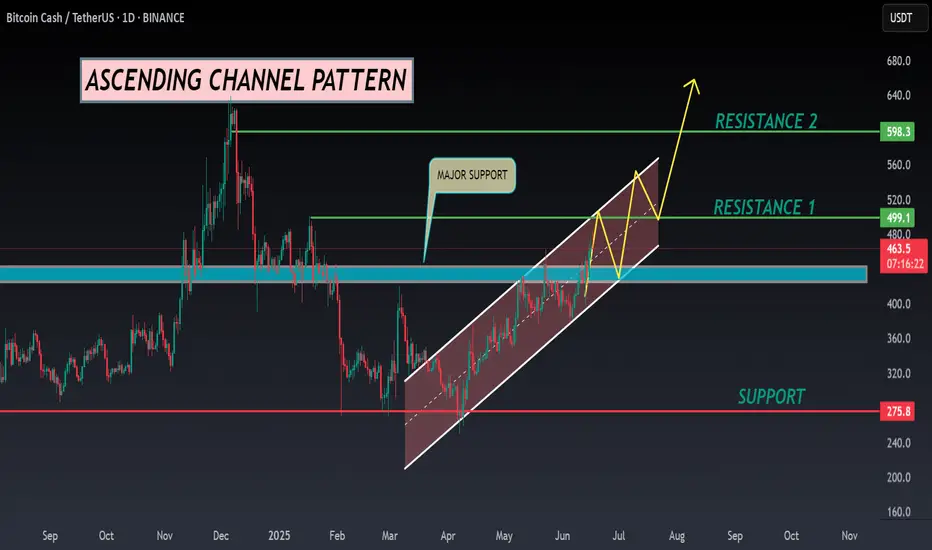
BCH ANALYSIS🔆#BCH Analysis : Channel Following ⛔️⛔️
As we can see that #BCH is following ascending channel on daily time frame. Also there is an instant resistance area. We can see a bullish formation here. And if it trade with good volume then we can see a proper bullish move in #BCH
🔖 Current Price: $463
⏳ Target Price: $598
⁉️ What to do?
- Keep your eyes on the chart, observe trading volume and stay accustom to market moves.🚀💸
#BCH #Cryptocurrency #ChartPattern #DYOR
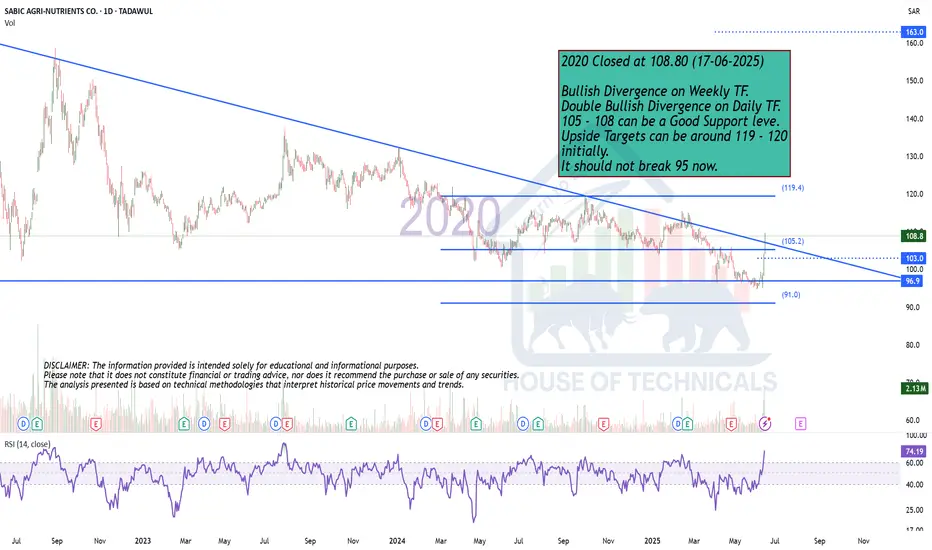
Bullish Divergence on Weekly TF.2020 Closed at 108.80 (17-06-2025)
Bullish Divergence on Weekly TF.
Double Bullish Divergence on Daily TF.
105 - 108 can be a Good Support leve.
Upside Targets can be around 119 - 120
initially.
It should not break 95 now.
Continue the uptrend, gold price returns to 3444⭐️GOLDEN INFORMATION:
Gold prices (XAU/USD) slipped for the second consecutive session on Tuesday, retreating from an early uptick during the Asian session that briefly pushed prices above the $3,400 mark. A slight rebound in the US Dollar (USD) continues to weigh on the precious metal, acting as a key drag. However, the downside appears limited amid escalating geopolitical tensions in the Middle East and growing market expectations that the Federal Reserve (Fed) will initiate further rate cuts in 2025.
Meanwhile, the ongoing aerial conflict between Israel and Iran has entered its fifth day, heightening fears of a wider regional escalation. This persistent geopolitical uncertainty is keeping demand for safe-haven assets like gold supported. Investors are also exercising caution ahead of the Federal Open Market Committee’s (FOMC) two-day policy meeting, the outcome of which may shape the next directional move for non-yielding bullion.
⭐️Personal comments NOVA:
Gold price takes liquidity from lower supports: completed 3385, 3373. short term downtrend break. Gold price will soon return above 3400.
⭐️SET UP GOLD PRICE:
🔥SELL GOLD zone: 3443- 3445 SL 3450
TP1: $3435
TP2: $3422
TP3: $3407
🔥BUY GOLD zone: $3352-$3350 SL $3345
TP1: $3368
TP2: $3376
TP3: $3390
⭐️Technical analysis:
Based on technical indicators EMA 34, EMA89 and support resistance areas to set up a reasonable BUY order.
⭐️NOTE:
Note: Nova wishes traders to manage their capital well
- take the number of lots that match your capital
- Takeprofit equal to 4-6% of capital account
- Stoplose equal to 2-3% of capital account
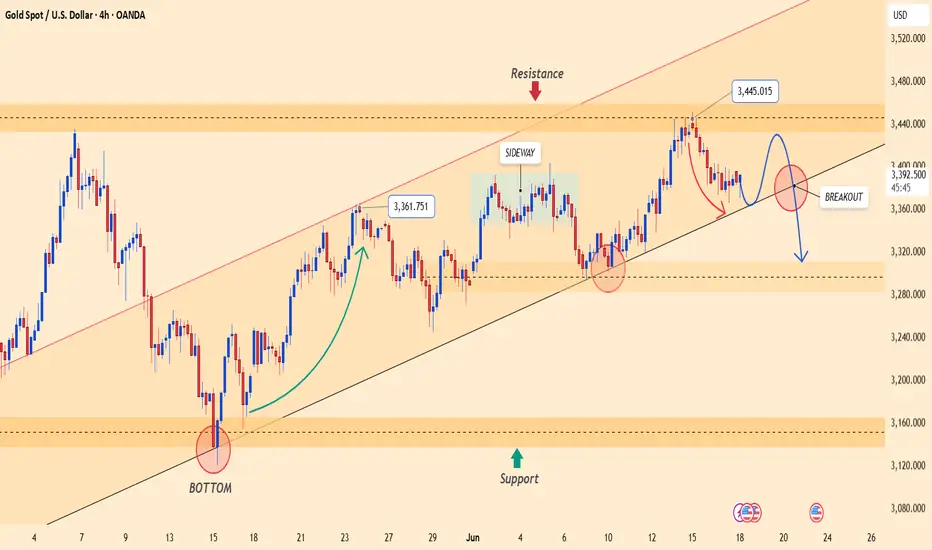
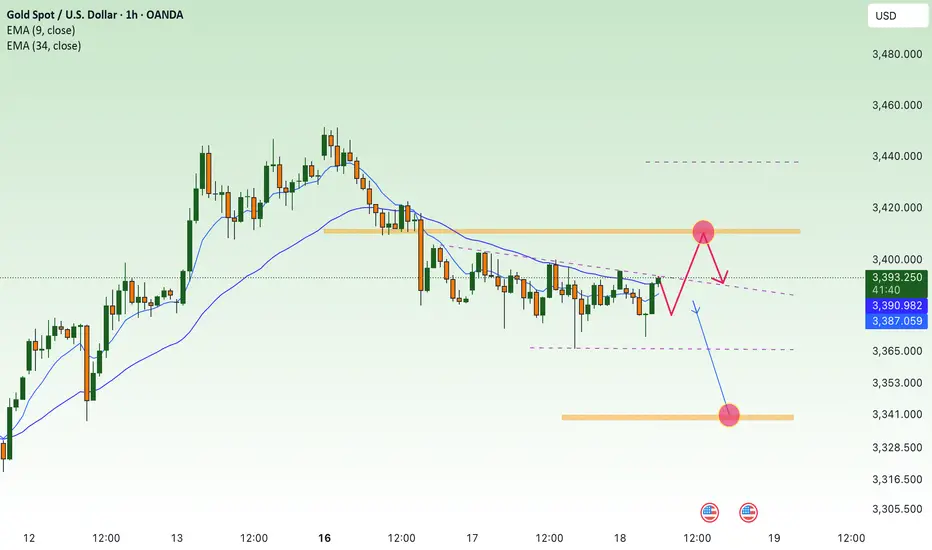
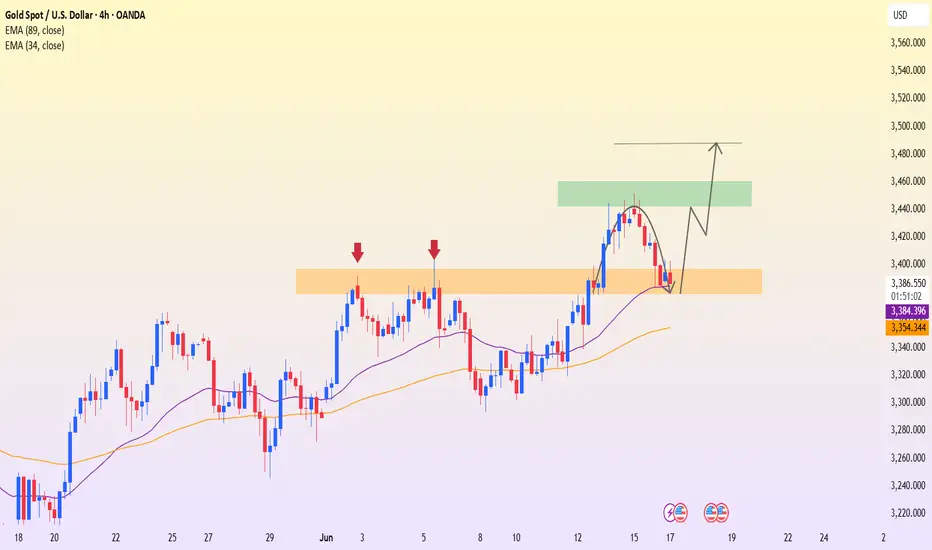
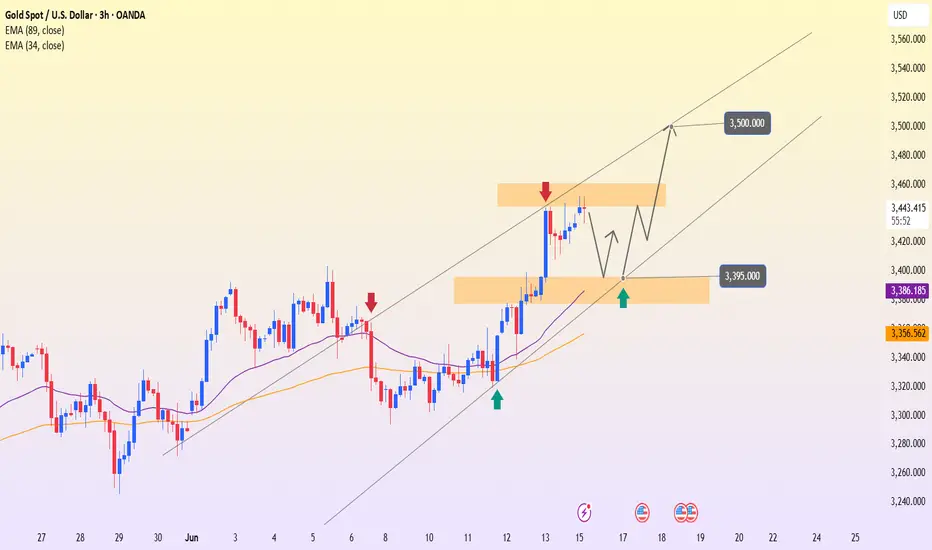
Gold holds above key zoneAfter breaking the major resistance at 3,392 USD — a level that had been rejected multiple times in the past — XAUUSD is undergoing a slight pullback to retest the newly established support. The bullish reaction in this area suggests that buyers are still in control of the trend.
In the current context, U.S. retail sales have fallen more than expected, reinforcing expectations that the Fed may cut interest rates soon. This puts pressure on the dollar and benefits gold.
The primary scenario is a bounce from the current support toward the next resistance area near 3,481 USD. The 3,392 USD level has now become a key support to sustain the ongoing bullish structure.
EURUSD: Awaiting Confirmation to Continue the UptrendThe EUR/USD pair closed yesterday at 1.1550, moving within the 1.1526–1.1558 range. The euro continues its bullish trend, driven by U.S. inflation data coming in lower than expected, which increases expectations of an upcoming rate cut by the Fed. In addition, geopolitical tensions in the Middle East—particularly between Israel and Iran—have slightly weakened the U.S. dollar, providing additional support to the euro.
From a technical perspective, the price is currently correcting toward the 1.1480 area, where the ascending trendline converges with the exponential moving average. This is a key support zone. If it holds and a clear bullish signal emerges, EURUSD could rebound and move toward the 1.1610 resistance level.
Main scenario: look for buying opportunities around 1.1480 if a bullish confirmation appears, targeting 1.1610.
Alternative scenario: if the 1.1480 level is broken, the short-term uptrend could be at risk.
Gold Soars – Heading Towards 3,500 USD/ounce?Gold prices closed yesterday at 3,457.7 USD/ounce, up 0.12% from the previous day, fluctuating between 3,453.7 USD and 3,458.1 USD/ounce, marking the highest level in the past two months.
XAU/USD is currently maintaining an uptrend within a well-defined price channel, with strong support at the 3,390–3,400 range. After a short correction, the price could continue to rise if it holds above the EMA34, with the next target towards the 3,445–3,460 range and further up to 3,500 USD/ounce.
This upward momentum is supported by geopolitical tensions in the Middle East, particularly between Israel and Iran, driving demand for gold as a safe-haven asset. U.S. CPI data lower than expected has also increased expectations of a Fed rate cut, alongside central banks increasing gold reserves, all contributing to the continued rise in gold prices.
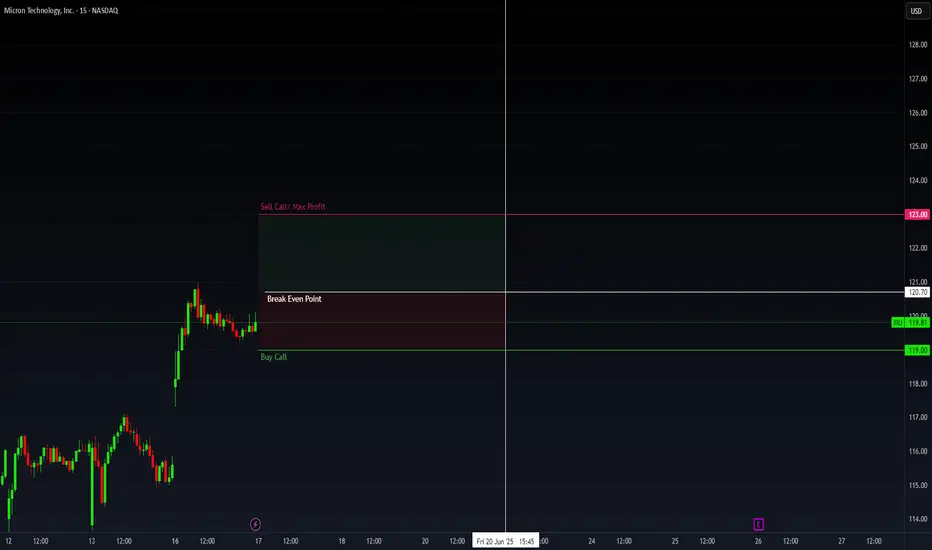
MU Options Insight: Bulls Eyeing $123Fundamental Overview
Micron Technology's $200 billion expansion plan aligns with the broader push for domestic semiconductor manufacturing. The company is investing $150 billion in fabrication plants across Idaho, New York, and Virginia, while $50 billion is allocated for high-bandwidth memory packaging and R&D. This move strengthens Micron’s position in AI-driven demand and supply chain resilience.
The CHIPS and Science Act funding of $6.4 billion and eligibility for the Advanced Manufacturing Investment Credit further bolster Micron’s financial outlook. CEO Sanjay Mehrotra emphasized that this expansion will create tens of thousands of jobs and reinforce U.S. tech leadership.
Technical Analysis
Micron’s stock is currently near a 12-month high, up 37% year to date. The momentum remains strong, with institutional activity suggesting bullish sentiment.
- Options Flow Insight: A vertical bull spread was spotted in Times & Sales, with 118 strike contracts executed on the ask and 123 strike contracts executed on the bid simultaneously. This suggests a bullish stance, as traders anticipate further upside.
- Expiration Consideration: The June 20 expiration (4 days away) indicates a short-term bullish outlook, likely targeting a breakout above $123.
- Institutional Positioning: The 500 additional contracts at 118 reinforce the bullish bias. If MU moves beyond $123, traders holding the spread still profit, confirming strong conviction in upside potential.
BTC accumulates above 104,300 zonePlan BTC today: 17 June 2025
Related Information:!!!
Bitcoin (BTC) price falls to around $106,000 at the time of writing on Tuesday following a mild recovery the previous day. The decline comes as investors continue to digest the escalation of the Iran-Israel conflict and after US President Donald Trump highlighted concerns and asked his security advisors to meet in the Situation Room. While institutional interest in Bitcoin remains robust, any further escalation in the Middle East could impact global risk assets.
The US steps in to resolve the Iran-Israel war
Bitcoin price action remained broadly resilient on Monday despite escalating tensions in the Middle East. The four-day-old war between Israel and Iran, which began on Friday, has so far failed to trigger a sharp correction. The largest cryptocurrency by market capitalization held above its key psychological threshold of 100,000 despite the initial shock — a contrast to April last year, when BTC fell more than 8% amid similar Iran-Israel turmoil.
The New York Times reported on Monday that US President Donald Trump has encouraged Vice President JD Vance and his Middle East envoy, Steve Witkoff, to offer to meet with the Iranians this week.
personal opinion:!!!
Gold price continues sideways and accumulates in 2 trend lines, support 104,300
Important price zone to consider :!!!
support zone : 104.300 - 104.100
Sustainable trading to beat the market
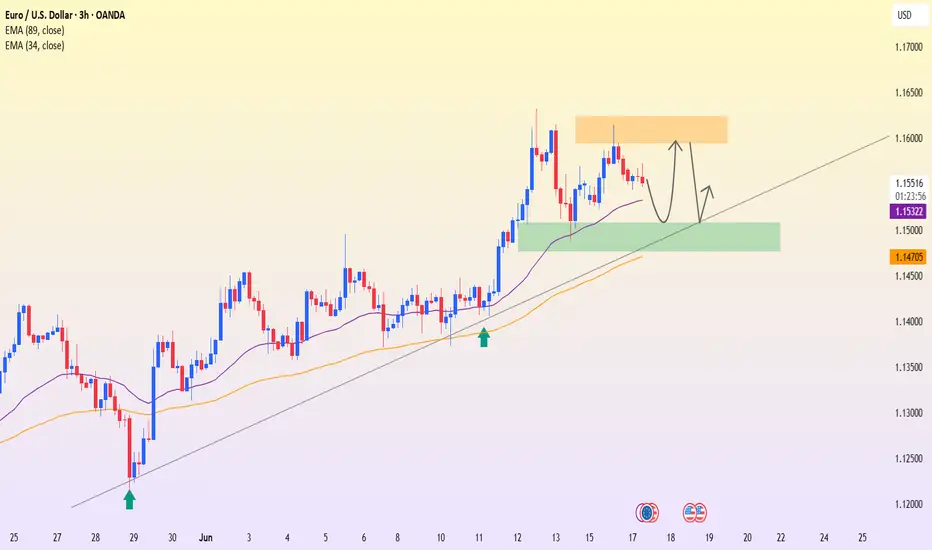
EURUSD – Healthy pullback within a strong uptrendEURUSD is undergoing a temporary correction after a strong bullish move, but the pair remains above key technical support levels such as the EMA34 and the ascending trendline. The 1.15070 zone now acts as a potential buy area—where demand may return if confirmation signals appear.
Market sentiment is leaning toward the expectation that the Fed may cut interest rates soon due to weaker-than-expected U.S. retail sales data, which has weighed on the USD and indirectly supported the euro. Meanwhile, the ECB continues to maintain a stable policy stance, further reinforcing the current bullish trend.
If the price holds above the green support zone, the next target could be around 1.15940. If this support breaks, traders should watch price behavior at the trendline before making the next trading decision.
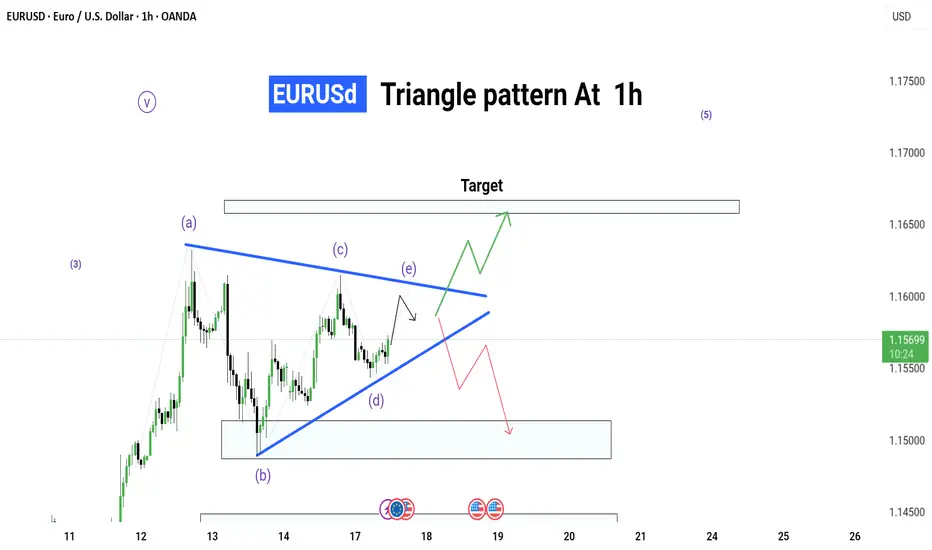
EUR/USD Triangle Pattern – 1H Timeframe
📊 EUR/USD Triangle Pattern – 1H Timeframe
🕐 Date: 17 June 2025
📌 Chart by: GreenfireForex
🔷 Pattern: Contracting Triangle (ABCDE)
🔍 Context: Forming inside Wave (4) – possible breakout before Wave (5)
📈 Upside Potential: Break above triangle → target near 1.16500+
📉 Downside Risk: If fails to break up → revisit demand zone around 1.15000
---
🔮 Possible Scenarios:
✅ Bullish Breakout:
Breaks above wave (e)
Clean rally toward target zone
Ideal for a long setup with tight SL
❌ Bearish Fakeout:
Rejection from triangle resistance
Falls back into demand zone
Look for reversal or retest opportunities
---
🎯 Strategy Tips:
Wait for a breakout candle
Use SL outside triangle zone
Entry based on confirmation – avoid early trades
💬 Let’s discuss live market reaction as price nears triangle edge. Stay ready .
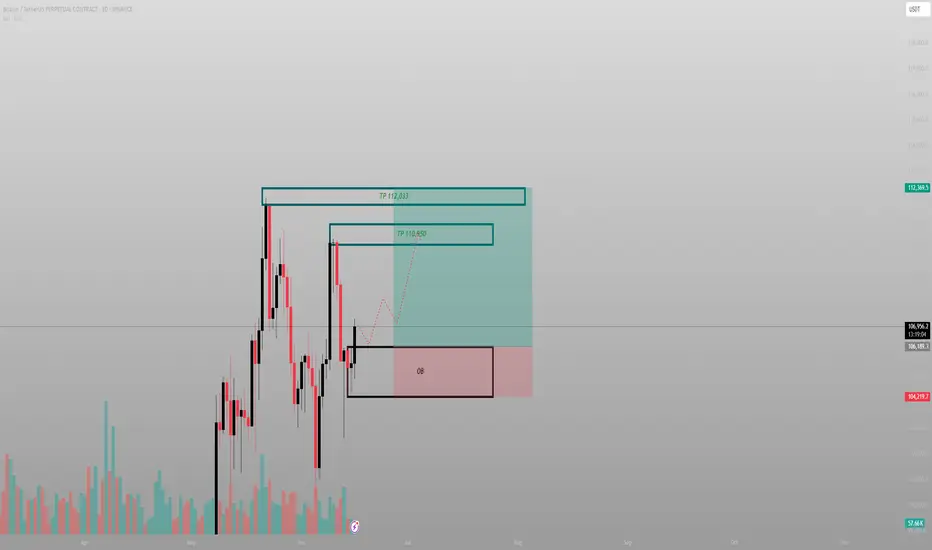
This isn’t a breakout. It’s a return to senderPrice didn’t rally from randomness — it tapped directly into a daily OB, respected it, and is now marching toward unfulfilled inefficiency above. What looks like recovery is really just Smart Money closing the loop.
The logic:
Price swept sell-side liquidity into a deep daily OB and rebounded sharply — not passively. The response wasn’t a bounce. It was intention.
Above? Two clean destinations:
TP1: 110,950 — inefficiency fill and EQ of prior supply
TP2: 112,033 — full delivery into unmitigated structure
No overlapping zones, no chaos — just precise levels that haven’t yet been claimed.
Execution:
Entry: 104,200–105,000 range
SL: Below 103,800
TP1: 110,950
TP2: 112,033
The risk is defined. The reward is prewritten.
Final thought:
“This move wasn’t built to excite you. It was built to deliver.”