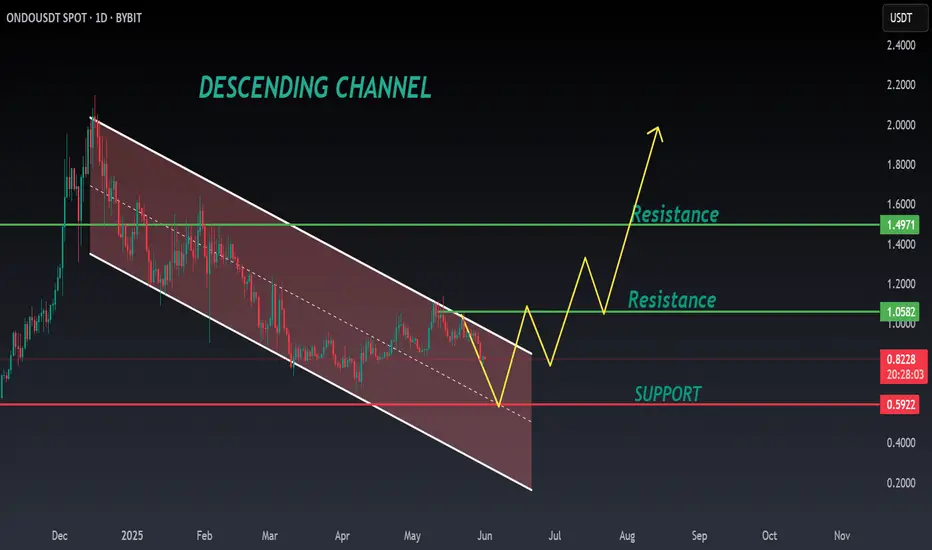
ONDO ANALYSIS📊 #ONDO Analysis
✅There is a formation of Descending triangle pattern on weekly chart 🧐
After a small retest towards to its support zone we would see a bullish movement
👀Current Price: $0.8820
⚡️What to do ?
👀Keep an eye on #ONDO price action and volume. We can trade according to the chart and make some profits⚡️⚡️
#ONDO #Cryptocurrency #TechnicalAnalysis #DYOR
Longsetup
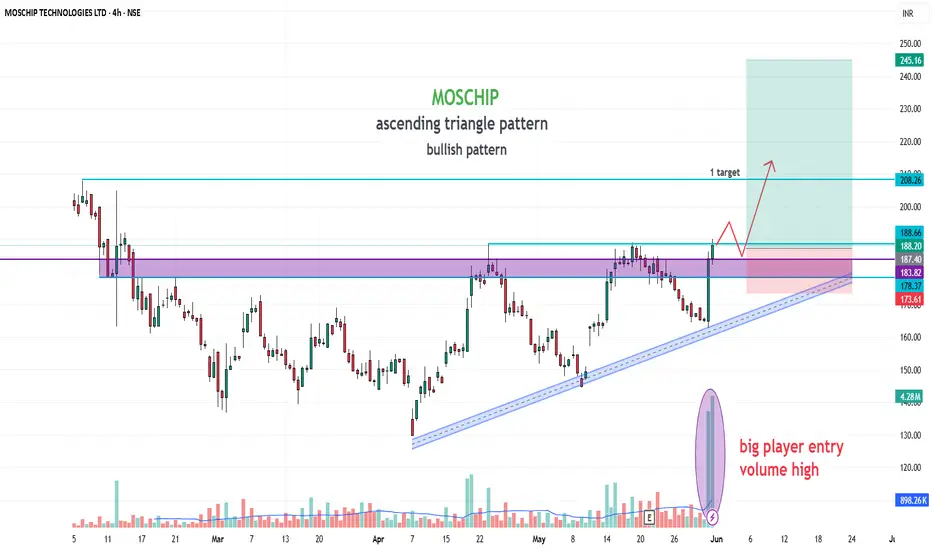
MOSCHIP📊 Stock Analysis: MOSCHIP
The stock has been consolidating within a ascending triangle pattern and is nearing a critical Buy Above level at ₹187 , signaling a potential breakout. The target is set at ₹359, offering a potential gain of 25.90%. Key insights:
Trend: A breakout above the wedge could indicate renewed bullish momentum.
Support Levels: Strong support around ₹170/197, making this a low-risk entry point.
Volume Buzz: The recent increase in volume shows rising investor interest.
🔔 Keep an eye on this setup! Always analyze your risk tolerance before making any decisions.
📢 Disclaimer: This post is for educational purposes and not financial advice. Conduct your research or consult a financial advisor before investing.
What are your thoughts? Share them below! 📝
#StockTrading #TechnicalAnalysis #BreakoutTrading #MOSCHIP
CHZ ANALYSIS📊 #CHZ Analysis
✅There is a formation of Descending triangle pattern on weekly chart 🧐
Pattern signals potential bullish movement incoming after a breakout.
👀Current Price: $0.03818
⚡️What to do ?
👀Keep an eye on #CHZ price action and volume. We can trade according to the chart and make some profits⚡️⚡️
#CHZ #Cryptocurrency #TechnicalAnalysis #DYOR

BTC HTD Demand zones for longBTH HTF Demand Zone are marked,
when price hit these levels you can take long if you want,
trading is risky, Do-your-own-research, Follow risk management

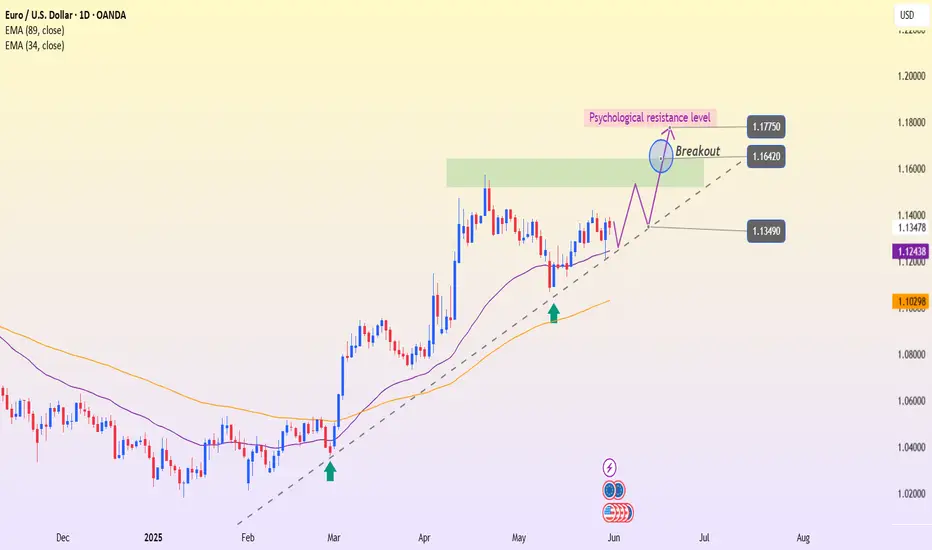
EURUSD – Ready to Break the Psychological CeilingOn the D1 chart, EURUSD is maintaining a stable uptrend structure with higher lows and a well-respected trendline. Buying pressure continues to emerge around the EMA 34 support zone, indicating that the bulls remain in control.
Currently, price is approaching the psychological resistance level at 1.16420 – an area that has rejected price multiple times in the past. However, a potential breakout pattern is forming: if the price can close decisively above this zone, the next target could extend to 1.17750.
While waiting for a breakout confirmation, traders can watch for minor pullbacks toward the trendline or EMA to find entries aligned with the trend. The overall momentum still favors the buyers, as long as the 1.13490 level holds.
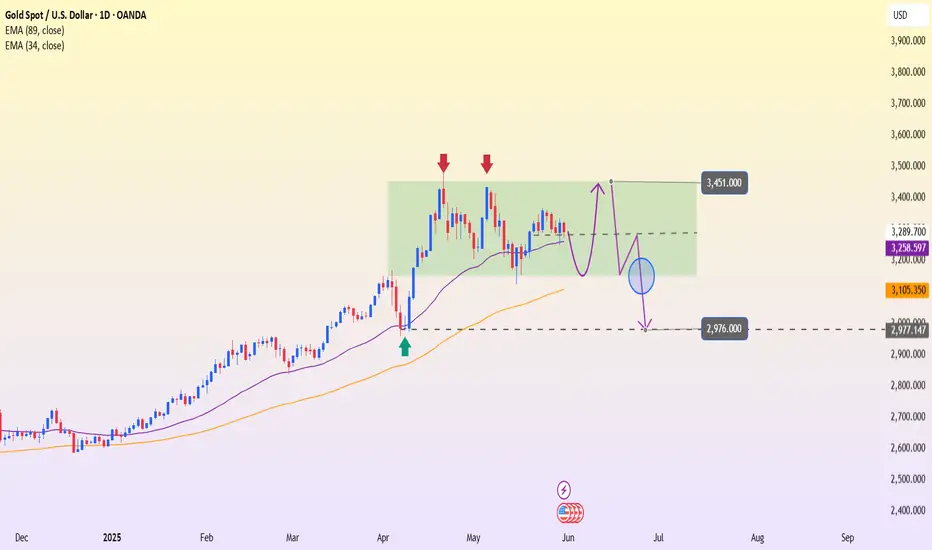
XAUUSD – Sideway breakout loomsOn the daily timeframe (D1), gold is still stuck in a wide sideway range between 3,105 and 3,451, which has persisted since early April. However, recent price action suggests the structure is gradually tilting toward a bearish bias.
The rebounds from the current range bottom are weakening, with each successive peak failing to surpass the previous one. Moreover, the EMA 34 is being tested repeatedly — indicating that buyers are losing momentum.
If the price breaks below the support area around 3,258–3,260 (which aligns with the EMA 34), the next target could be the 3,105 zone. And if this level also fails to hold, a deeper drop toward 2,976 may be triggered.
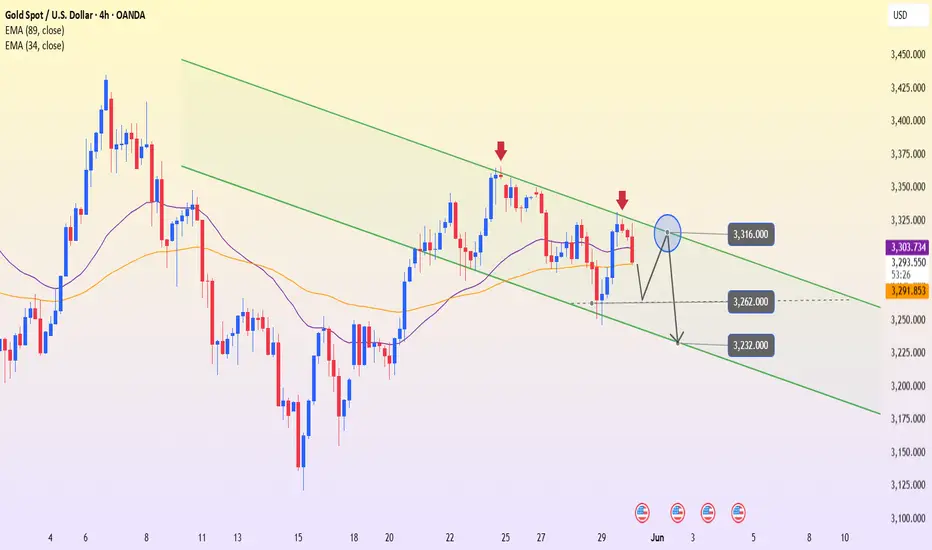
XAUUSD – Facing headwinds from inflation expectationsHey everyone, we’ve got quite an interesting setup on gold today!
As shown on the chart, XAUUSD is still moving within a clearly defined descending channel. After bouncing from the lower support area around 3,262, price is now retesting the upper boundary of the channel. What’s more important is that this area overlaps with both the 34 and 89 EMAs – creating a strong confluence of resistance.
If price continues to be rejected here, there’s a high chance that gold will reverse and head back toward the bottom of the channel. A likely target could be around 3,232.
As for the news: Core PCE – the Fed’s preferred inflation gauge – is expected to rise. This has led the market to anticipate that the Fed might keep interest rates higher for longer. And when bond yields rise and the USD strengthens, gold – a non-yielding asset – tends to lose its appeal.
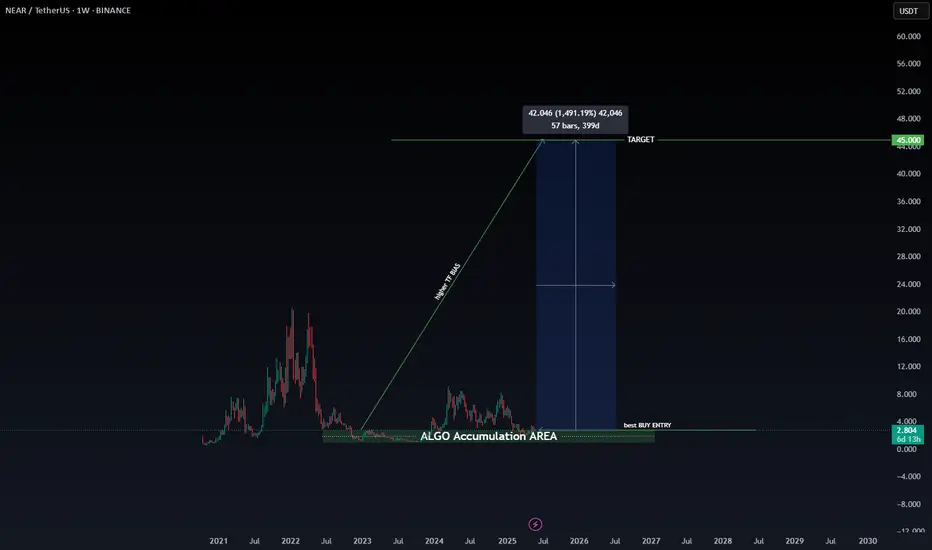
NEAR to $45? The Signs Are All There…Just imagine traveling through time.
Many people look back with regret, wishing they had invested in cryptocurrencies before previous bullish cycles. We've all heard phrases like "If only I had bought Bitcoin at $100, I'd be a millionaire by now."
But the real question is: Will you have the courage to make the right decision when the moment comes?
You might think I'm crazy for presenting these targets today — and that's okay. But trust me, in a few months, you'll witness the phenomenal power of our analysis system. The market is fractal by nature; what happens on lower timeframes inevitably plays out on higher ones.
NEAR is one of the most promising blockchains, and all signals are aligning for a move toward $45.
The question is: Do you have the courage to take action now?
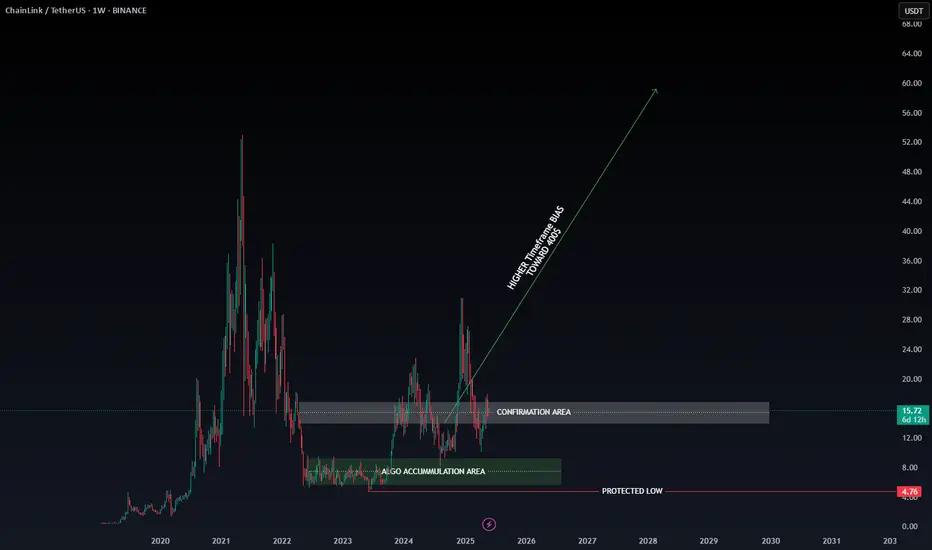
Winter Is Coming — And LINK Is Leading the Charge (x25) Chainlink acts as a bridge between blockchain and the real world.
This asset has been on our radar for years, silently building strength. Its fundamentals are rock-solid, and the current price action is highly favorable for a strategic buy.
📈 On November 12, 2023, LINK officially confirmed its journey to $400 by breaking through our algorithmic confirmation zone. Since then, it’s shown a modest price increase… and right now, it's retesting one of the best buy zones we've seen.
But here's the catch:
In the coming weeks, we expect explosive rallies — the kind that won’t allow for optimal entries anymore.
✅ We are currently positioned long on LINK, and it’s proving to be one of our strongest investments to date.
And remember:
The assets we publish on TradingView have already confirmed their trajectory toward our predicted targets.
🎬Not even Trump... not even a world war could stop what’s coming.
🚀 Buckle up... because winter is coming.
And LINK is ready to lead the storm.
🔍 Disclaimer: This is our personal analysis and not financial advice. Always do your own research before making any investment decisions.
💬 What’s your take on this? Drop your thoughts in the comments and feel free to share this with your friends! ❤️
PLUG 1D Investment Long Aggressive Trend TradeAggressive Trend Trade
- short impulse
+ volumed TE / T1 level
+ support level
+ biggest volume 2Sp-
+ weak test
+ first buying bar close level
Calculated affordable stop limit
1 to 2 R/R take profit
Monthly Trend
"+ long impulse
+ support level
+ T2 level
+ biggest volume reaction bar
= below 1/2 correction"
Yearly CounterTrend
- short impulse

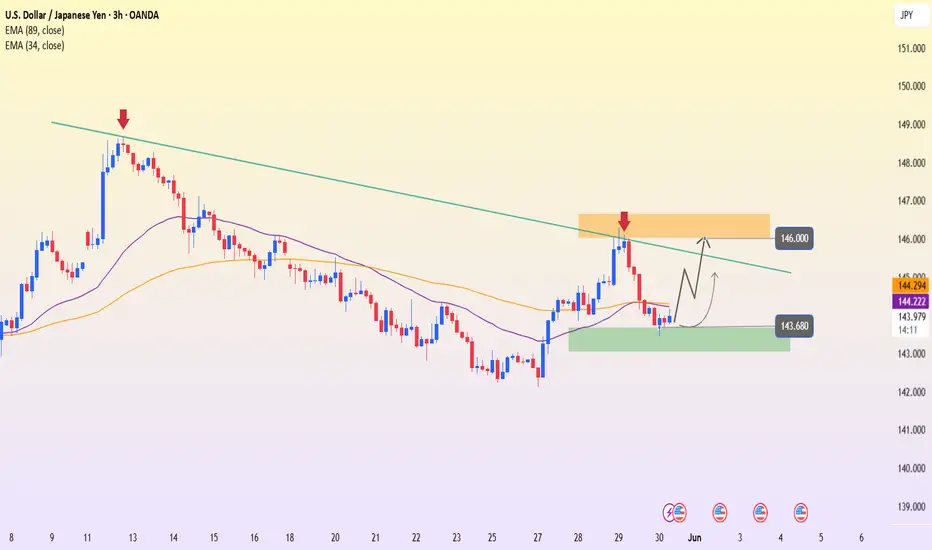
USDJPY – Supportive news, price may break resistance soonUSDJPY is supported by positive U.S. economic data, as the PCE index remains elevated—reinforcing expectations that the Fed will keep interest rates higher for longer. This has boosted bond yields and the USD, driving USDJPY upward.
On the H3 technical chart, USDJPY has rebounded from the support zone around 143.680. Both the EMA 34 and EMA 89 lie below the price, reinforcing the recovery momentum. The pair is now expected to approach the 146.000 resistance area—where it intersects with the long-term descending trendline that has rejected price at least twice before.
If buying pressure holds and 146.000 is decisively broken, a short-term bullish trend will likely be confirmed. However, another rejection could lead to a retest of the previous support zone. Overall, the current trend slightly favors the buyers.
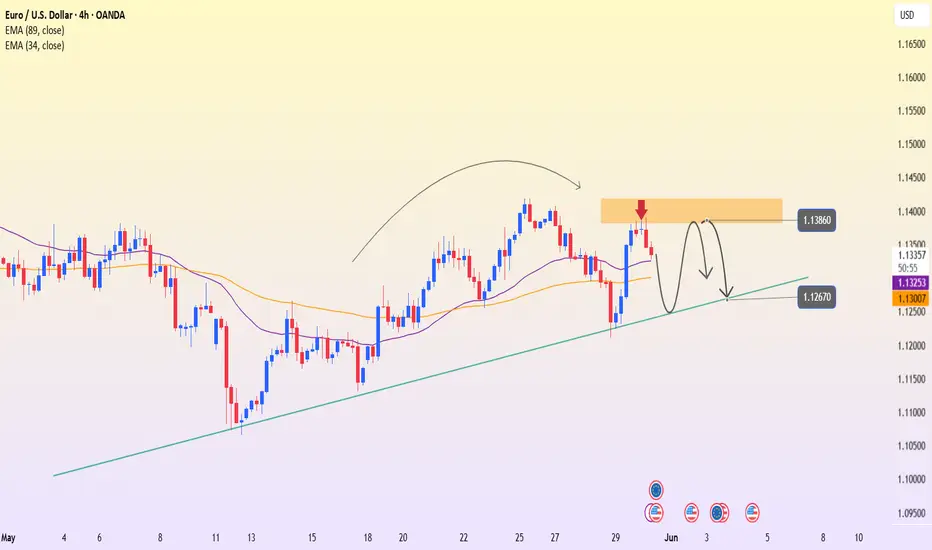
EURUSD – Bullish trend at risk amid PCE and technical pressureEURUSD has just reached the 1.13860 resistance zone – a confluence with the previous peak and former supply area. A weak rebound and a rounding top pattern are gradually forming, indicating weakening buying momentum. The 34 and 89 EMAs on the H4 chart add further pressure from a technical perspective.
If the price continues to be rejected at 1.13860, it may drop toward 1.12670 – which aligns with the ascending trendline support. A break below this level would confirm a clearer bearish trend.
The upcoming Core PCE data is forecasted to rise – indicating inflation remains elevated. This raises the likelihood that the Fed will maintain high interest rates for longer, supporting the USD and weighing on EURUSD.
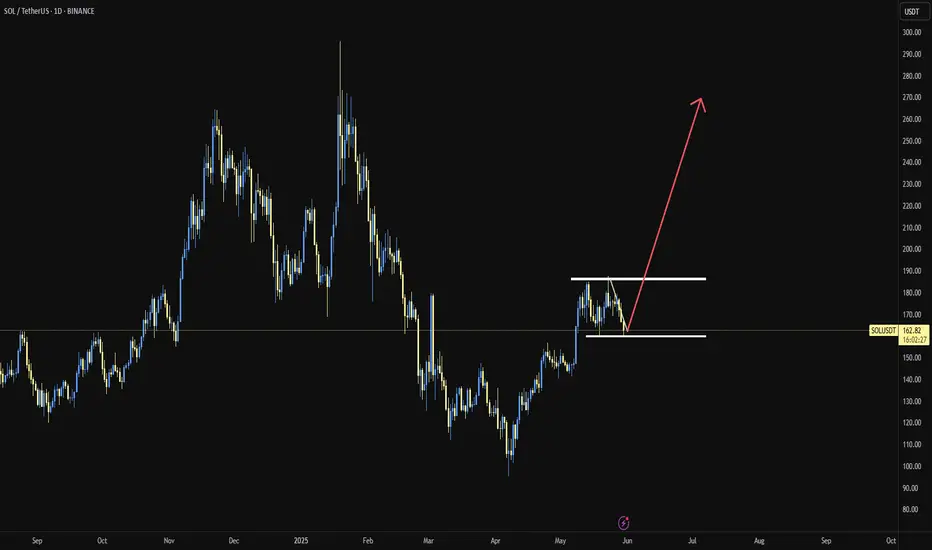
SOL/USDT"Solana, like the other two coins, is also poised for growth and is currently in the best possible position. What do you think, my friend? Do you think Solana can go up?
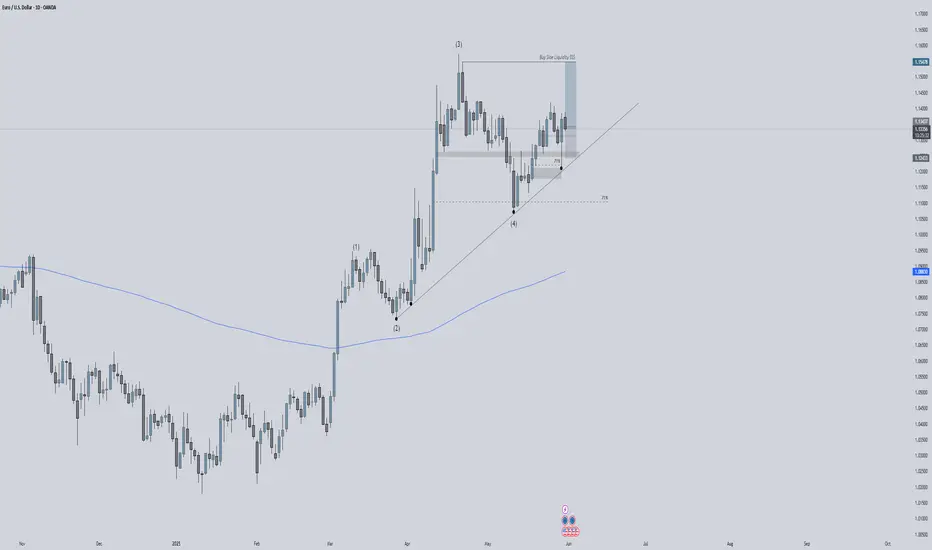
EUR/USD - BUY BUY BUY!Here in my personal Opinion I can see a few potential reasons to buy with high confidence.
Firstly- Weekly timeframe is showing a Bullish movement with us closing last week with a strong volume candle.
Secondly- On the Daily time frame we can see this is a high possibility of a 5th leg of elliots wave to finish this Bullish run.
Thirdly- The Daily has pushed out of the 71% level from the first demand zone. Following this on the 4H Time frame we can notice this previous push has also giving a strong Liqudity Grab into the new 71% level telling me Buyers are still highly in control.
I will be looking to trade into Buy side Liquidity after this Volume gap has been filled
Follow along for more updates
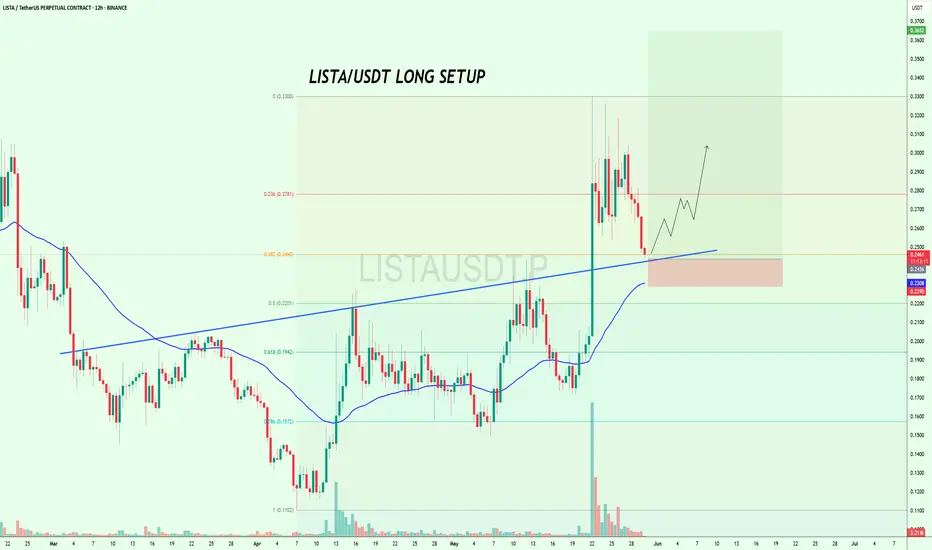
$LISTA at Key Support – Long Opportunity Loading?$LISTA looks good to long here with a short SL🚀
It is approaching a key confluence support zone right at the 0.382 Fib level (~0.2460), the rising trendline, and the 100EMA on the 12H chart.
This level held well in the last move and could once again act as the launchpad for a bullish breakout toward $0.30–$0.33.
But if it breaks below this support zone, short-term momentum could shift.
Watch how the price reacts here👀
BINANCE:LISTAUSDT
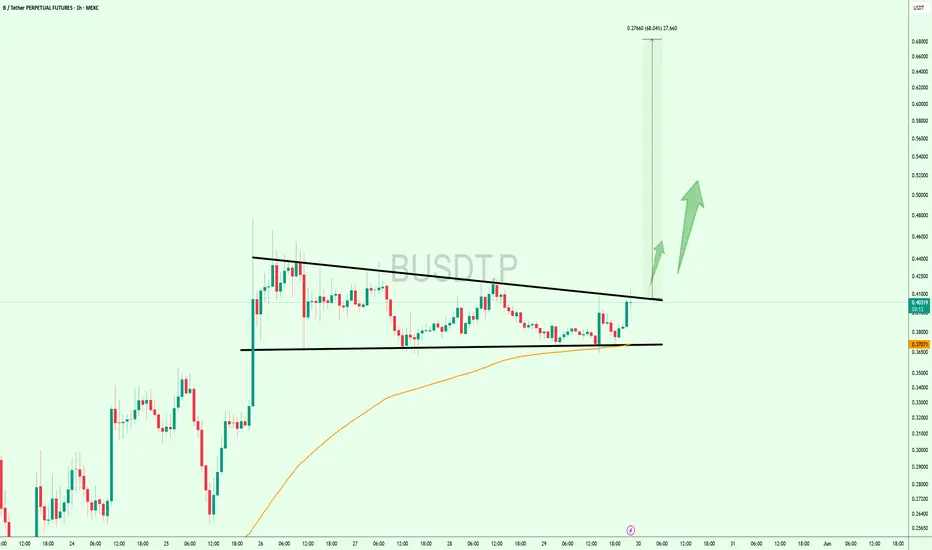
$BUSDT Ready to Explode? Breakout Could Send It Flying#BUSDT is demonstrating strong potential for a pennant breakout.
A successful breakout could trigger a +60% bullish rally in the coming days. 🚀
#Altseason2025
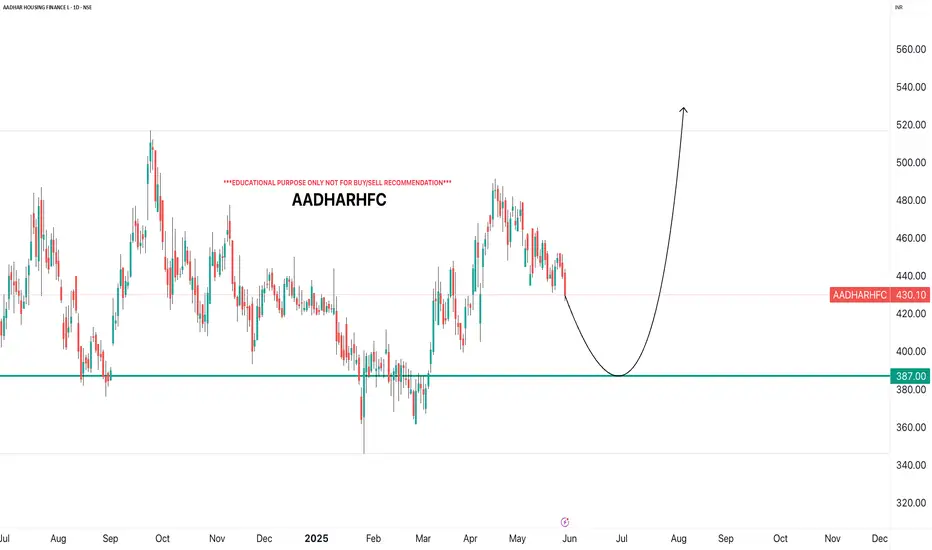
AADHARHFCi Observed these Levels based on Price Action and Demand & Supply which is my own Concept "PENDAM CONCEPTS"... Please don't take any trades based on this chart/post... Because this chart is for educational purpose only not for Buy or Sell Recommendation... Thank Q
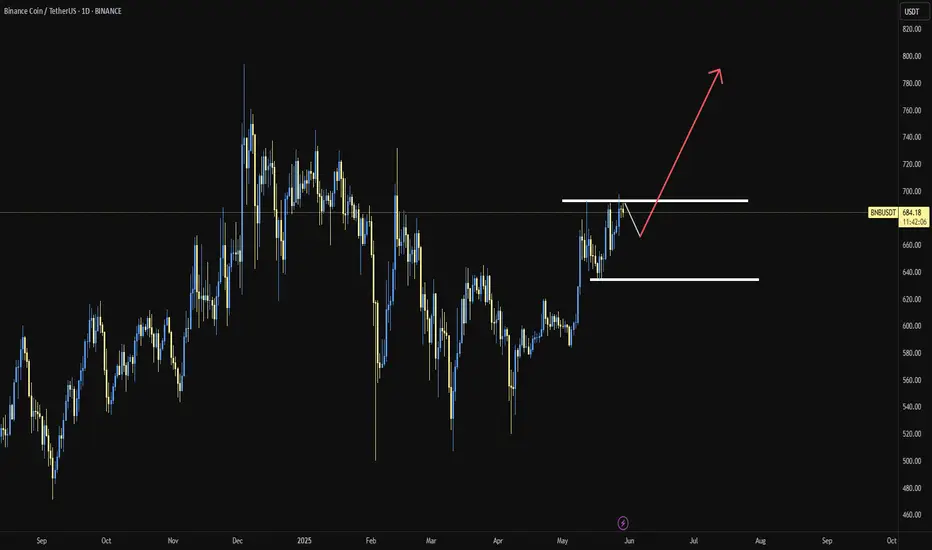
BNB/USDT"Binance, like Ethereum, is in its best condition right now. Do you think it will go up or down?"
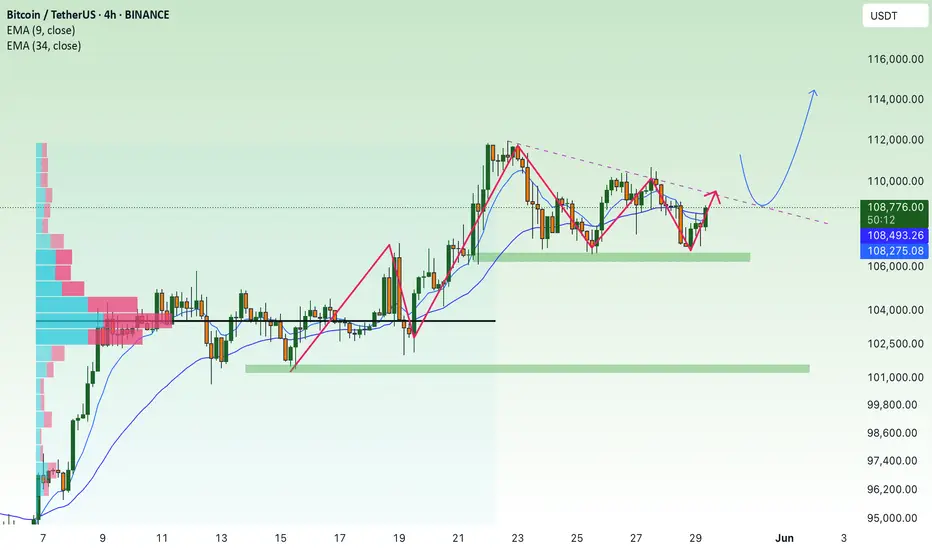
BTC breakout soon and return to ATH💎 Update Plan BTC (May 29)
Notable news about BTC:
The overall cryptocurrency market capitalization has remained relatively stable over the past 24 hours, hovering near the $3.42 trillion level. Digital assets appear largely indifferent to the recent rally in equities, as gains in traditional markets are driven by corporate earnings and tariff-related developments rather than shifts in monetary policy or liquidity conditions. Meanwhile, the US Dollar is strengthening for a third consecutive session, adding further pressure.
Bitcoin (BTC) has pulled back from the upper end of its recent trading range near $110,000, settling closer to the $107,000 mark. This pause near previous highs has helped ease short-term market overheating. As institutional participation in Bitcoin deepens, its price behavior is increasingly mirroring that of traditional financial instruments like equities and commodities—marked by more tempered momentum and fewer fear-driven surges.
Technical analysis angle
It is still a 107k bumper area that brings profits to Buyer. But the worrying thing here is that the vertices of BTC are lower.
We will have two scenarios for BTC:
) First within the next 1 week, the organizers still go in this flag model and gradually narrow towards the top. If the price line follows this model, it will be negative for BTC and investors
) Secondly: BTC price will breakout area 109k, the target will go straight to 113k-115k and lower boundary if Breakout area 107k will return to 102k-100k
🔥BTC 4H is currently in the adjustment phase, this time will cause a lot of traders, Future - Margin to lose money, this rhythm will last long
At this time, whether new or old, should spend more time to practice, load more knowledge about the PTKT, as well as find knowledge posts at the channel ..., to strengthen the solid foundation, as well as avoid losing money at this time offline
==> Comments for trend reference. Wishing investors successfully trading
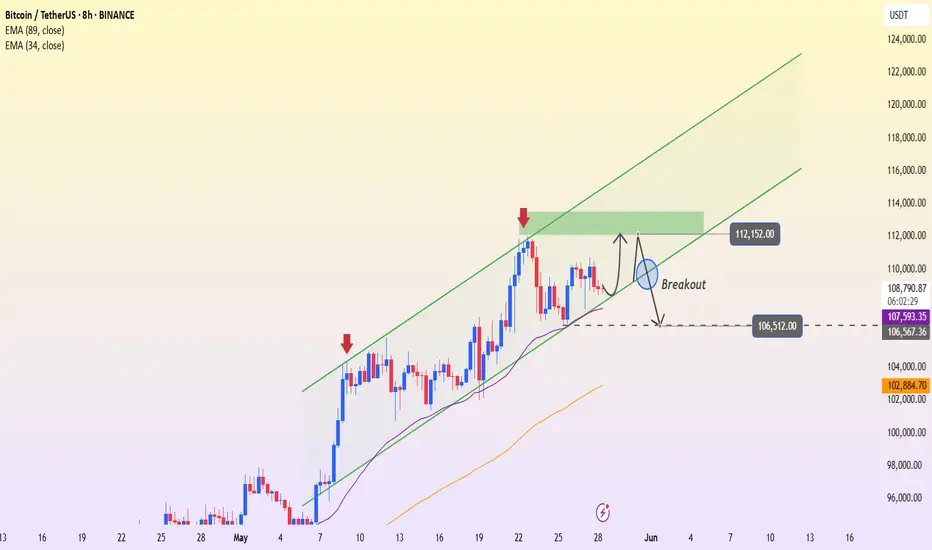
BTCUSDT – Risk of trend break, bearish signs emergingBTCUSDT is trading right at the lower boundary of its ascending channel, around the 108,800 mark. After several bounces from this trendline, price action now appears to be stalling—indicating that buying pressure is weakening. If the price breaks below the 107,500–106,500 support zone (marked by the 34 EMA and recent swing low), the short-term uptrend could be invalidated.
A confirmed break below 106,500 could trigger a further correction toward the 89 EMA around 102,800.
On the news front: Latest data shows Bitcoin’s dominance is slightly decreasing as capital rotates back into altcoins. Additionally, market uncertainty surrounding the Fed's monetary policy outlook is making investors more cautious about riskier assets like crypto.
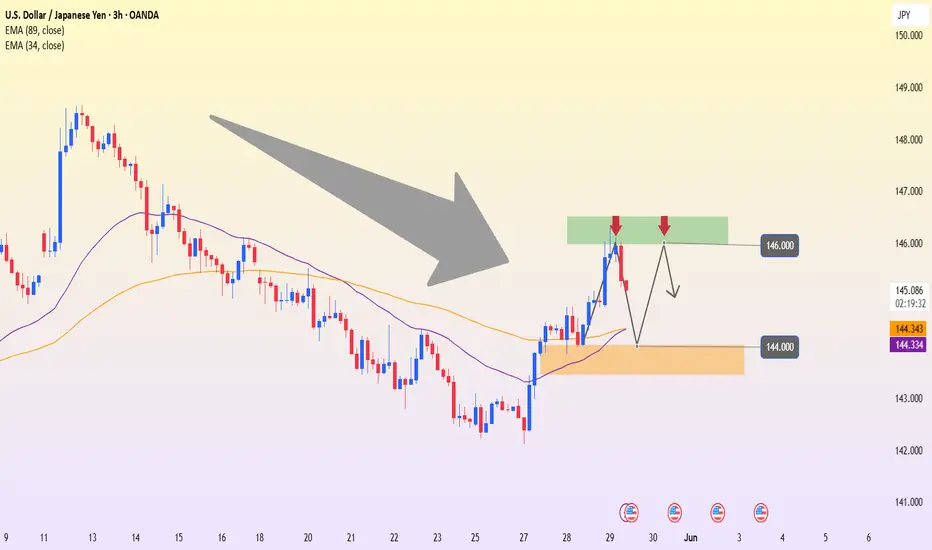
USDJPY – Rejected at 146.00, downside risk growsUSDJPY reacted strongly at the 146.00 resistance area – a level where price was previously rejected. After a sharp rally, the pair has turned lower and is now heading toward the 144.00 support zone, which aligns with the EMA 34–89 on the H3 chart.
The chart shows a small double top pattern forming around the recent highs. If USDJPY continues to struggle below 146.00 and breaks through the 144.00 support, a short-term downtrend may be confirmed, with the next target around 142.50.
On the news side: The Japanese Yen is gaining some ground again after the BOJ signaled readiness to adjust its easing policy if inflation consistently exceeds its target. Meanwhile, the USD is under pressure as expectations grow that the Fed may keep interest rates steady in the upcoming meeting, due to cooler consumer data.
Suggested strategy: Consider selling if bearish signals appear around the 145.80–146.00 area, with a short-term target at 144.00.
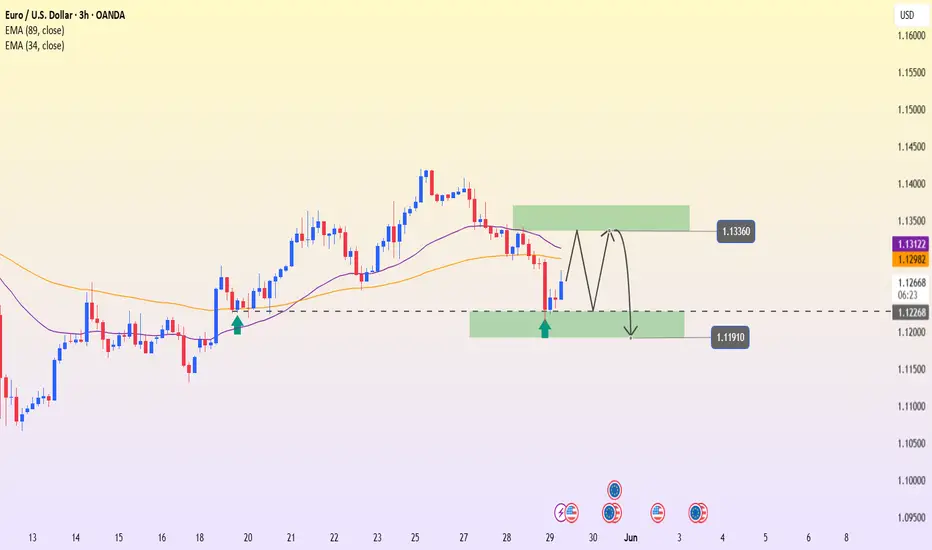
EURUSD – Technical rebound, but bearish pressure still loomsAfter a sharp drop to the support zone around 1.12255, EURUSD has made a mild recovery and is now retesting the 1.13360 resistance area – which aligns with both the 34 and 89 EMAs. This confluence zone could trigger renewed selling pressure if price fails to break above.
The 3-hour chart shows a zigzag-like recovery forming, but each new high is still lower than the previous one – indicating that the downtrend remains intact. If EURUSD continues to struggle at this resistance, it is likely to reverse and retest the 1.11910 support area.
On the news front, markets are awaiting CPI data from both the Eurozone and the U.S. this week. If U.S. inflation comes in higher than expected, the dollar may continue to strengthen – increasing short-term downside pressure on EURUSD.
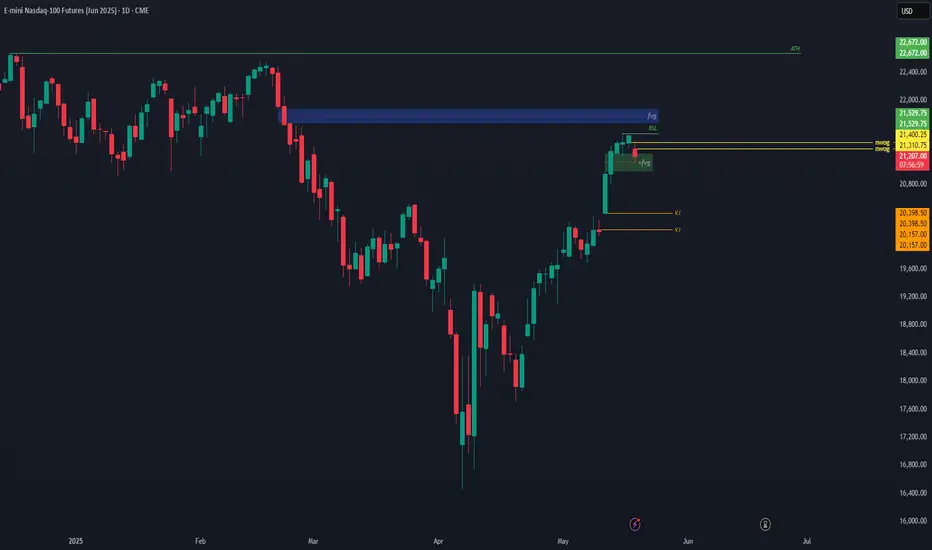
NQM2025 outlook for the week ahead 05/19/2025Hello World.
for the week ahead i have a bullish bias im looking to target the bearish fvg created on mon 24 feb 2025 ( daily TF) i expect the fvg formed on tue 13may2025 (Daily TF) reject the price higher, if the bullish fvg didnt hold maybe we will se a drop to the V.I bellow.
i will give updates