“XAU/USD Buy Setup | Breakout Retest with 3-Target Bullish StrucThe hope of this idea presents a bullish setup on Gold (XAU/USD) based on a breakout–retest structure with multi-session volatility for price action.
Strong recovery above the intraday consolidation zone near 3180-3183 breaks the sharp liquidity sweep beneath 3171. This aggressive recovery may suggest a fakeout and reversal whipsaw: a smart money signature.
🔹 Technical Rationale:
Entry Zone (3181-3183): Aligned with supply candles' base as well as minor demand zone order.
SL (3180): Structural support and bullish engulfing low just beneath.
TP1 (3187): Prior minor high.
TP2 (3190): Consolidation rejection zone around psychological approximate value.
TP3 (3192): High-value liquidity cluster and potential sweep zone above high.
The market has printed higher lows after the fakeout suggesting bullish continuation bias resulting the structure holding until 3180. With favorable R:R ratio and flexible structure, everything stays intact.
⚠️ Risk Note:
Confirmation based trend continuation idea. Strong volume sustaining move below 3180 invalidates the idea.
📈 The structure and set levels provide clean bounds to wait for market dynamics.
Longsetup

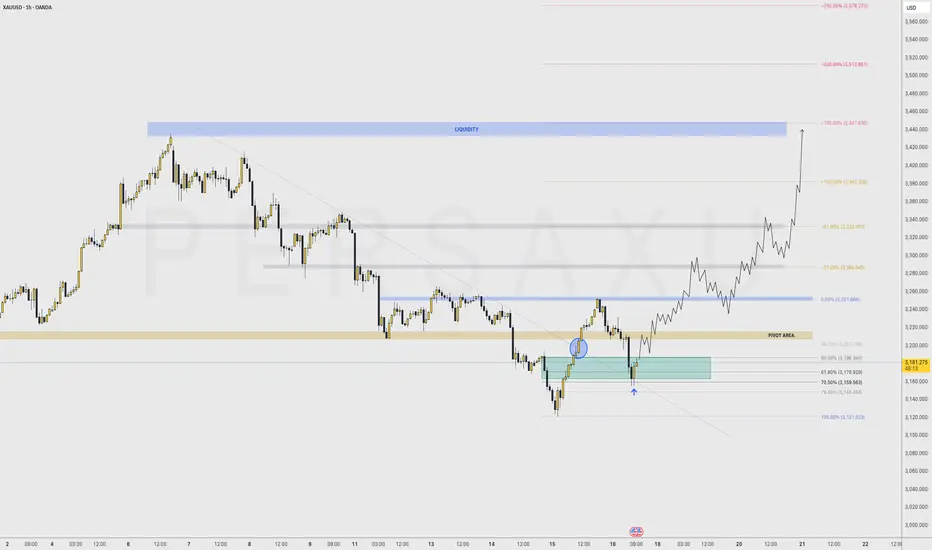
PATIENCE PAYS 〉BEARS TRAPPED - HODL TO $4,000As illustrated, Im trying to visualize the beginning of the next impulse toward $4,000
This is an intraday - swing trade opportunity to 1H highs; however, it would be just the first move toward a longer term path to ATH above $3,500
Ride this wave as you can, but know that the yellow metal still has a lot of strength and power to continue growing.
June might still behave strangely as it is a consolidation month on average 5-10-15 years; however, It wouldn't surprise me if market structure holds important support prices instead of ranging back below $3,200 - $3,150 ; in other words, that range might be strong longterm support.
--
GOOD LUCK!
SECURE PROFITS.
persaxu
EURJPY - Analysis and Potential Setups (Intraday- 16.05.2025)Brief Description:
A BoS as shown would give us additional confluence on this trade.
I will be taking an aggressive entry @ half risk and will add another position if we see price develop further and give us confirmation structures.

Cumulative recovery above 3190, maintain⭐️GOLDEN INFORMATION:
Gold price (XAU/USD) fails to build on Thursday’s sharp rebound from the $3,120 area — its lowest level since April 10 — and comes under renewed selling pressure during Friday’s Asian session. The 90-day trade truce between the US and China has alleviated some of the strain on global financial markets, weighing on demand for the safe-haven metal.
Nevertheless, lingering geopolitical tensions and a weaker US Dollar continue to offer underlying support, limiting the downside. Additionally, growing market expectations for further interest rate cuts by the Federal Reserve may deter traders from adopting strong bearish positions on gold in the near term.
⭐️Personal comments NOVA:
Gold prices recover, buyers are determined to keep prices stable around the 3200 mark in May. Waiting for new bullish momentum after tariff negotiations end
⭐️SET UP GOLD PRICE:
🔥SELL GOLD zone : 3287- 3290 SL 3294
TP1: $3270
TP2: $3260
TP3: $3250
🔥BUY GOLD zone: $3173 - $3175 SL $3168
TP1: $3188
TP2: $3200
TP3: $3218
⭐️Technical analysis:
Based on technical indicators EMA 34, EMA89 and support resistance areas to set up a reasonable BUY order.
⭐️NOTE:
Note: Nova wishes traders to manage their capital well
- take the number of lots that match your capital
- Takeprofit equal to 4-6% of capital account
- Stoplose equal to 2-3% of capital account
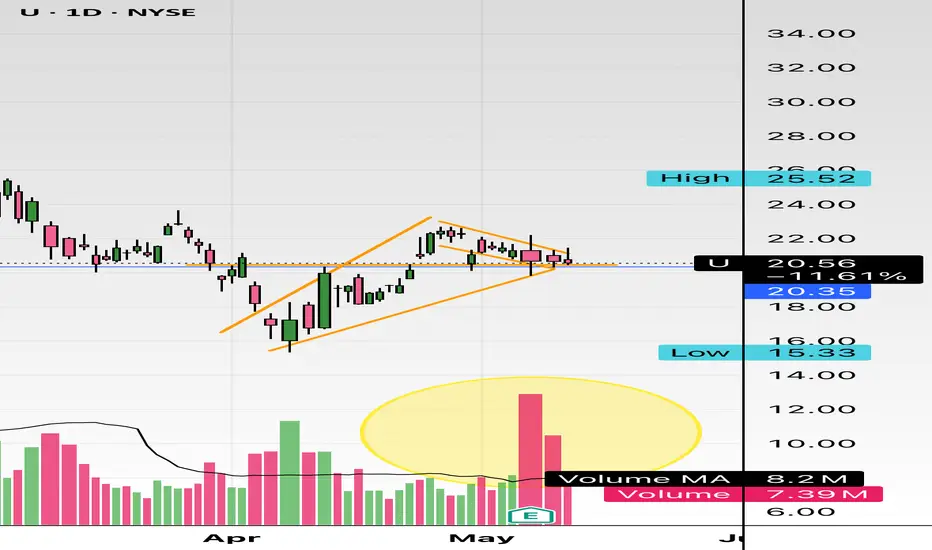
$U $20 support, flagging in ascension Interesting setup here. Looks pretty good IMO. Software is a great name to look at in this market environment. It has a nice support at $20, even at large volume here it’s holding nicely so it shows relative strength. This name is definitely bullish long term. I’m in $21.5c for 2 weeks out, this is a high IV% name. Can run 10% in a day, 20% in a week, etc. We will see how it plays out.
WSL.
Nasdaq100/Us100 Possible Explosive Up Move About To Happen
Hello everyone! In this idea I have posted a picture of my current setup. I have taken a long positions once the 1 hour candles broke out of and closed beyond this range (Box) My SL is just the other side of this box and I am targeting the ATH on this position.
If another 1 hour box starts to form higher up I will simple add another position and move Stop losses accordingly.
although we have moved back within the range, the buy pressure is squeezing the candles to the top side of this range. This is why I am execting an explosive move. Once sellers are exhuasted it will propell itself to the next key level.
Let me know what you think.
I am not a financial adviser. Trade at your own risk.

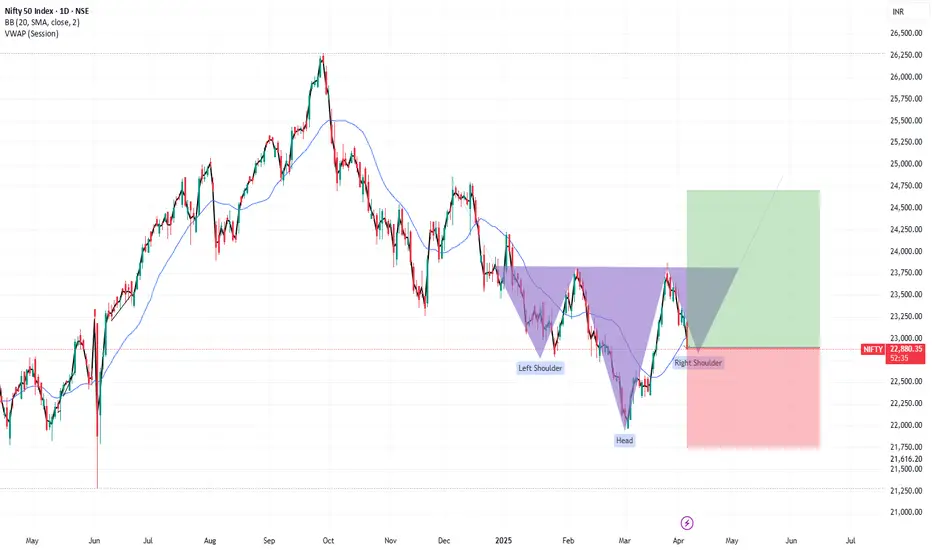
NIFTY ON SALE SALE SALENifty is in the making of inverse head n shoulder pattern on daily charts.
Risk:Reward = 1:20
Could bought here with closing basis stoploss below 21775 & target is almost 2000 points from here.
Not to b missed level.
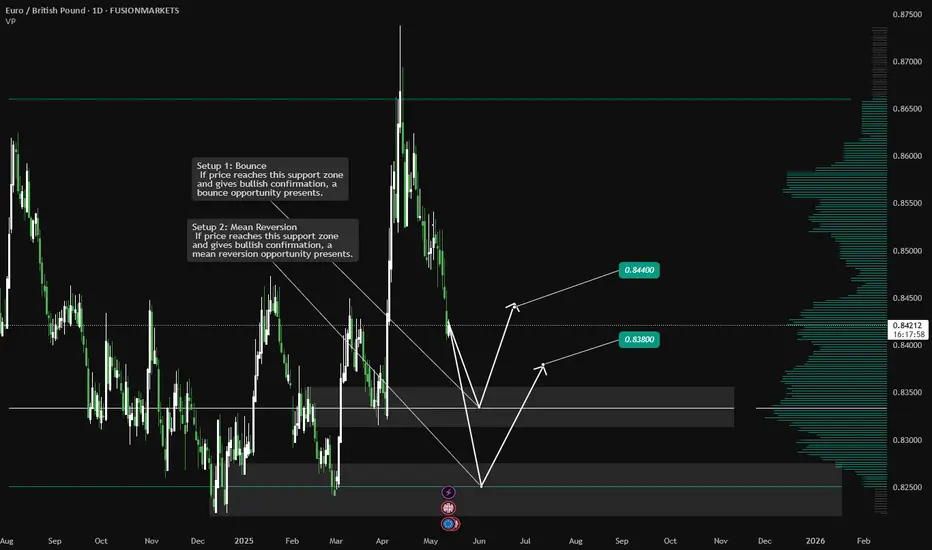
EURGBP Analysis: Two Daily POIsHello traders!
EURGBP is offering two trading scenarios on the daily timeframe.
The first scenario suggests the pair may react bullishly from the next zone, setting up a bounce opportunity that could drive price higher toward the 0.84400 area.
The second scenario anticipates a bounce toward the 0.83800 area, where a mean reversion setup may come into play (if buyers step in and price action confirms bullish intent near that support).
Discretionary Trading: Where Experience Becomes the Edge
Discretionary trading is all about making decisions based on what you see, what you feel, and what you've learned through experience. Unlike systematic strategies that rely on fixed rules or algorithms, discretionary traders use their judgment to read the market in real time. It's a skill that can't be rushed, because it's built on screen time, pattern recognition, and the ability to stay calm under pressure.
There's no shortcut here. You need to see enough market conditions, wins, and losses to build that intuition—the kind that tells you when to pull the trigger or sit on your hands. Charts might look the same, but context changes everything, and that's something only experience can teach you.
At the end of the day, discretionary trading is an art, refined over time, sharpened through mistakes, and driven by instinct. It's not for everyone, but for those who've put in the work, it can be a powerful way to trade.
HFCL LTD WORTH TRACKING FOR SHORT TERM HFCL Ltd. (Himachal Futuristic Communications Limited) is a telecom infrastructure enabler with a diverse portfolio spanning telecom equipment manufacturing, optical fiber cables, and turnkey services
Business Segments
- Telecom Products: Includes UBR radios, Wi-Fi access points, AI-driven network management, and home mesh routers.
- Optical Fiber Cables: Largest market share in OFC supplies.
- Defence: Offers electronic fuzes, thermal weapon sights, and surveillance radars.
- Passive Connectivity Solutions: Supplies cable assemblies and high-density cabinets.
- Aerospace & Automotive: Provides custom cable assemble
Forecasts suggest potential short-term targets between ₹91.66 and ₹93.60 for 2025. Meanwhile, long-term projections for 2026 indicate a possible price range of ₹146.02 to ₹149.07.

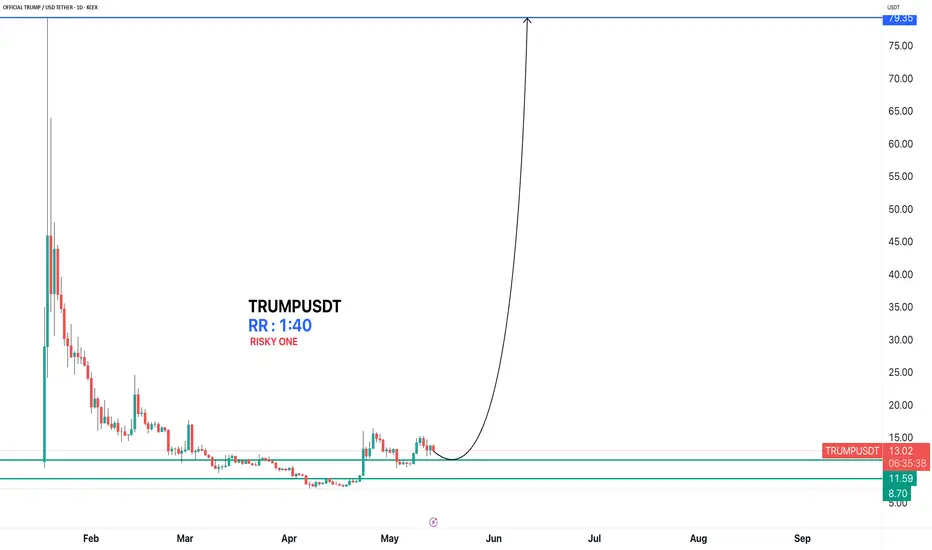
TRUMPUSDTi Observed these Levels based on Price Action and Demand & Supply which is my own Concept "PENDAM CONCEPTS"... Please don't take any trades based on this chart/post... Because this chart is for educational purpose only not for Buy or Sell Recommendation... Thank Q

Gravita , 1DPattern is looking very good , Enter if Nifty is in Up Trend , Avoid if Nifty Trend is Reversing ,
Take Risk according to your Capital .
Dont panic in Retracement and pullbacks after entering into trade .
Follow for More Swing Ideas Like this .

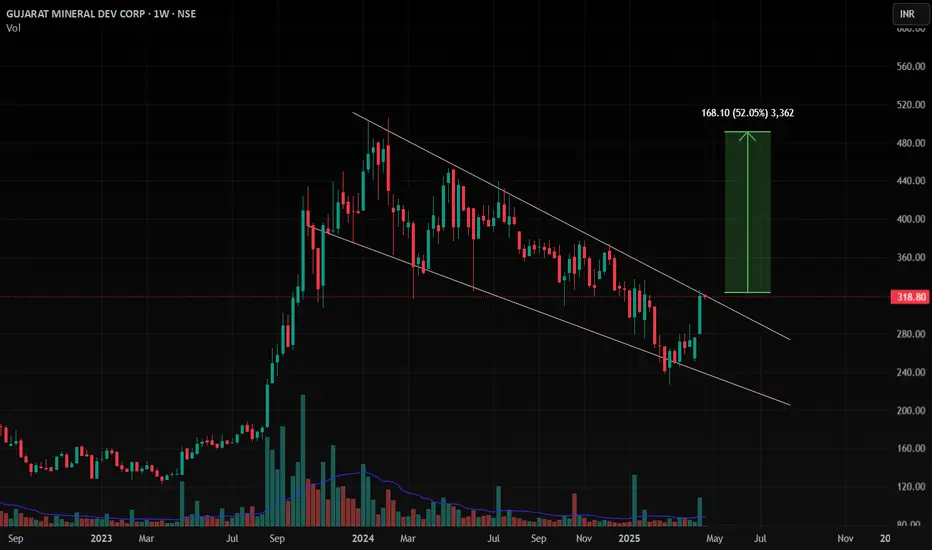
GMDC , 1WPattern is Looking very Great and is Ready to Breakout ,
if it broke the upper trendline with Good Volume then we can consider it is the best breakout
Follow for more Swing Ideas Like this
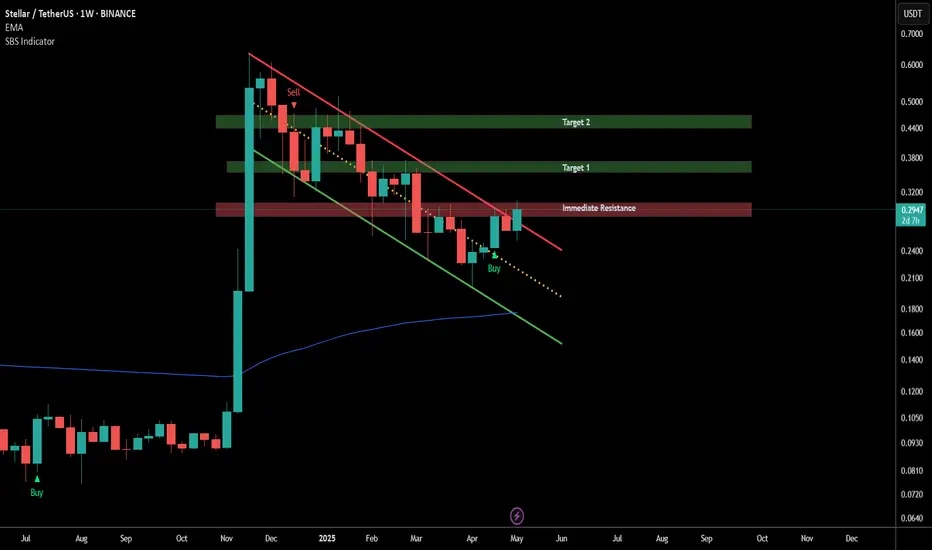
XLMUSDT – Weekly Chart Buy opportunityXLM is breaking out of a long descending channel on the weekly chart, showing the first signs of a trend reversal.
The SBS indicator flashed a Buy signal on this timeframe, adding strength to the setup.
Price is currently testing immediate resistance. A weekly close above this zone with substantial volume could confirm the breakout.
If confirmed, the next targets are:
Target 1: ~$0.38
Target 2: ~$0.47
Still early, but looks promising if we see continuation above the red zone.
Watch for breakout + volume = solid entry.
OG ANALYSIS📊 #OG Analysis
✅There is a formation of Descending Channel Pattern in daily time frame in #OG .
Also there is a perfect breakout and retest. Now we can expect a bullish move. If the price successful retest the major support zone then we will see more bullish move
👀Current Price: $5.226
🎯 Target Price : $6.152
⚡️What to do ?
👀Keep an eye on #OG price action and volume. We can trade according to the chart and make some profits⚡️⚡️
#OG #Cryptocurrency #Breakout #TechnicalAnalysis #DYOR

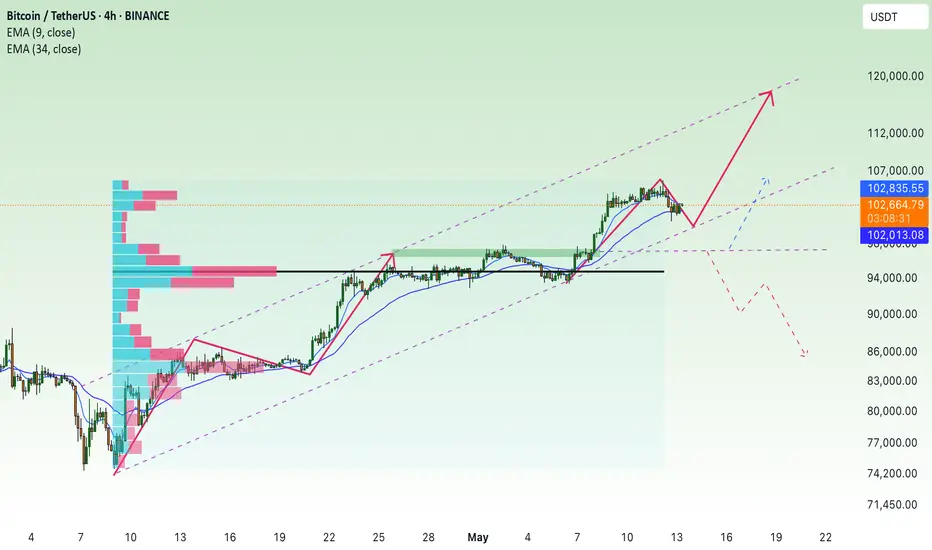
Can BTC reach new high?Notable news about BTC:
A sudden sell-off in cryptocurrency markets late Monday wiped out earlier gains, with over $500 million in long positions liquidated as Bitcoin (BTC) retreated from weekend highs. The downturn followed easing U.S.-China trade tensions, which appeared to shift investor sentiment away from risk assets.
According to Coinglass, more than $530 million in leveraged long positions were liquidated over the past 24 hours. Bitcoin-related futures accounted for nearly $200 million of that total, while Ether (ETH) products saw around $170 million in liquidations.
Liquidations occur when an exchange forcefully closes a trader’s leveraged position due to a drop in collateral value, typically triggered by sharp market moves. This mechanism kicks in when traders can no longer meet the required margin to sustain their open positions.
Technical analysis angle
As analyzed earlier after the price of BTC breaking the 96k landmark has returned to the period over 100k
Currently, the BTC price is still passing in the 105k resistance stage and the important trend of the trend of increasing at 98k
About 98k continues to consume the trend of this currency
With the current news and price lines, it will still be supporting the increase in the trend
==> Comments for trend reference. Wishing investors successfully trading
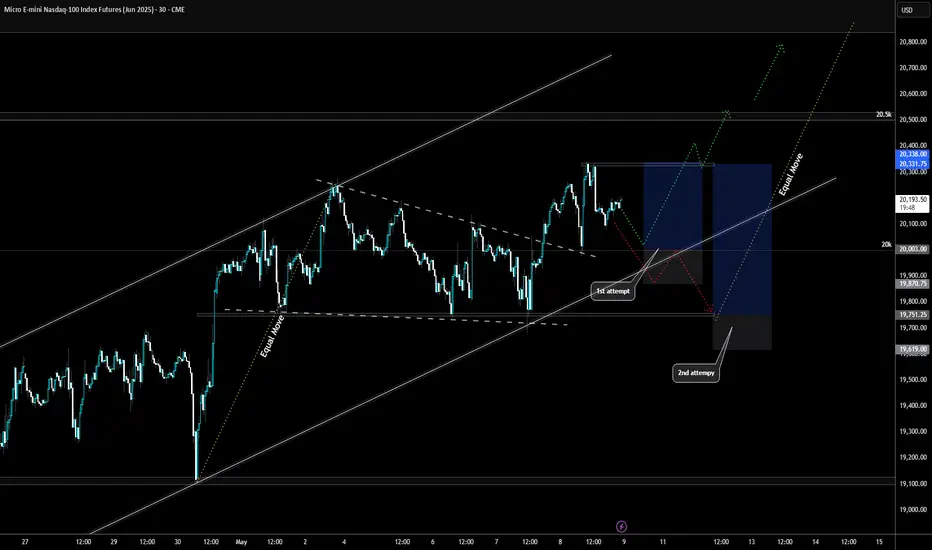
Two Shots at NQ: Because One's Never EnoughAlright, here’s the game plan – because let’s be honest, the market loves nothing more than pretending to break out, then snapping back just to mess with us.
🔥 The Setup:
I’m eyeing the Micro E-mini Nasdaq-100 Futures (June 2025), and I’m giving myself two shots at this breakout. Yeah, I know – ambitious. But the market’s been playing hard to get lately, so I’m hedging my enthusiasm.
💡 Why Two Long Entries?
Because, let’s face it, the first entry will probably get stopped out. I like to think of it as a “testing the waters” trade. If it works, great – I’m a genius. If not, well, it was just practice.
First Entry (The Optimist):
I’m jumping in if it breaks out, keeping the stop tight – because nothing says confidence like a cautious stop loss.
Second Entry (The Realist):
If the first entry faceplants, I’ll wait for the market to freak out and then calm down. Then, I’ll slide back in when it looks like it’s actually serious this time.
🧠 Managing the Chaos:
Short-Term Target: The last high – because if it doesn’t clear that, what’s the point?
Long-Term Target: The equal move – assuming the market doesn’t chicken out halfway.
Stop-Loss: Snug and sensible, because I’d rather not watch my account do a disappearing act.
Take profit targets are set where the equal move would complete – assuming the market cooperates for once.
💭 The Thought Process:
I’m not here to pretend I can predict the future – if I could, I’d be on a yacht, not posting on TradingView. But this setup gives me two chances to be right, which is at least one more than usual.
🔥 Your Thoughts?
If you’re also giving your trades a second (or third) chance, drop a comment. Or just let me know how your latest breakout fake-out went – because misery loves company. 😅
Momentum Rising – $XRP Bulls Eyeing Next Leg UpCRYPTOCAP:XRP is waking up 🔥
Price has broken out of the long-term downtrend and is now testing the important horizontal resistance area
A clean break above this range might spark the next big move. Volume is on the increase, and the structure is all good
Time to keep an eye on this one 👀

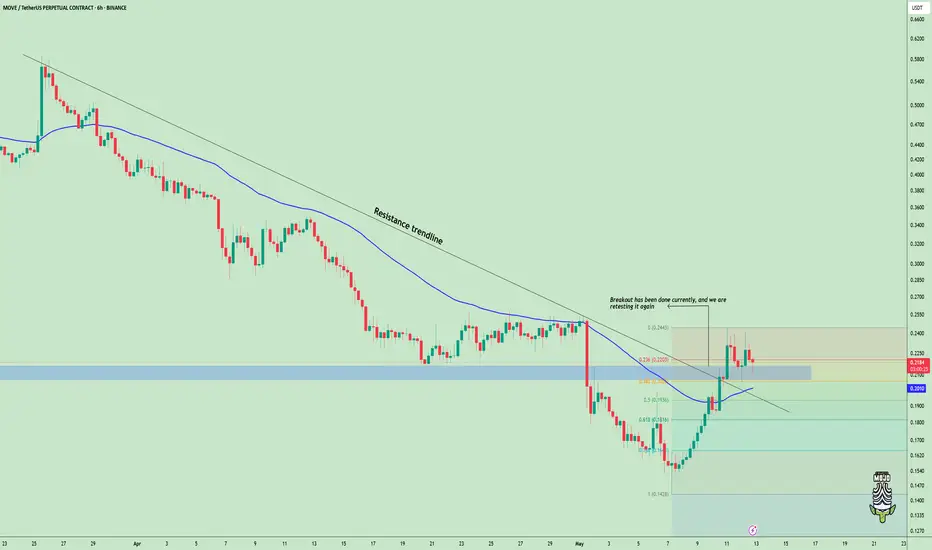
$MOVE Setup Looks Clean – Support Holding Strong!!TVC:MOVE busted out of the downtrend and is currently testing the resistance trendline as a support line✅
Price is remaining at the level of the 0.236 Fib and resting on a pivotal area the retest has the potential to prepare the ground for the next leg up to $0.24+.
DYOR, NFA
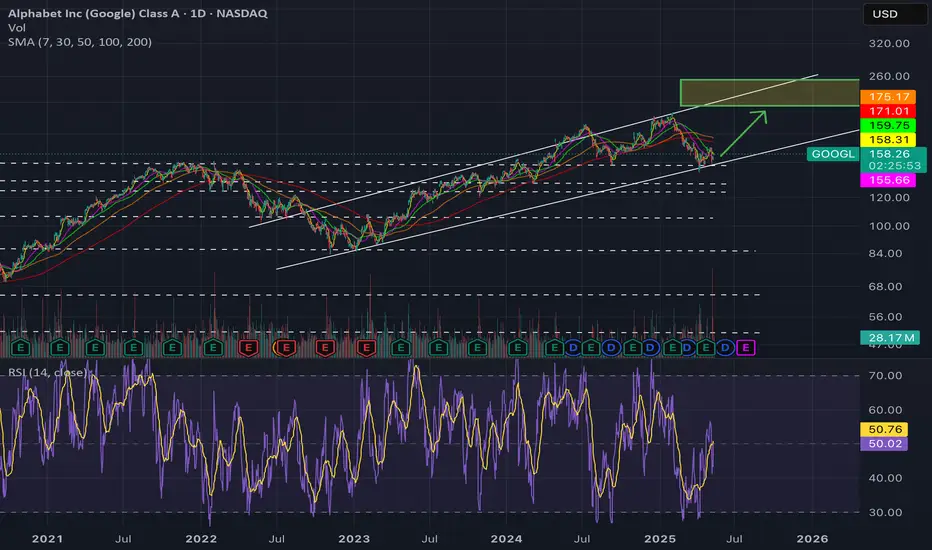
Long $GOOGL, Too much pessimism priced in!- NASDAQ:GOOGL is one of the hated FAANG often get hit in the crossfire of misinformation campaign be it Ads related or Search related.
- NASDAQ:GOOGL is a verb and has lot of things going in favour. Leader in Quantum Computing, Healthy Growth in Cloud Services, Leader in Adtech, De-facto standard for Searches.
- Gemini is a decent LLM and I am seeing diversification of LLMs in the industry.
- Waymo is leader in autonomous vehicles.
- Google has invested in the future like SpaceX which could easily multiply its investment.
Fundamentally,
Year | 2025 | 2026 | 2027 | 2028
EPS | 9.54 | 10.18 | 11.71 | 13.21
EPS% | 18.93% | 6.71% | 15.10% | 12.81%
Base Case (Forward p/e ~ 20 )
Year | 2025 | 2026 | 2027 | 2028
Stock Price | $190 | $203 | $234 | $264
Bear Case ( Forward p/e ~ 15 )
Year | 2025 | 2026 | 2027 | 2028
Stock Price | $143 | $152 | $175 | $198
Bull Case ( Forward p/e ~ 25 )
Year | 2025 | 2026 | 2027 | 2028
Stock Price | $238 | $254 | $292 | $330
Comfortable buying NASDAQ:GOOGL < 160 and targeting $210-220 in 1-1.5 year timeframe.
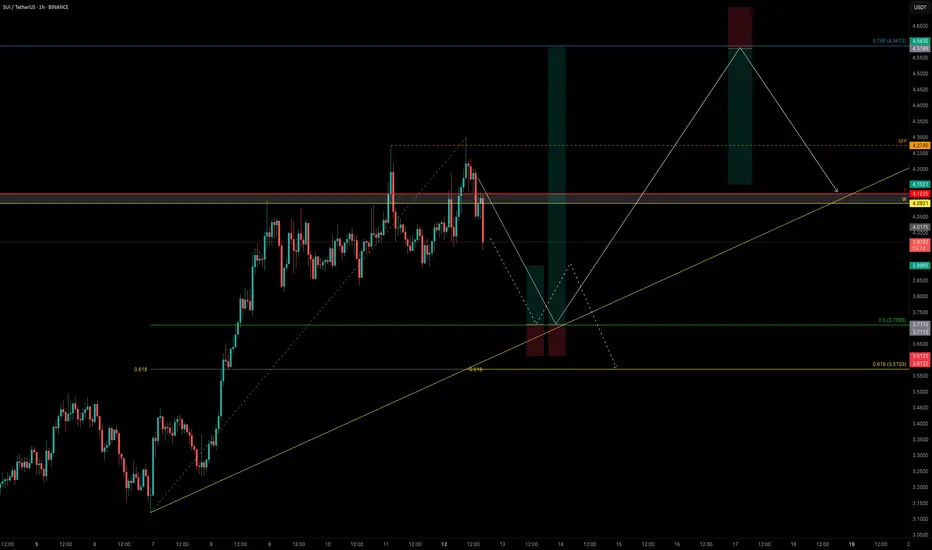
SUI Pullback in Motion — Here’s Where the Smart Money Loads UpSUI is showing signs of exhaustion after failing to convincingly reclaim recent highs. Today’s price action delivered a strong clue: a sweep of the key high at $4.274 followed by a sharp rejection — Swing Failure Pattern (SFP).
Momentum is fading as volume dries up, and bulls have lost control of major levels:
❌ Yearly Open at $4.1225
❌ Weekly Level at $4.0921
This suggests a deeper correction may be underway before SUI can attempt another leg higher.
📌 Liquidity & Fib Levels in Focus
There’s still significant liquidity resting below the $3.80 zone — and the market often seeks to sweep such areas before reversing. Taking the Fib retracement from the $3.12 low to the $4.2989 high, we can identify two critical zones for a potential long entry:
0.5 Fib Retracement → $3.7095
This level not only sits just below the $3.80 liquidity shelf but also provides a strong technical anchor. If SUI finds support here, it could offer a solid long opportunity.
🎯 Trade Setup from the 0.5 Fib ($3.7095)
Entry: Around $3.71
Stop-Loss: $3.612
Target 1: $3.90 → R:R ≈ 2:1
Target 2: $4.587 (0.786 Fib Retracement) → R:R ≈ 9:1
Key Note: Watch the volume on the bounce — strong reaction = continuation potential; weak reaction = deeper retrace risk
🔸 Golden Pocket (0.618–0.666) Zone → $3.57-$3.52
If the 0.5 Fib bounce fails or lacks volume confirmation, price may dig deeper into the golden pocket — a historically strong reversal area. This zone becomes your next high-probability long setup to monitor.
🧠 Summary & Strategy
SUI showed rejection via SFP at key high ($4.274)
Lacking volume for immediate continuation
Next key long opportunity: $3.71 (0.5 Fib), SL at $3.612
If weak, watch $3.57 (golden pocket) as secondary entry
R:R potential ranges from 2:1 up to 9:1 depending on bounce strength
Let price come to you. Monitor reactions at each zone and don’t trade blindly into weakness. This is where patience and precision pay off. 💡
___________________________________
If you found this helpful, leave a like and comment below! Got requests for the next technical analysis? Let me know.
Master HBAR with Fibonacci: The Golden Pocket BlueprintSince topping out at $0.20151, HBAR has spent the last nine days in a corrective pullback. Digging into a rich confluence of supports that offers a long trade setup. Here’s how to spot the high‑probability entries, manage your risk, and scale out for maximum reward.
Current Context
Two days ago, price was firmly rejected at the weekly open ($0.19029) right alongside the anchored VWAP drawn from the $0.28781 swing high.
HBAR now trades below the monthly open ($0.18210), the weekly open ($0.19029), and the daily open ($0.18024), sitting at about $0.177.
Just beneath today’s level lies the swing low at $0.17543. Breaching this could flush out stops before any meaningful bounce.
The Golden Support Zone
All signals converge between $0.170 and $0.1725:
The anchored VWAP from the $0.12488 low sits at around $0.17.
The 0.618 fib retracement of the $0.15396→$0.20239 move falls at $0.17246. Just under the swing low where the liquidity lies.
The secondary 0.666 fib retracement lands at $0.17014, reinforcing that floor.
Volume‑profile analysis of the past 27 days pins its Point of Control right at $0.17, great confluence with the anchored VWAP.
This “golden pocket” is your pivot for a low‑risk, high‑probability long.
Long Trade Setup
Ladder buy orders between the swing low ($0.17543) and the 0.666 fib at $0.17014.
Aim to average in around $0.1725.
Place a single stop‑loss just below $0.17
Scaling Your Exits
First Partial Exit at the monthly open ($0.18210). This offers roughly a 2:1 R:R.
Second Exit Zone around the weekly open and VWAP resistance (~$0.19) for about a 3:1 R:R.
Final Target at the 0.618 fib retracement of the entire down‑wave (from $0.28781 to $0.12488) near $0.2256. An astounding 10:1 payoff for the patient trader.
Keep in mind a potential false‑break (SFP) at $0.17543: if price briefly dips below then snaps back up, with increased volume.
Short Trade Setup
For traders looking to play the downside from the “golden pocket” flip, here’s a clear short strategy:
Entry Zone: Ladder short entries between the 0.618 fib at $0.22557 and the 0.666 fib at $0.23339.
Confluence: The 0.666 level aligns perfectly with the negative 0.618 fib from the prior swing, creating a resistance zone.
Stop‑Loss: Place your stop just above $0.23339, invalidating the confluence.
Take‑Profit: Target a return to around $0.206, where you can lock in gains as HBAR retests its previous high.
By scaling into shorts across that fib band, you balance your risk and capture the high‑odds reversal offered by stacked Fibonacci confluence. Let the golden pocket guide both your longs and shorts!
Key Takeaways
Confluence is king: VWAPs, Fibonacci retracements, Liquidity and volume‑profile all align in the $0.170–$0.175 zone.
Risk control: One stop‑loss under $0.17 protects the entire laddered entry.
Tiered targets: Small wins at $0.182, larger as you clear $0.19, and a big payoff if HBAR rallies toward $0.225. Trail your SL accordingly.
Patience pays: Wait for price to enter the golden pocket, avoid chasing!
With these confluences lining up and clear levels to work from, HBAR’s next high‑probability long setup is staring you in the face. Trade smart, size appropriately, and let the market reward your discipline.
Happy Trading!
___________________________________
If you found this helpful, leave a like and comment below! Got requests for the next technical analysis? Let me know.

SOL Hits Major Resistance — Patience Over FOMOOne of the most common mistakes traders make—especially in fast-moving markets—is jumping into trades impulsively at major resistance. It feels exciting when price is surging, but ironically, this is often where risk is highest and reward is most limited.
Why? Because historical resistance zones—like the $175–$183 region on SOL—tend to attract heavy sell pressure. These are levels where many past buyers look to exit, where smart money hunts liquidity, and where false breakouts are most common. Without volume confirmation and a proper retest, breakouts through such zones often fail.
That’s why experienced traders wait. The smarter approach is to let the market come to you, and only act when one of two things happens:
A pullback into a well-defined, confluence-rich support zone
A clean breakout above resistance, followed by a retest and confirmation
SOL has respected structure beautifully, but now is not the time to chase. Either wait for a healthy correction into support, or let price prove its strength through a confirmed breakout. No trade is also a trade — and capital preservation is the foundation of long-term success.
Patience isn’t passive — it’s a strategy. Let the market come to your desired levels. You don't need to catch every move, only the high-probability trades and there aren’t born from impulse — they’re built on patience, structure, and right timing. 💎
Technical Breakdown
SOL has entered a major resistance zone between $175 and $183 — a historically significant level respected for over a year.
Within this zone lie two key highs:
$179.85: Recently swept with a clean Swing Failure Pattern (SFP)
$180.52: Still untested — if broken, it would confirm a strong bullish continuation
Breaking through such a well-established resistance on the first attempt is uncommon — it typically requires momentum and structure. A rejection here would suggest that SOL needs a healthy correction before mustering the strength for a true breakout.
📉 Elliott Wave Count
Looking at the structure, we’ve completed a 5-wave sequence — signaling the potential end of this impulse leg. According to Elliott Wave Theory, a corrective phase is now expected before continuation.
📐 Additional Confluence: Fib Speed Fan
The 0.618 Fib Speed Fan — drawn from the all-time high at $295.83 to the swing low at $95.26 — aligns perfectly with this resistance zone, adding more weight to the idea of a potential rejection or pause.
🟢 Long Setup: The Next High-Probability Entry Zone
We now shift our focus to where the next long opportunity could arise. Here’s the technical confluence:
Anchored VWAP from the recent low at $141.41 sits at $164.70
4H bullish order block around $164.46
0.382 Fib retracement of the full 5-wave impulse: $165.42
0.412 Fib retracement: $164.25
All these levels converge in a tight band, providing a solid long entry zone between:
Long Entry Zone: $165.50 to $164.25
Stop-Loss: Below $160 (to protect against any deep wick)
Targets:
TP1: $171.75 (Point of Control from the range)
TP2: $180.00 (resistance retest)
TP3: $200.00 (psychological level)
Estimated R:R: ~6:1 — High-conviction setup
Bonus: If price returns to this $165 zone within 24 hours, it will also be supported by the 0.618 Speed Fan — adding one more layer of support.
🔴 Short Setup: Reversal Play at $200
For those watching from the sidelines or looking to fade the rally, the psychological level at $200 presents a strong short opportunity — but only on confirmation (e.g., SFP or bearish engulfing).
Short Entry: On rejection at $200
Stop-Loss: $206.10
Target: $187.00
Estimated R:R: ~2:1
🧠 Summary:
Completed 5-wave structure → potential correction phase underway
Strong resistance at $175–$183 with SFP and speed fan alignment
High-probability long setup at $165.5–$164.25 with multi-layered confluence
Potential short at $200 on confirmation
⚠️ Key Takeaway: Don’t Chase the Highs
This is where many traders slip — FOMOing into trades at major resistance. Please, don’t do it. Instead, wait for:
A pullback into well-defined support (like the $165 zone), or
A clean breakout above $180, followed by a confirmed retest
____________________________________
If you found this helpful, leave a like and comment below! Got requests for the next technical analysis? Let me know.
