CADJPY Expected Growth! BUY!
My dear friends,
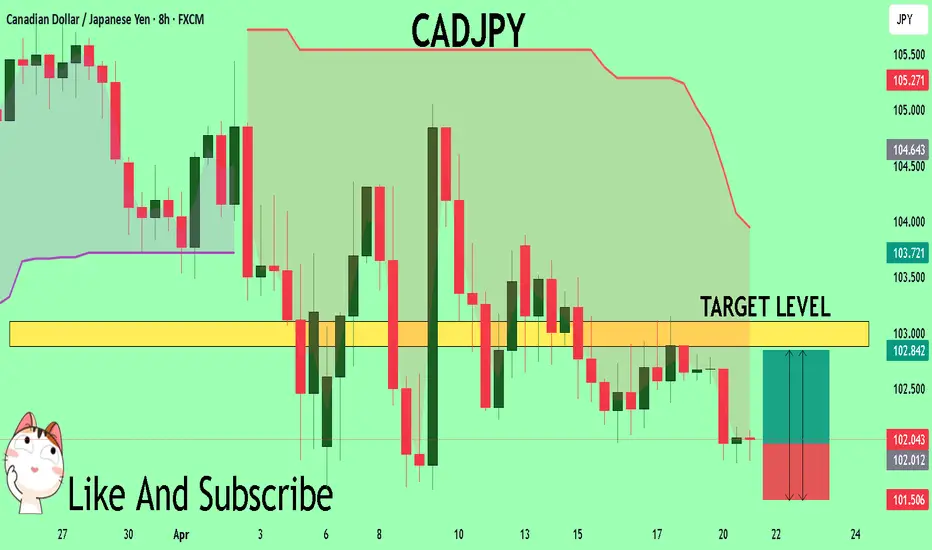
Please, find my technical outlook for CADJPY below:
The instrument tests an important psychological level 102.02
Bias - Bullish
Technical Indicators: Supper Trend gives a precise Bullish signal, while Pivot Point HL predicts price changes and potential reversals in the market.
Target - 102.88
Recommended Stop Loss - 101.50
About Used Indicators:
Super-trend indicator is more useful in trending markets where there are clear uptrends and downtrends in price.
———————————
WISH YOU ALL LUCK
Longsetup
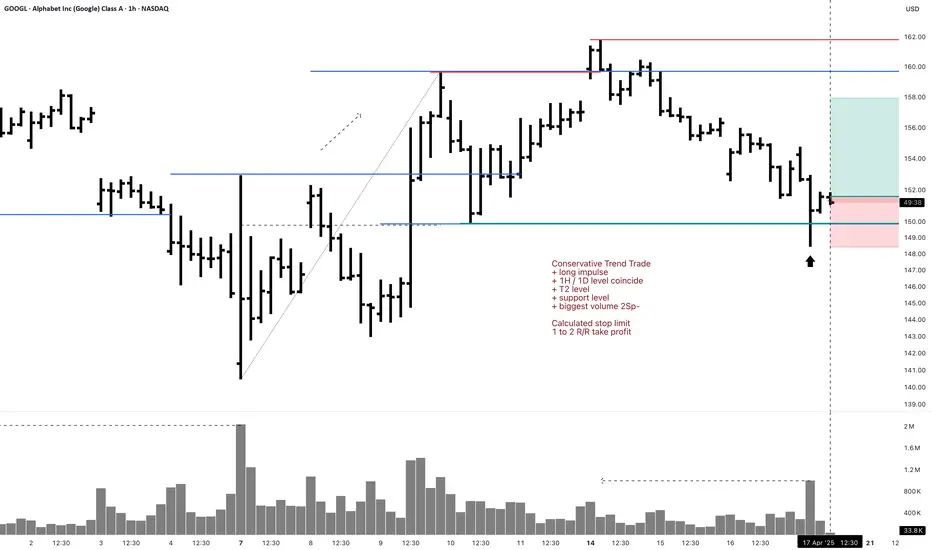
GOOGL 1H Swing Long Conservative Trend TradeConservative Trend Trade
+ long impulse
+ 1H / 1D level coincide
+ T2 level
+ support level
+ biggest volume 2Sp-
Calculated stop limit
1 to 2 R/R take profit
Daily Trend
"+ long impulse
+ JOC test / T2 level
+ support level
+ 1/2 correction"
Monthly Trend
"+ long impulse
+ T2 level
+ support level
- before 1/2 correction"
Yearly Trend
"+ long impulse
- T1 level
- resistance level"
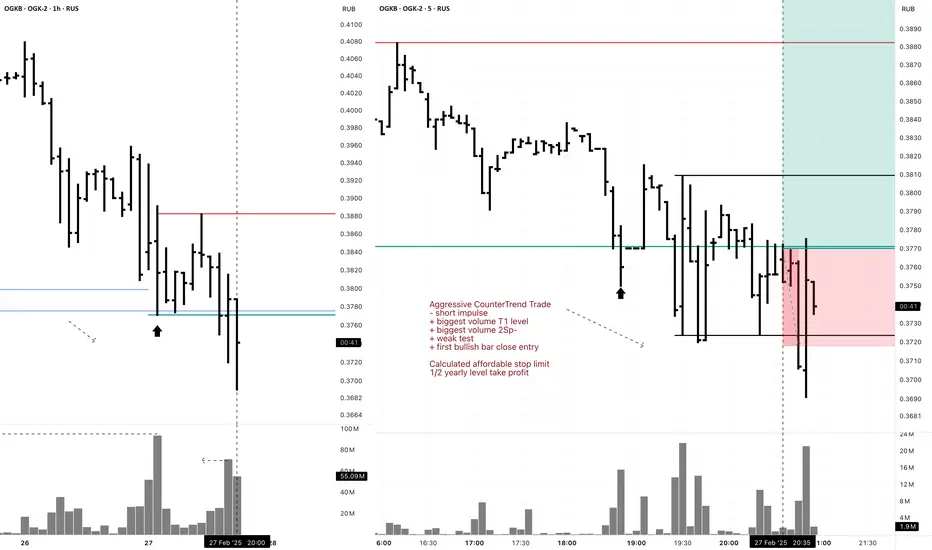
OGKB 5M Investment Aggressive CounterTrend TradeAggressive CounterTrend Trade
- short impulse
+ biggest volume T1 level
+ biggest volume 2Sp-
+ weak test
+ first bullish bar close entry
Calculated affordable stop limit
1/2 yearly level take profit at 0.459
1H Counter Trend
"- short impulse
+ biggest volume TE / T1 level
+ support level
+ volumed 2Sp-"
1D Trend
"+ long impulse
+ JOC level
+ support level
+ 1/2 correction
+ volumed manipulation"
1M Trend
"+ long impulse (in 1d 4h)
+ neutral zone"
1Y CounterTrend
"""- short impulse
+ 2Sp-
+ perforated support level"""
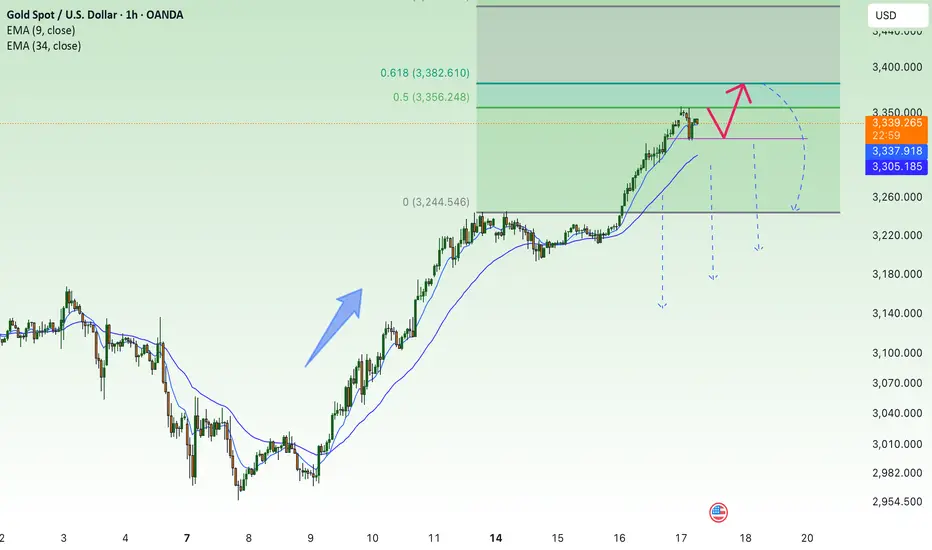
surpassing the old peak, gold price will reach above 3400 soon⭐️GOLDEN INFORMATION:
Gold price (XAU/USD) resumes its upward momentum, climbing to a fresh all-time high around $3,375 during Monday’s early Asian session, as markets reopen following the extended holiday weekend. The surge comes amid renewed investor appetite for safe-haven assets, fueled by ongoing geopolitical tensions and lingering uncertainty surrounding US President Donald Trump’s aggressive tariff agenda.
With fears mounting over the broader economic fallout from escalating trade conflicts, gold has soared over 25% year-to-date. “In today’s environment of intensifying tariff ambiguity, slowing global growth, sticky inflation, and rising geopolitical risks, the strategic case for increasing gold exposure has never been stronger,” noted analysts at UBS, emphasizing a shift toward diversification away from US assets and the US Dollar.
⭐️Personal comments NOVA:
Big increase, gold price continues to rise thanks to tariff momentum
⭐️SET UP GOLD PRICE:
🔥SELL GOLD zone : 3404- 3406 SL 3409 scalping
TP1: $3395
TP2: $3380
TP3: $3370
🔥SELL GOLD zone : 3415- 3417 SL 3422
TP1: $3405
TP2: $3390
TP3: $3370
🔥BUY GOLD zone: $3357 - $3355 SL $3350
TP1: $3365
TP2: $3380
TP3: $3405
⭐️Technical analysis:
Based on technical indicators EMA 34, EMA89 and support resistance areas to set up a reasonable BUY order.
⭐️NOTE:
Note: Nova wishes traders to manage their capital well
- take the number of lots that match your capital
- Takeprofit equal to 4-6% of capital account
- Stoplose equal to 2-3% of capital account

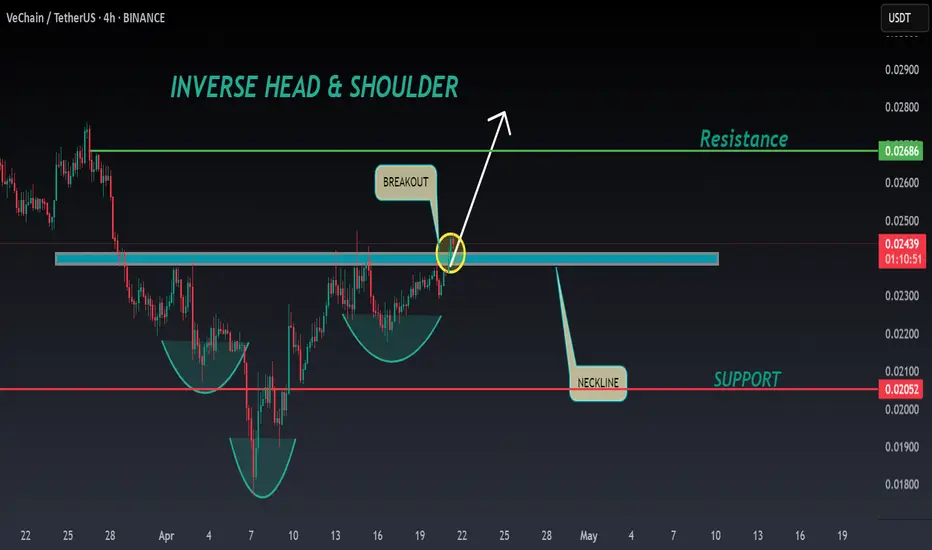
VET ANALYSIS🚀#VET Analysis : Pattern Formation
🔮As we can see in the chart of #VET that there is a formation Inverse Head And Shoulder Pattern and it's a bullish pattern. If the candle sustain above the neckline then a bullish move could be confirmed✅
🔰Current Price: $0.02435
⚡️What to do ?
👀Keep an eye on #VET price action. We can trade according to the chart and make some profits⚡️⚡️
#VET #Cryptocurrency #TechnicalAnalysis #DYOR
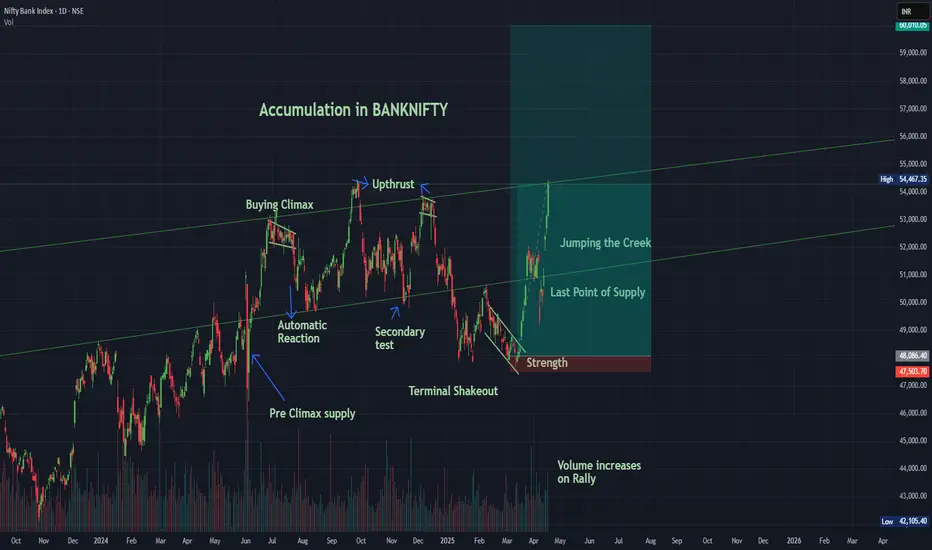
Accumulation in BANKNIFTY? a rally to 60,000 in near future?Bank Nifty has completed its range of accumulation and is headed for a rally to approx. target of 60k (most likely in strength by this quarter).
The Index was in Spring pad at 13th March,
Broken the Stride at 18th March
24th March was entering into the accumulation zone again in strength,
this all started with a Preliminary Climax price texture on 4th June, followed by a buying climax on 27th June, then an automatic reaction largest to its other price texture which completed on 6th August
a Terminal shakeout from 6th Jan to 11th March, Volume is Increasing on Rallies and reducing on Reactions
A Potential Target of 60,000 is on Cards, won't be surprised if this happens in the coming 2 months too
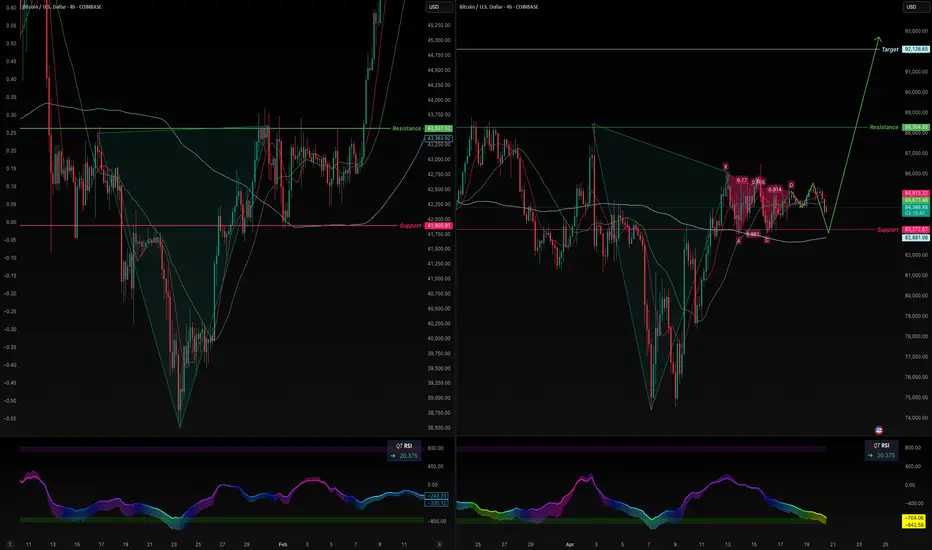
Bitcoin’s Breakout Blueprint: Eyeing $92KAs of April 20, 2025, Bitcoin (BTC) is trading around $84,500, having recently tested the $92,000 level multiple times. This price point is significant, serving as both a psychological barrier and a technical resistance level.
Technical Analysis:
Resistance and Support Levels: Bitcoin has encountered resistance near $92,000, a level that has been tested repeatedly. A sustained move above this could open the path toward $100,000 and potentially $108,000, the previous all-time high from December 2024. On the downside, support is observed around $85,650, aligning with the 200-day EMA. Further support lies at $78,000 and $74,500, marking previous consolidation zones.
Chart Patterns: The formation of a bullish pennant on the daily chart suggests potential for an upward breakout. If confirmed, this pattern could propel BTC toward $137,000 by Q3 2025.
Volume and Momentum: Recent trading volumes have been moderate, with a slight uptick during price advances, indicating growing buyer interest. Momentum indicators, such as the RSI, are neutral, leaving room for further price movements in either direction.
Fundamental Factors:
Institutional Inflows: Significant capital inflows into Bitcoin ETFs, exceeding $70 billion, have been observed, reflecting strong institutional interest.
CryptoRank
Macroeconomic Environment: Liquidity injections by the U.S. Treasury, amounting to $500 billion since February 2025, have increased market liquidity, which historically correlates with Bitcoin price appreciation.
Halving Effect: The April 2024 Bitcoin halving event has reduced the supply of new BTC, a factor that has historically led to substantial price increases in subsequent months.
Mid-Term Outlook:
Considering the technical and fundamental factors, Bitcoin's mid-term target remains at $92,000. A decisive break above this level could lead to a retest of the $100,000 psychological barrier and potentially higher targets. However, failure to maintain support above $85,650 may result in a consolidation phase or a retest of lower support levels.
Investors should monitor key resistance and support levels, institutional investment trends, and macroeconomic indicators to assess Bitcoin's trajectory in the coming months.
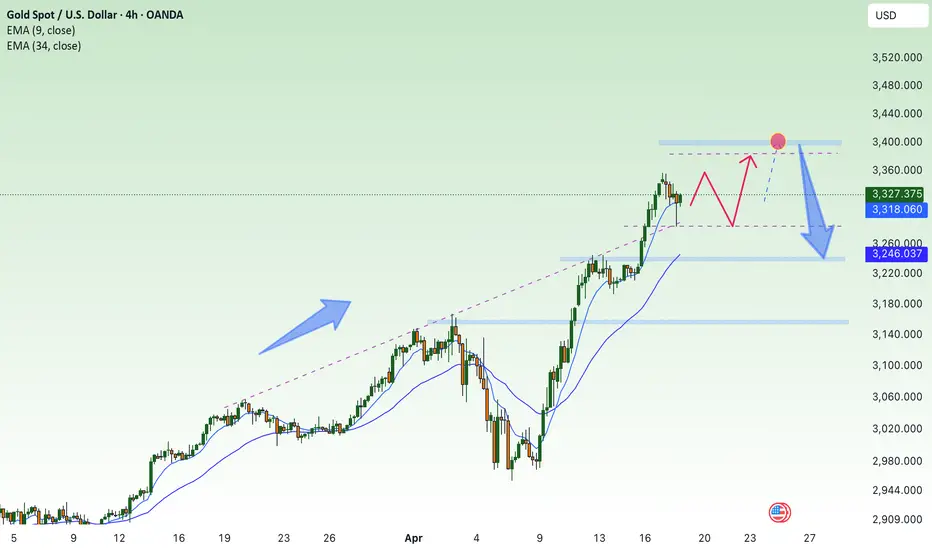
Gold bull cycle continues, 3400✍️ NOVA hello everyone, Let's comment on gold price next week from 04/21/2025 - 04/25/2025
🔥 World situation:
Gold prices are poised to close the week on a strong footing, gaining over 2.79% as the precious metal surged nearly $90 amid continued US Dollar (USD) weakness driven by lingering global trade uncertainties. At the time of writing, XAU/USD is trading around $3,326.
Despite touching a fresh all-time high of $3,358, the rally has cooled slightly as traders lock in profits ahead of the extended Easter weekend, with both European and US markets closed. Meanwhile, real yields have ticked higher, offering a modest headwind. On the policy front, San Francisco Fed President Mary Daly noted that the US economy remains resilient, though some segments are showing signs of slowing. She emphasized that monetary policy is still restrictive enough to keep inflation in check, while also suggesting that neutral rates could be on the rise.
🔥 Identify:
Gold price is still in a big uptrend, short-term corrections only make gold price accumulate more and continue to reach new ATH, tariffs are tense, gold price continues to increase strongly: 3382, 3400
🔥 Technically:
Based on the resistance and support areas of the gold price according to the H4 frame, NOVA identifies the important key areas as follows:
Resistance: $3357, $3382, $3400
Support : $3284, $3236, $3155
🔥 NOTE:
Note: Nova wishes traders to manage their capital well
- take the number of lots that match your capital
- Takeprofit equal to 4-6% of capital account
- Stoplose equal to 2-3% of capital account
- The winner is the one who sticks with the market the longest
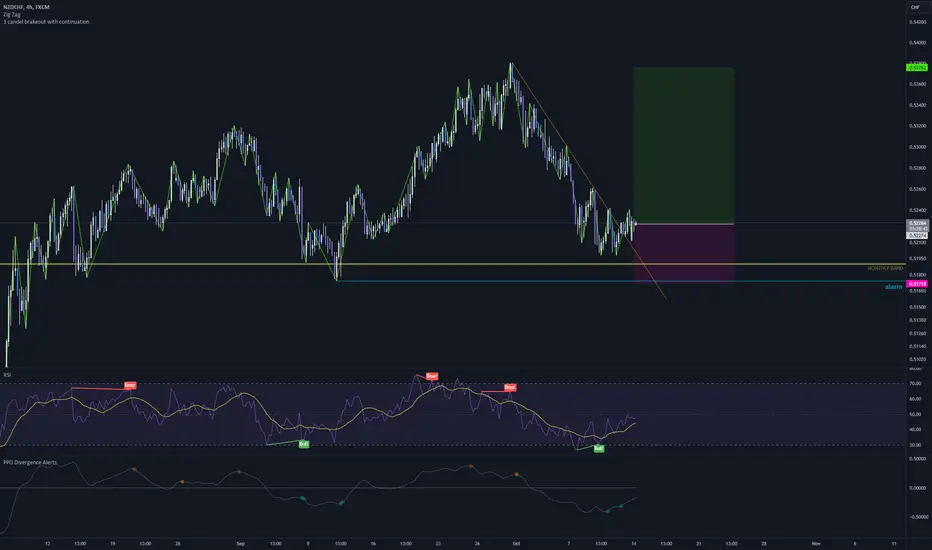
NZDCHF LONGi enter NZDCHF long, i see trend line brake on 4h, bullish divergence on RSI. on 4h i dont see trend brake yet so that is why i put SL on prevous DAILY level.
On daily looks like bullish divergence on Stochastic but not so clear.
will see how this will work out.
$SHAK at a $80 support, buy areaHello, looking at the Daily and Weekly, the Elliot Wave seems to be finishing up and I think this name got sold off from highs like everything else but a good name nonetheless. Fundamentally and technically name looks good for long setup to the $90s then $100.
WSL

3382 , next ATH number today, GOLD⭐️GOLDEN INFORMATION:
Gold price (XAU/USD) enters a phase of consolidation on Thursday, trading within a narrow range near its all-time high reached during the Asian session, as investors digest conflicting market signals. Stronger-than-expected US Retail Sales figures and hawkish remarks from Federal Reserve (Fed) Chair Jerome Powell have lent support to the US Dollar (USD), curbing some of gold’s upside momentum. Meanwhile, the upbeat sentiment across equity markets and mildly overbought technical conditions are prompting traders to remain cautious, limiting fresh buying interest in the precious metal for now.
⭐️Personal comments NOVA:
Gold price continues to increase today, the fomo still has no end, pay attention to the new ATH price zone 3382
⭐️SET UP GOLD PRICE:
🔥SELL GOLD zone : 3381- 3383 SL 3388
TP1: $3370
TP2: $3355
TP3: $3333
🔥BUY GOLD zone: $3302 - $3300 SL $3295
TP1: $3310
TP2: $3320
TP3: $3330
⭐️Technical analysis:
Based on technical indicators EMA 34, EMA89 and support resistance areas to set up a reasonable BUY order.
⭐️NOTE:
Note: Nova wishes traders to manage their capital well
- take the number of lots that match your capital
- Takeprofit equal to 4-6% of capital account
- Stoplose equal to 2-3% of capital account
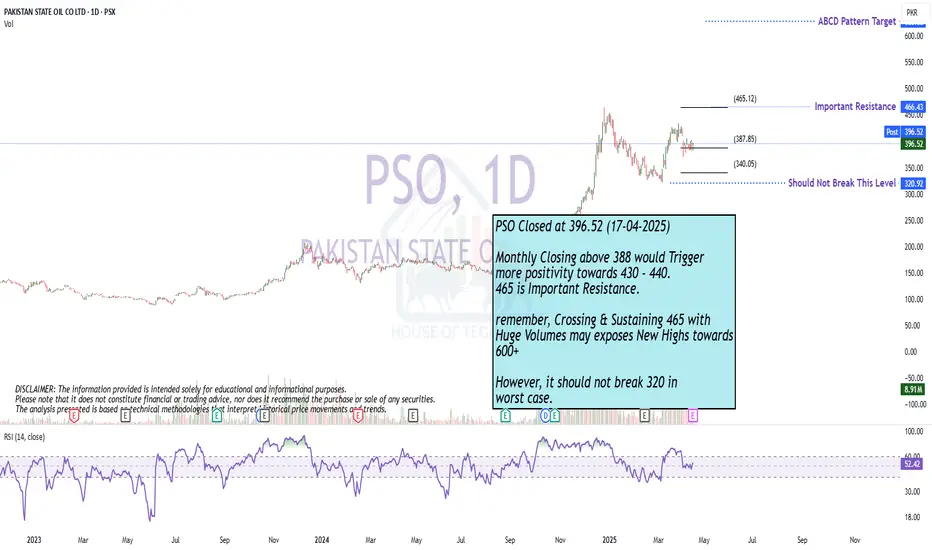
ABCD Pattern Intact
Monthly Closing above 388 would Trigger
more positivity towards 430 - 440.
465 is Important Resistance.
remember, Crossing & Sustaining 465 with
Huge Volumes may exposes New Highs towards
600+
However, it should not break 320 in
worst case.
US30 Long 15 & 5 min
BLACKBULL:US30
We can see 2 relatively equal lows, which to my opinion may get swept to fill the fair value gap below, and then react to the point that we sweep the swing high

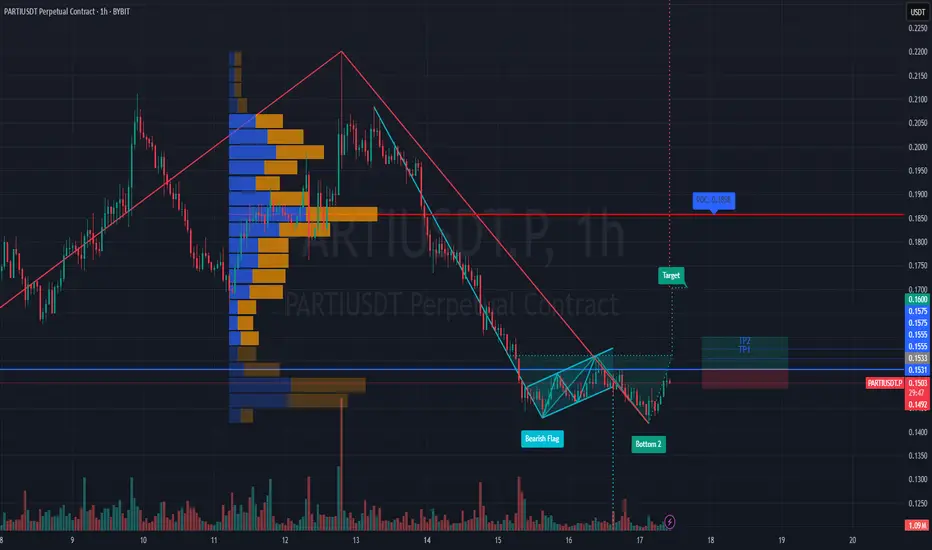
#PARTIUSDT is showing signs of a reversal🚀 The price BYBIT:PARTIUSDT.P is showing signs of a reversal after a prolonged downtrend.
🚀 The scenario becomes more likely if the price holds above $0.1520 with increasing volume.
🚀 Watch for a breakout and confirmation above the $0.1500–$0.1520 zone — this would strengthen the bullish setup.
🚀 If volume picks up during the continuation of the move, a quick push toward $0.18 is possible.
📈 LONG BYBIT:PARTIUSDT.P from $0.1533
🛡 Stop loss: $0.1492
🕒 Timeframe: 1H
✅ Overview:
➡️ The price has broken out above the Bearish Flag, confirming a break in the downtrend structure.
➡️ The Double Bottom formation increases the likelihood of an upward move.
➡️ Entry at $0.1533 is just above the resistance zone and confirms the breakout.
➡️ The upward potential remains toward $0.1600 and beyond, aiming for the POC volume area.
🎯 TP Targets:
💎 TP 1: $0.1555
💎 TP 2: $0.1575
💎 TP 3: $0.1600
📢 Support zone: $0.1500–$0.1510 — must hold to maintain the bullish structure.
📢 If price consolidates above $0.1555, expect a potential acceleration toward $0.1600.
📢 A drop below $0.1492 invalidates the scenario — stop is mandatory.
🚀 BYBIT:PARTIUSDT.P breaks key level — bullish signal confirmed! Watch for continuation!
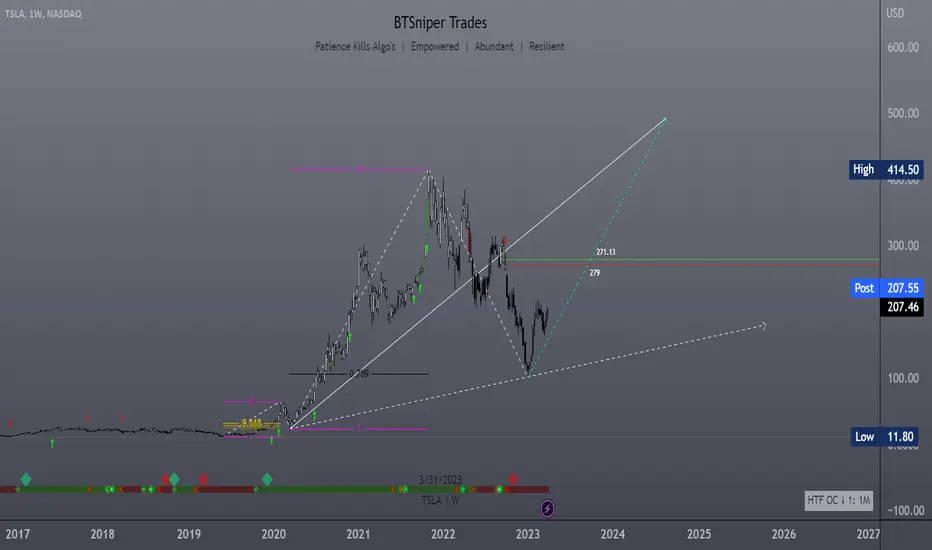
TESLA | Weekly HTF TargetAfter having a deep retracement ~70% tesla looks ready to reach Higher Highs...
New High target: $490+
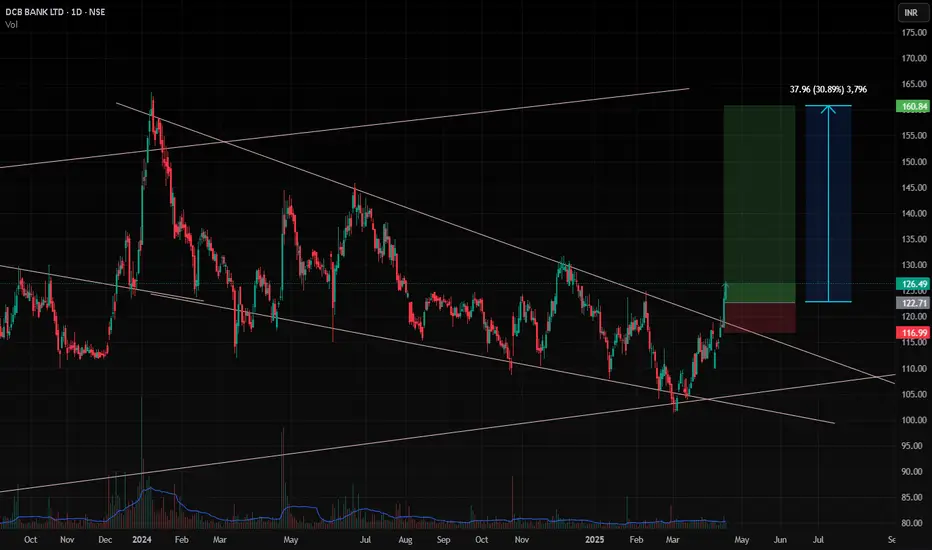
DCBBank, 1DBreakout from Pattern is very Good ,
Can Enter if you u want to take Small Risk than Usual , then you can consider
Actually it is Bit late Entry or you can Avoid it if your risk is high
Follow for more Swing Ideas Like this
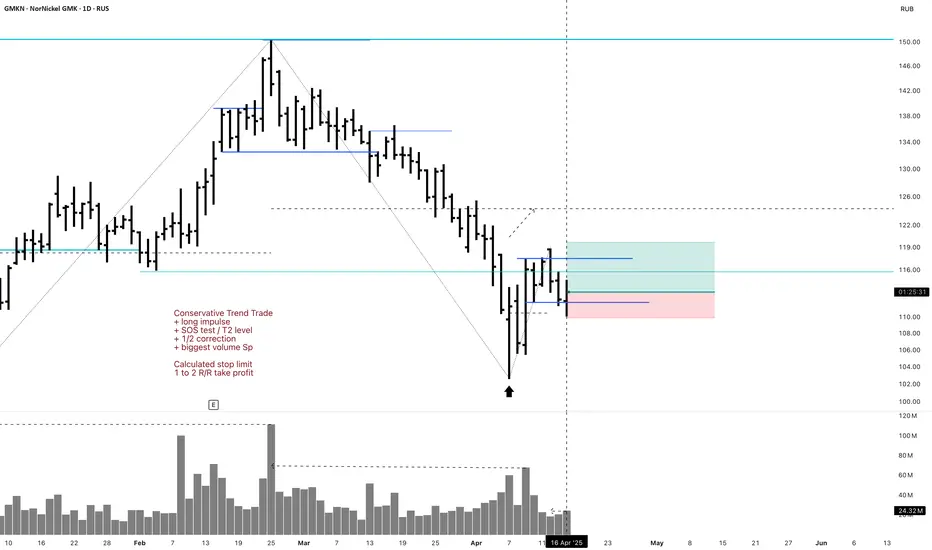
GMKN Long 1D Investment Conservative Trend TradeConservative Trend Trade
+ long impulse
+ SOS test / T2 level
+ 1/2 correction
+ biggest volume Sp
Calculated stop limit
1 to 2 R/R take profit
Monthly Trend
"+ long impulse
- SOS reaction bar level
+ 1/2 weak correction"
Yearly Trend
"+ long impulse
- below SOS
+ 1/2 correction"
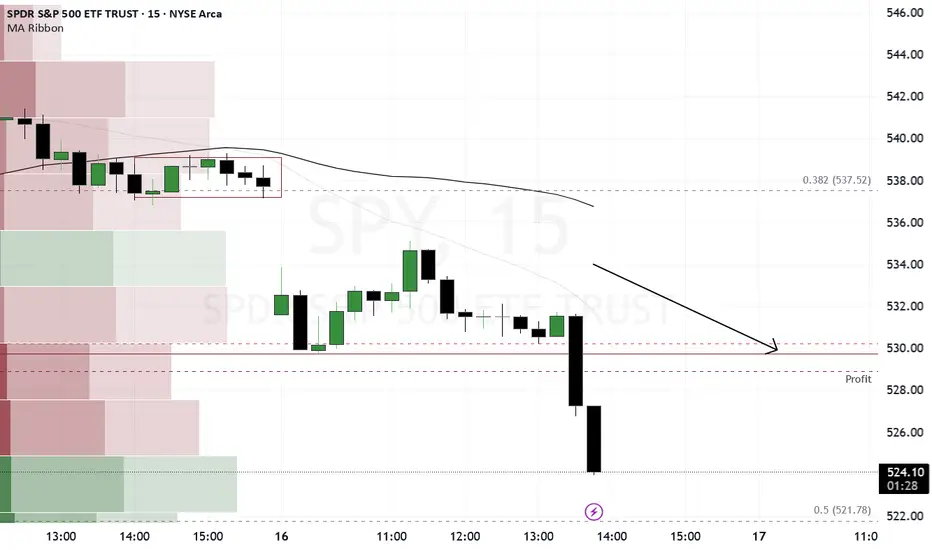
A break back above 530 could trigger a move toward 550Look for a strong move higher if the market breaks back above 530. Currently falling on below average volume and could see the market recover abruptly.
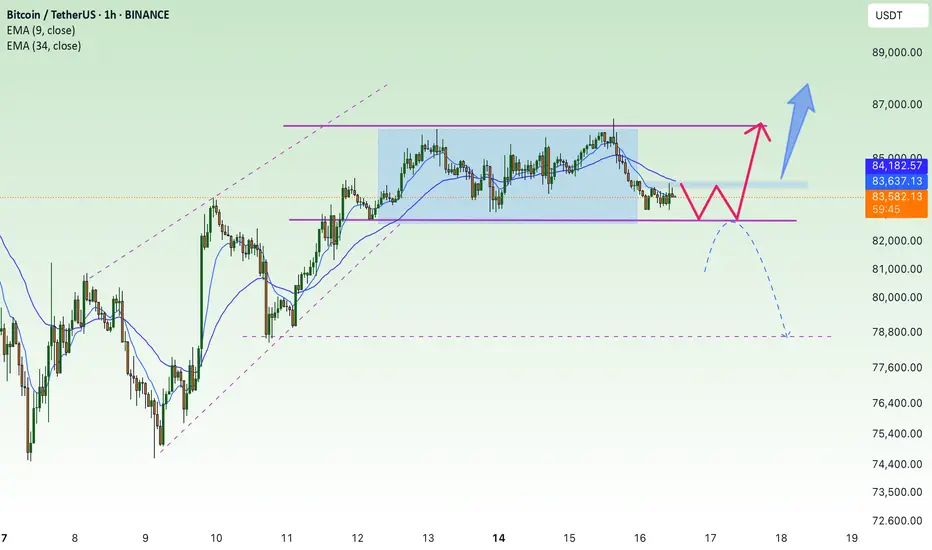
Waiting for a big boost for the market, over 90K BTC💎 BTC PLAN UPDATE (April 16)
First of all, congratulations to the investors. Everything went according to our trading plan and we had very good comments. Specifically, yesterday the price fell from the 86k area straight to 83k. We had more than 3000 prices together. Today's BTC trading plan did not change much.
NOTABLE NEWS ABOUT BTC:
According to Bloomberg, Bitcoin (BTC) mining hardware manufacturer Bitdeer is preparing to launch its own mining operation in the United States (US). The company intends to speed up the shipment of equipment following President Donald Trump's announcement of a 90-day tariff suspension. In addition, the pressure from tariffs has led to a decrease in Bitcoin mining hashrate among miners in the United States over the past month.
TECHNICAL VIEW
Bitcoin has faced multiple rejections around the 200-day exponential moving average (EMA) at $85,000 since Sunday. On Tuesday, BTC attempted to break above this level but was rejected and fell 1.12%. At the time of writing on Wednesday, the price was hovering around $83,500.
If BTC closes above $85,000 on a daily basis, it could extend its rally to the psychologically important $90,000 level. A successful close above this level could extend the rally to test the March 2 high of $95,000.
Please continue to pay attention to the 84.2k resistance zone, this is an important resistance zone before we DCA to higher and more important areas
==> Comments are for reference only. Wish investors successful trading
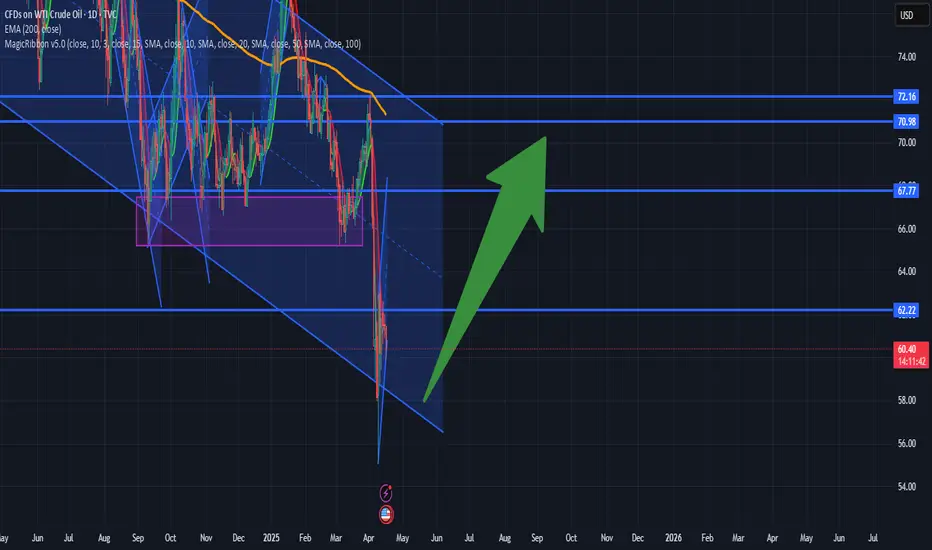
OIL go UPWTI crude oil has recently shown signs of stabilizing after a period of volatility driven by geopolitical tensions and shifting demand expectations. While supply concerns and OPEC+ decisions continue to influence price movements, the broader macroeconomic indicators—such as signs of a soft landing in the U.S. economy and resilient global demand—are starting to create a more bullish environment.
In my view, WTI is likely to start strengthening from current levels. The technical setup suggests a potential reversal, with support holding and momentum indicators turning upward. If prices break above key resistance zones, we could see a sustained move higher.
Overall, I believe it's a good time to consider a long position on WTI.
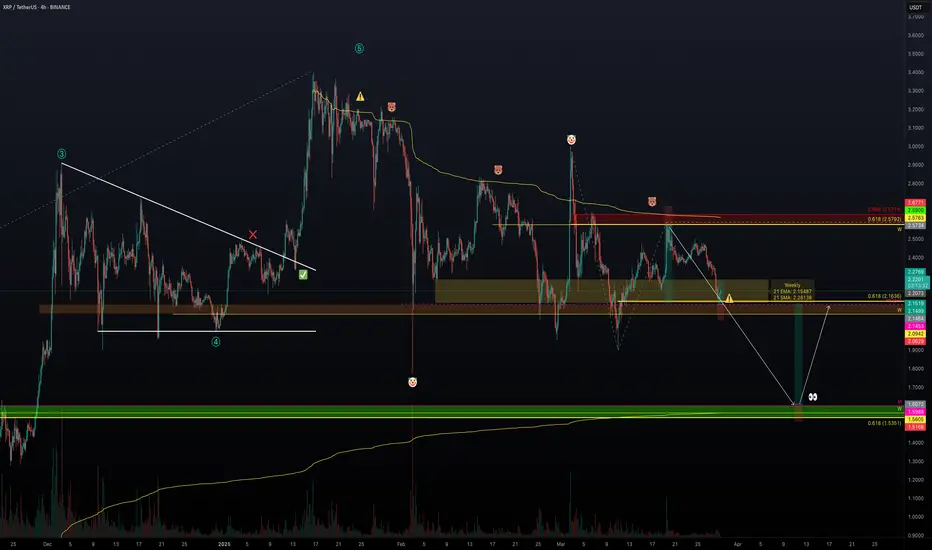
XRP - Choppy Market, Will We See $1.5 Again?After finishing the 5-wave structure in early 2025, XRP had a rough patch, trading between $3 and $2 and offering some pretty neat swing trade opportunities. Now, two months later, the big question is: will this range continue, or is a breakout on the horizon? Let’s break down the key levels and high-probability setups.
Short Trade Setup
Resistance Zone:
The weekly level and the 0.618 Fibonacci retracement are both around $2.5763 to $2.5792, aligning nicely with each other.
The anchored VWAP from the all-time high at $3.4 adds extra resistance at about $2.63.
Setup Details:
A low-risk short trade can be considered at the weekly level, with a stop-loss set above both the anchored VWAP and the swing high.
Target: The monthly open, aiming for an R:R of about 4:1.
Support Backup:
Additional support in this range comes from the 0.618 Fibonacci retracement (from a low at $1.9 to a high at $2.59), the weekly 21 SMA at $2.28, and a weekly level at $2.0942 just below the monthly open.
This support between the weekly level at $2.0942 and the monthly open is crucial for maintaining bullish momentum. If it holds, the bearish short setup stands; if it breaks, things could get tricky.
Long Trade Setup
When to Consider a Long:
If the support zone mentioned above fails, look for a long trade opportunity at the swing low around $1.77.
Support Confluence:
Primary Support: The swing low at $1.77, with lots of liquidity around that area.
Additional Layers:
The monthly level at $1.5988.
The weekly level at $1.5605 sits just below the monthly.
The 0.618 Fibonacci retracement from the 5-wave structure at $1.5351.
Anchored VWAP from the low at $0.3823, aligning with the weekly level.
And don’t forget the psychological level at $1.5.
Setup Details:
This long trade setup would offer an attractive R:R of roughly 6:1, targeting back to the monthly open for an approximate 33% gain, with a stop-loss placed below the $1.5 mark.
XRP's current trading range has provided some good short and long trade setups, a long opportunity at the swing low ($1.77-$1.5) could be the next big play. Whether you lean towards short or long, finding these confluence zones helps in making more informed, high-probability trade decisions.
If you found it helpful, please leave a like and a comment. Happy trading!
HEG Limited Stock Analysis [Fundamental+Technical]Company Overview:
Industry: Graphite Electrodes (used in Electric Arc Furnaces for steel production)
Parent Group: LNJ Bhilwara Group
Location: Largest graphite plant at a single location near Bhopal, MP
Global Reach: 67% export-based; presence in 35+ countries
Business Highlights
Products: UHP & HP Graphite Electrodes
Customers: Top 25 global steel companies
Capacity: Increased to 100,000 TPA in Nov 2023
Utilization: 81% (despite global slowdown)
Revenue from Operations: ₹2,394.90 Cr
Net Profit: ₹231.54 Cr (down 49% YoY)
EBITDA: ₹525.63 Cr (down 28% YoY)
EPS: ₹59.99
Net Cash Flow from Operations: ₹615 Cr (up from ₹114 Cr)
ROCE: ~7.2%
Return on Net Worth (RoNW): 5.63%
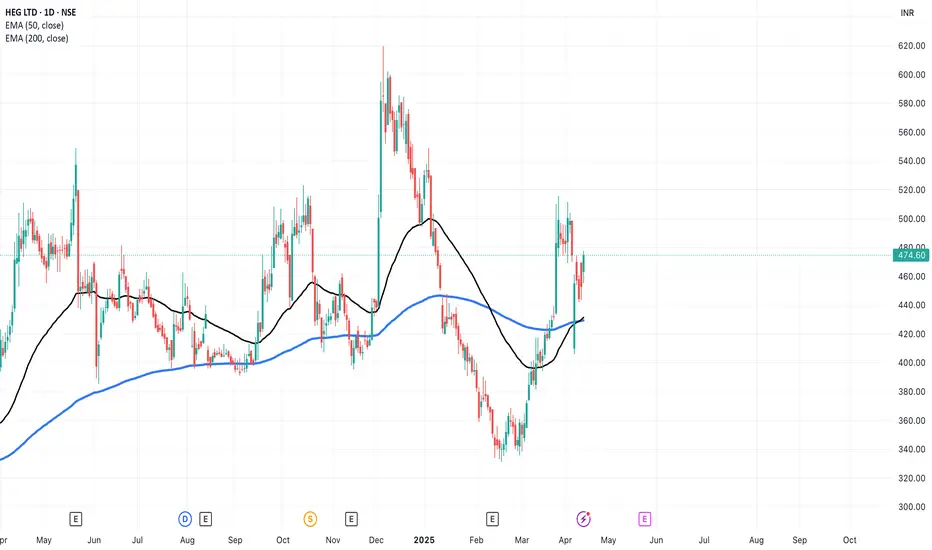
📈 Technical Insights:
Current Price: ₹474.60
50 EMA: ₹431.44 (support zone)
200 EMA: ₹429.40 (support zone)
Price is trading above both EMAs, indicating a bullish trend reversal.
Golden Cross formation (50 EMA crossing 200 EMA) recently occurred — a classic long-term bullish signal.
The stock bounced from ₹400 zone and now forming higher highs.
Key Strengths
One of the lowest-cost graphite electrode producers globally
Among top 5 global players (ex-China)
Strong relationships with major steelmakers
Backward integrated captive power: 76.5 MW
State-of-the-art technology and high R&D focus
Key Risks
Highly dependent on steel sector demand
Pricing pressure due to global oversupply and China's export surplus
Needle coke (key raw material) cost volatility
Current underutilization of capacity
Growth Triggers
Green Steel Push: EAF-based steel production expected to grow globally
Anode Powder Plant: ₹1,800 Cr investment in 20,000 TPA facility for EV battery anode materials; revenue expected from FY27
India’s EV & Steel Boom: Growing steel consumption (8.2% CAGR) and EV transition are long-term positives
SWOT Summary
Strengths:
Global presence, high export revenue, low-cost structure
Technological leadership
Weaknesses:
Profitability linked closely to global steel demand
Volatility in raw material prices
Opportunities:
EV market and EAF steel expansion
Threats
Competition from China, diversion of raw material to battery sector
Future Outlook
Near-term challenges due to soft steel demand
Medium to long-term outlook is strong, driven by:
Increasing EAF penetration
Global decarbonization policies
Strategic expansion into EV-grade graphite anodes
Analysis Based on Valuation + Chart
CMP:₹474.60
Fair Price Range: ₹600 – ₹1200(Using a conservative P/E range of 10 to 20)
Fair Value (DCF):₹1100+ (Based on 10% projected EPS growth over 5 years and a 12% discount rate.)
Support Levels:₹430 (EMA), ₹400 (price action)
Resistance Zones:₹490-500 (near-term), ₹600 (supply zone)
Disclaimer
The information provided in this report is for educational and informational purposes only and should not be construed as financial or investment advice. While every effort has been made to ensure the accuracy of data and analysis, no guarantees are made regarding future performance. Stock market investments are subject to market risks, including potential loss of capital. Please consult your financial advisor or conduct your own due diligence before making any investment decisions.
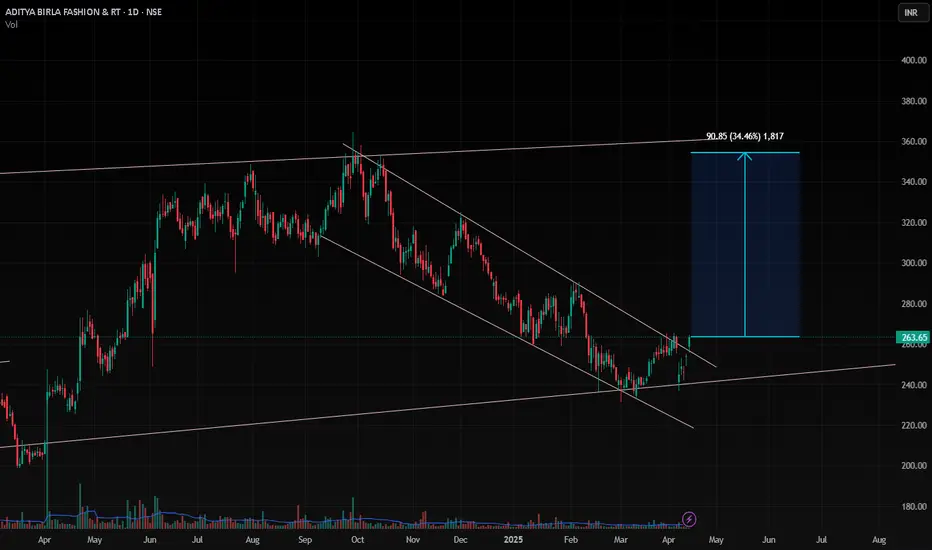
ABFRL , 1D Looking Very good pattern and ready for Breakout and Nifty is also Showing Bullishness , So Breakout will be very Clear and Good
Take Entry after the break of upper trendline and risk according to your risk taking capacity
in Expansion Channel this is channel Pattern and Breakout in 1D time Frame .
just risk 3-4 % of your allocation and Aim for 30% Maximum . You can book partial profits if it goes above 15% .
if it closes below the down trendline , you must be not in the trade
This is Just my point of View only
Follow for More Swing Trade Ideas