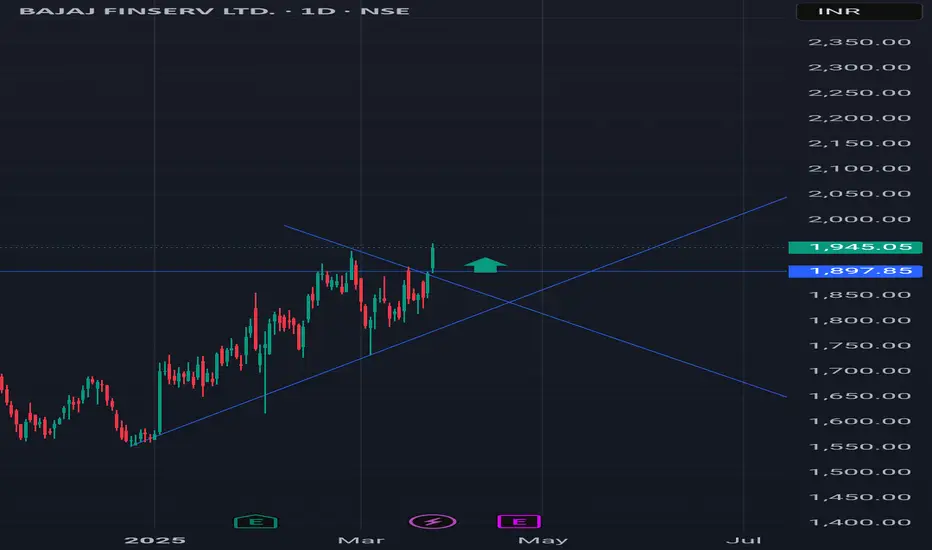
Bajaj Finserv Breakout Bajaj Finserv Breakout Level
Buy it from 1950
Stoploss 1845
Target 2130,2340,2560
Longsetup
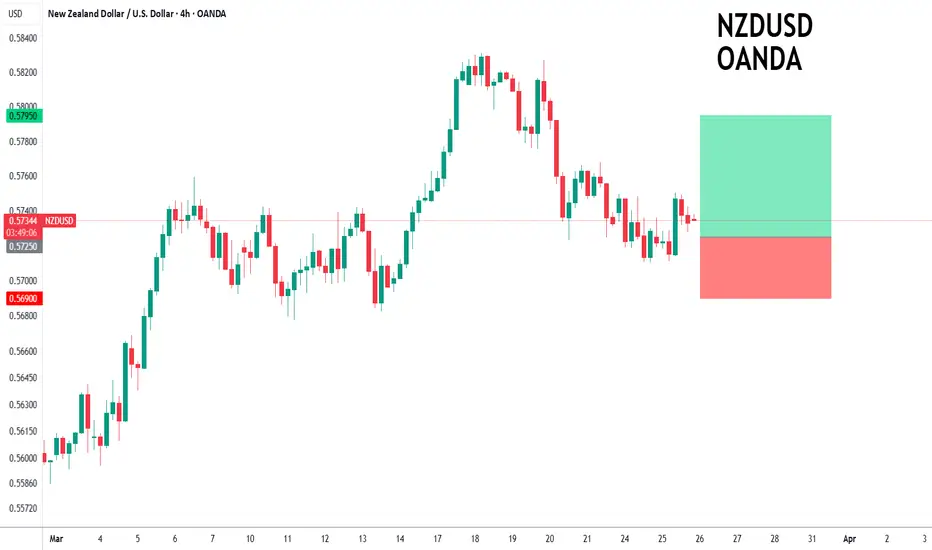
NZDUSD to find buyers at market price?NZDUSD - 24h expiry
Price action has stalled at good support levels and currently trades just above here (0.5725).
We expect a reversal in this move.
Risk/Reward would be poor to call a buy from current levels.
A move through 0.5775 will confirm the bullish momentum.
The measured move target is 0.5800.
We look to Buy at 0.5725 (stop at 0.5690)
Our profit targets will be 0.5795 and 0.5800
Resistance: 0.5775 / 0.5795 / 0.5800
Support: 0.5725 / 0.5700 / 0.5690
Risk Disclaimer
The trade ideas beyond this page are for informational purposes only and do not constitute investment advice or a solicitation to trade. This information is provided by Signal Centre, a third-party unaffiliated with OANDA, and is intended for general circulation only. OANDA does not guarantee the accuracy of this information and assumes no responsibilities for the information provided by the third party. The information does not take into account the specific investment objectives, financial situation, or particular needs of any particular person. You should take into account your specific investment objectives, financial situation, and particular needs before making a commitment to trade, including seeking advice from an independent financial adviser regarding the suitability of the investment, under a separate engagement, as you deem fit.
You accept that you assume all risks in independently viewing the contents and selecting a chosen strategy.
Where the research is distributed in Singapore to a person who is not an Accredited Investor, Expert Investor or an Institutional Investor, Oanda Asia Pacific Pte Ltd (“OAP“) accepts legal responsibility for the contents of the report to such persons only to the extent required by law. Singapore customers should contact OAP at 6579 8289 for matters arising from, or in connection with, the information/research distributed.
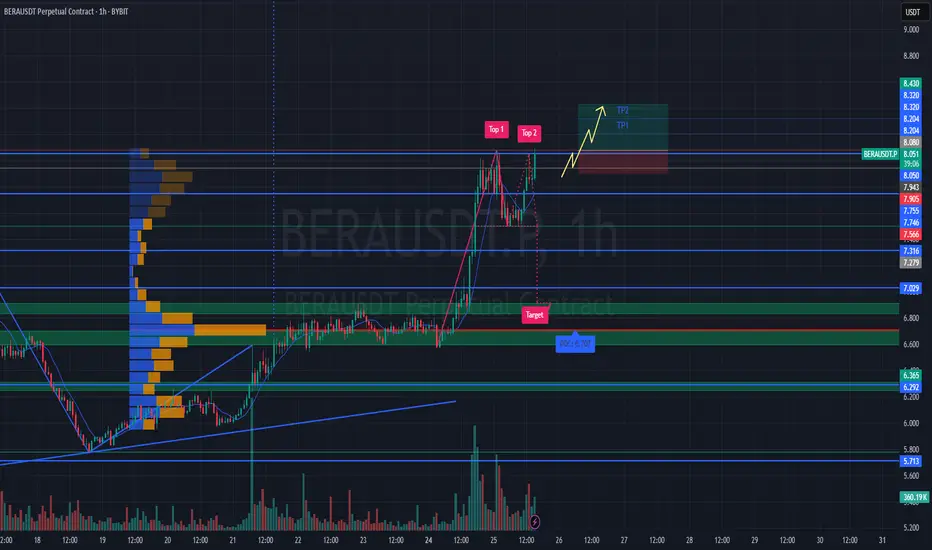
#BERAUSDT shows bullish momentum 📈 Long BYBIT:BERAUSDT.P from $8.080
🛡 Stop loss $7.905
🕒 1H Timeframe
⚡️ Overview:
➡️ The main POC (Point of Control) is at 6.699, indicating the area of highest volume accumulation.
➡️ The 7.905 level acts as the nearest support zone and is a key stop-loss reference point.
➡️ The chart BYBIT:BERAUSDT.P shows a strong bullish breakout with consolidation above previous range, signaling a possible trend continuation.
➡️ Rising volume confirms strength behind the move.
🎯 TP Targets:
💎 TP 1: $8.204
💎 TP 2: $8.320
💎 TP 3: $8.430
📢 Watch key levels closely — better to enter after signal confirmation!
📢 If the price holds above $8.080, the TP targets are likely to be hit.
📢 If stop level is breached, the setup may need reevaluation.
BYBIT:BERAUSDT.P shows bullish momentum — looking for further upside!
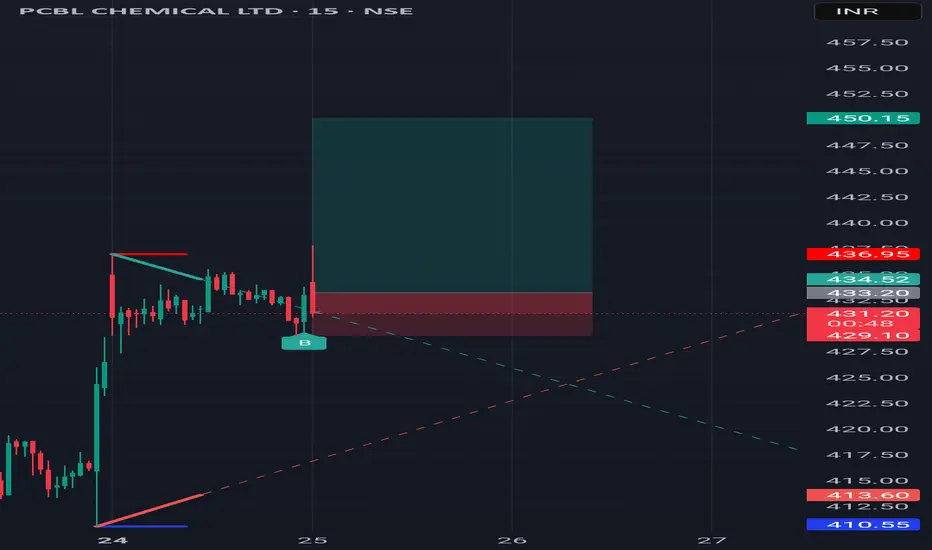
PCBL STRONG BREAKOUT Cash Call:
PCBL
Buy above 437.0
TGT 450.0
Stoploss 428.0
All data given here only for education Purpose Only
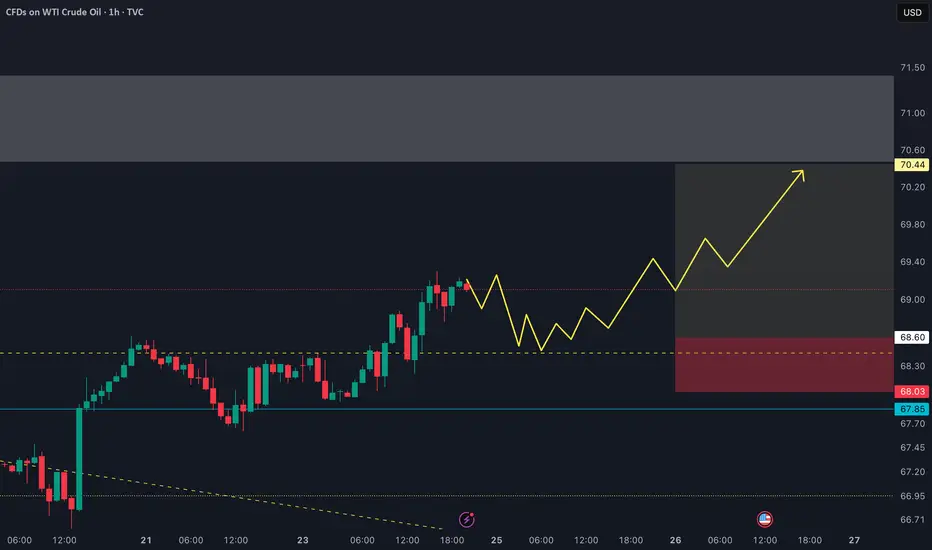
USOIL To Retest $70.5I'm watching TVC:USOIL for a strong push towards at least the $70.5 level, though this area presents significant resistance.
A confirmed break of the bearish trend could fuel strong buying momentum, but patience is key.
Ideally, I’d like to see a solid rejection off the $68.5 level as confirmation before a move higher.
If we get a decisive breakout above $70.5 with sustained bullish momentum, my next target would be the major resistance around $75.
POSI 1H Investment Long Aggressive Trend TradeAggressive Trend Trade
- short impulse
+ exhaustion volume
- resistance level
+ long volume distribution
Calculated affordable stop limit
1/2 1M take profit
1D Trend
"+ long impulse
+ support level
+ T2 level?
+ 1/ 2 correction
+ weak approach"
1M Trend
"+ long impulse
+ 1/2 correction
+ biggest volume expanding T1
+ support level
+ biggest volume manipulation"
1Y Impulse
+ long impulse

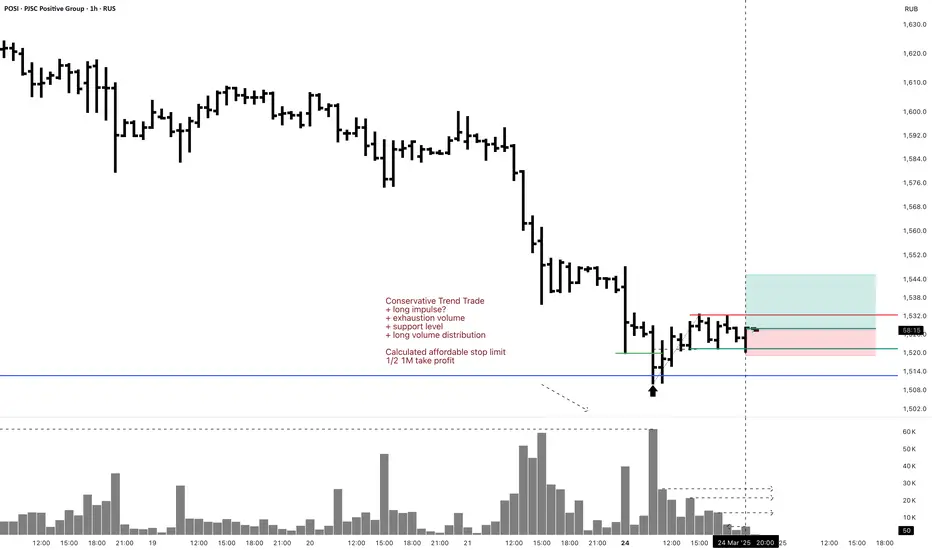
POSI 1H Swing Long Conservative Trend TradeConservative Trend Trade
+ long impulse?
+ exhaustion volume
+ support level
+ long volume distribution
Calculated affordable stop limit
1/2 1M take profit
1D Trend
"+ long impulse
+ support level
+ T2 level?
+ 1/ 2 correction
+ weak approach"
1M Trend
"+ long impulse
+ 1/2 correction
+ biggest volume expanding T1
+ support level
+ biggest volume manipulation"
1Y Trend
+ long impulse
TAO ANALYSIS🔮 #TAO Analysis 💰💰
🌟🚀 As we can see that #TAO is trading in a symmetrical triangle and given a perfect breakout. But there is an instant resistance. If #TAO breaks the resistance 1 then we will see a good bullish move in few days . 🚀🚀
🔖 Current Price: $271
⏳ Target Price: $305
#TAO #Cryptocurrency #DYOR

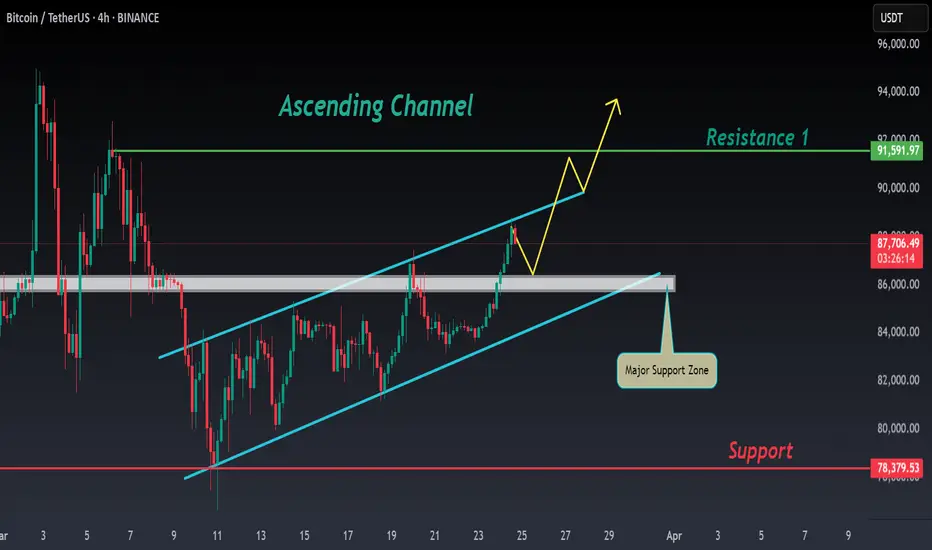
BTC ANALYSIS#BTC Analysis : Channel Following
📊As we can see that #BTC is following ascending channel on daily time frame. Currently the price is trading above its major support zone. Price is moving upwards within a long-term rising channel, recently moving towards its support from its support level. Expect a bullish move in few days.📈
🔖 Current Price: $87,700
⏳ Target Price: $91,500
⁉️ What to do?
- Keep your eyes on the chart, observe trading volume and stay accustom to market moves.🚀💸
#BTC #MajorSupport #Cryptocurrency #ChartPattern #DYOR
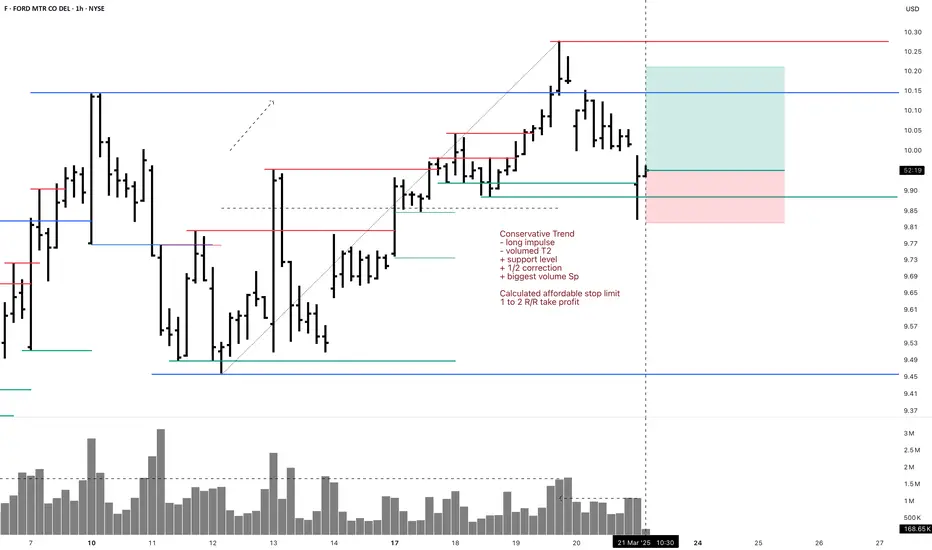
F 1H Swing Long Conservative Trend TradeConservative Trend Trade
- long impulse
- volumed T2
+ support level
+ 1/2 correction
+ biggest volume Sp
Calculated affordable stop limit
1 to 2 R/R take profit
Day Trend
"+ long impulse
+ 1/2 correction
- neutral zone
- context direction short"
Month CounterTrend
"- short impulse
+ 1/2 correction
- unvolumed T1
+ support level
+ long volume distribution
+ biggest volume manipulation"
Year Trend
"+ long impulse
+ volumed T2 level
+ volumed 2Sp+
+ 1/2 correction
+ weak test"
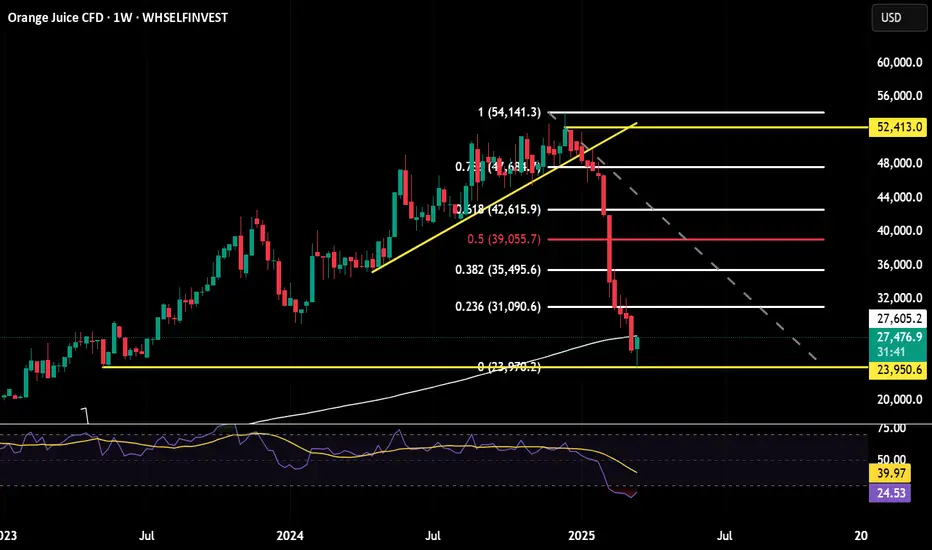
A good bounce inbound after this monster sell off on OrangeJuiceAfter this monster sell off I have been looking for a good entry on the smaller time frame for a bounce back up to the large consolidation area around the .618 retracement of the move down shown here on the weekly.
I think I have got that on Wednesday with an open lower followed by a nice impulsive move up. The positioning is set for a reversal, with speculators massively still short, on the technical side we have the RSI turning up on the weekly and already crossed over on the daily.
I am in from the Wednesday close and will be looking to add on the move up with good pull backs followed by rejections on the STF.
Invalid if Wednesdays low is taken.
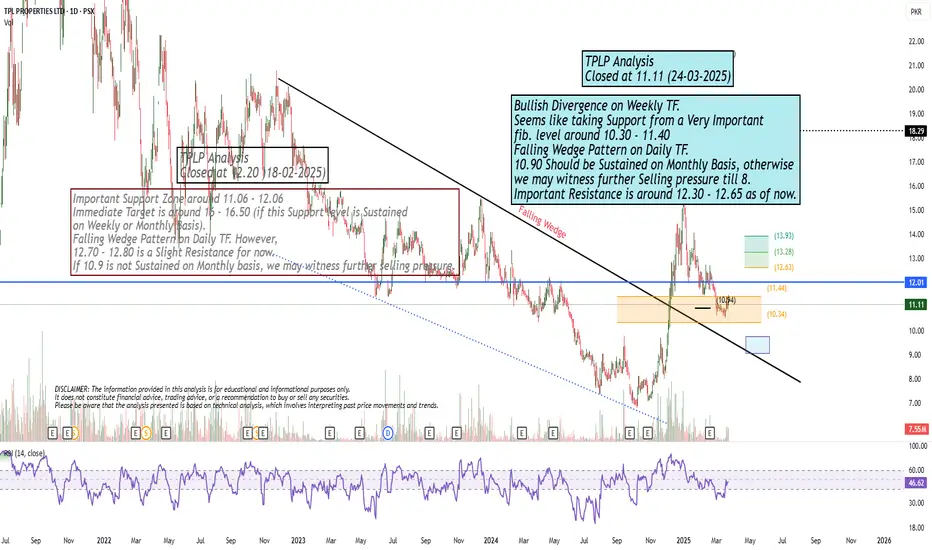
Bullish Divergence on Weekly TF.Bullish Divergence on Weekly TF.
Seems like taking Support from a Very Important
fib. level around 10.30 - 11.40
Falling Wedge Pattern on Daily TF.
10.90 Should be Sustained on Monthly Basis, otherwise
we may witness further Selling pressure till 8.
Important Resistance is around 12.30 - 12.65 as of now.
S&P 500 Setting Up for a Breakout – But Not Before One More TrapAs I’ve said before, the FOREXCOM:SPX500 is a key reference for my crypto trading . That’s why I sat down and took a closer look at the chart – and I’m now ready to place a limit order , based on what I’m seeing.
I believe we’re still in a correction phase , and it’s far from over . However, I think it’s realistic that we’ll see a move toward $5,832 next week . Before that happens, I expect either today’s Monday Low or next week’s Previous Weekly Low to get swept, ideally triggering a dip into the 12-hour Fair Value Gap just below.
That’s where I see my entry zone forming. It’s also the exact area where Wave B overshoots the starting point of Wave ABC, making it a clean Flat correction pattern, with Wave C completing to the downside before we get a solid move upward.
I’m setting my stop-loss below the $5,500 low. If this setup plays out, I expect the S&P to push toward $5,832 , and after that, I’m anticipating a larger correction that could take the index back down to $5,500 or even $5,450 over the coming weeks.
Timing remains unclear for that move after, but the structure is here , and I’m looking forward to seeing how it plays out.


META to $740 - Chance for Strong BounceNASDAQ:META Meta has hit the trend line from November 2022 after a price loss of 20% and has shown with a first small bounce that it is still relevant. At the same time, the SMA200 is also at the same point. Last but not least, the 0.238 Fib is also located in this area (from the entire upward movement from November 2022). Technically, we can therefore definitely expect a bounce that could take us to the previous ATH at $739.
Fundamentally, Meta is also not overvalued due to its strong growth. As with many of the Mag7s, there are still problems with the AI strategy, which does not appear to be well thought out in either monetary or structural terms. However, Meta is a good candidate for actual efficiency gains due to its affiliation with the advertising market. However, the general growth is already reason enough to buy.
Support Zones
$580.00
$541.00
Target Zones
$740.00

HBAR ANALYSIS📊 #HBAR Analysis
✅There is a formation of Descending triangle pattern on weekly chart. Also #HBAR is trading around its low level. If the price sustains here and give a bullish move then we could expect a bullish move otherwise we would see more dip.
👀Current Price: $0.18230
⚡️What to do ?
👀Keep an eye on #HBAR price action and volume. We can trade according to the chart and make some profits⚡️⚡️
#HBAR #Cryptocurrency #TechnicalAnalysis #DYOR

WIF - Break Out!Dear My friends,
When looking at the WIF chart, I wonder, where is its bottom? The current price is even lower than when it was first listed on Binance. So, since I don’t know, I’ll just analyze it. And I’ll start from the bigger picture. When I zoom into the daily timeframe, everything seems clear to me. Take a look at the daily chart, and you’ll see that a divergence has appeared. The price is dropping, but the RSI indicator is rising. The price has broken out of the descending channel. Buying volume has been dominant in recent sessions. So, I’ve searched for target levels on the daily timeframe. I hope my analysis will help you, my friends.
Best Regards,

Start adjusting before April tariff policy ! XAU ✍️ NOVA hello everyone, Let's comment on gold price next week from 03/24/2025 - 03/28/2025
🔥 World situation:
Gold prices decline for the second consecutive day but remain on track to close the week in positive territory, despite a stronger US Dollar (USD) and profit-taking ahead of the weekend. XAU/USD is currently trading at $3,019, down 0.81%.
Market sentiment remains cautious, though US equities are paring earlier losses. Meanwhile, bullion stays on the defensive as the USD regains momentum, with the US Dollar Index (DXY) edging up to 104.05, marking a 0.24% increase.
🔥 Identify:
Gold prices are in a short-term downtrend in the H4 frame, adjusting at the end of March, accumulating before tax policies in early April 2025.
🔥 Technically:
Based on the resistance and support areas of the gold price according to the H4 frame, NOVA identifies the important key areas as follows:
Resistance: $3057, $3080
Support : $2982, $2910
🔥 NOTE:
Note: Nova wishes traders to manage their capital well
- take the number of lots that match your capital
- Takeprofit equal to 4-6% of capital account
- Stoplose equal to 2-3% of capital account
- The winner is the one who sticks with the market the longest

IS BTCUSD BULLSIH FROM HERE ?🚀 BTC/USD Trading Idea - Let's Catch This Move! 🚀
Hello, traders! This is my first BTC/USD idea here, and I’m excited to share my analysis with you all. I’ve been trading BTC/USD since 2020, and I created this platform to provide valuable market insights, free education, and profitable trade setups—all for free! 📈✨
Now, let’s dive into the technical breakdown
📌 Market Overview
🔸 Since Friday night, BTC/USD has been consolidating throughout Saturday.
🔸 We observed a liquidity sweep at 83,755 on the 30-minute timeframe.
🔸 According to my strategy, once lows are swept, we shift to the 1-minute timeframe to find a valid Change of Character (ChoCh).
📌 Trade Setup
✅ After spotting a valid ChoCh, we identified a strong Order Block (OB) at 83,741.
✅ Our entry point is at 83,755 with a tight stop-loss of 30 pips (83,441).
✅ The target is 84,541, offering a solid 1:2.5 RR ratio.
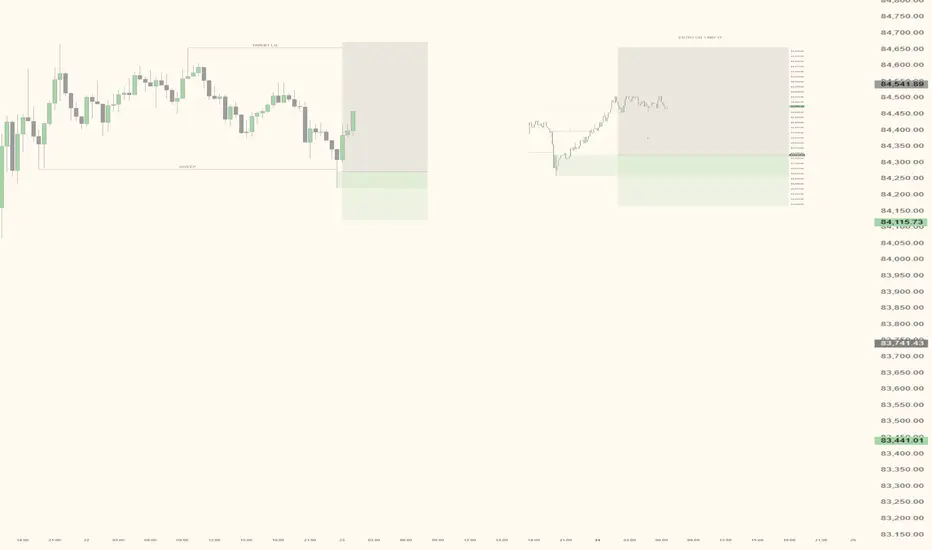
📊 Main Chart: A 30M timeframe marking the liquidity sweep, and a 1M screenshot showing our precise entry
🟢 Bias: Bullish
⚠️ Don’t forget to secure profits after +30 pips!
📌 Trade Details
📍 Buy Limit: 83,755
📍 Stop-Loss: 83,441 (-30 pips)
📍 Take-Profit: 84,541 (+80 pips)
Let’s bank some profits! 💰🔥 #BTCUSD #CryptoTrading #PriceAction #LiquiditySweep
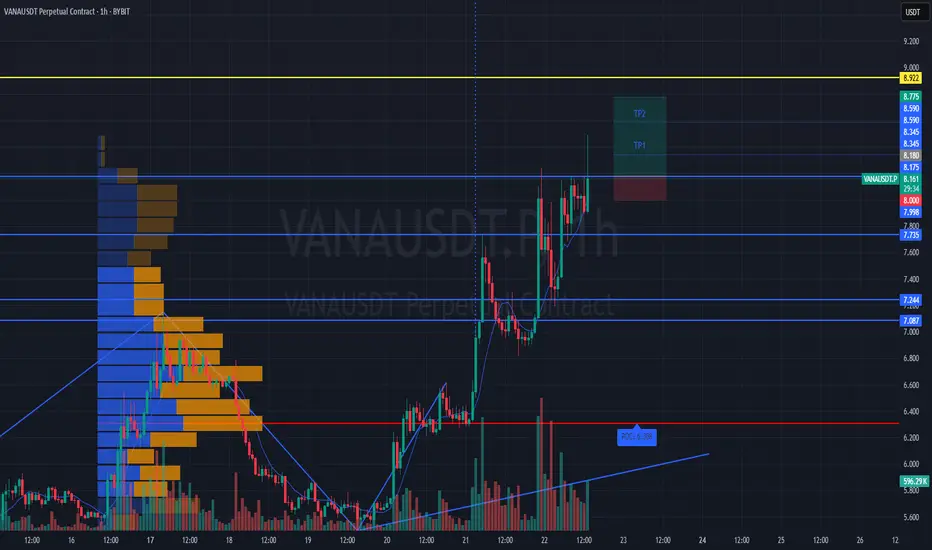
#VANAUSDT is forming a confident bounce from key levels📉 LONG BYBIT:VANAUSDT.P from $8.180
🛡 Stop loss $8.000
1H timeframe
❗️Before entering the trade, closely monitor the levels. If the price consolidates above $8.180 with volume, this confirms the entry signal.
✅ Overview BYBIT:VANAUSDT.P :
➡️ On the chart, we can see that after a downward movement, the price formed a local bottom around $8.000, followed by an upward impulse.
➡️ A structure resembling a reversal pattern has appeared: the price broke through a slanted resistance (blue line) and consolidated above $8.180, indicating weakening sellers.
➡️ The price is now moving toward a resistance zone marked as POC (Point of Control) at $8.353, which could be the first target.
➡️ The entry is set at $8.180, aligning with the breakout level, supported by increasing volume and a short-term uptrend.
The volume profile on the left shows a low-liquidity zone above the current price (between $8.345 and $8.590), which may allow the price to quickly reach the TP levels.
🎯 TP Targets:
💎 TP 1: $8.345
💎 TP 2: $8.590
💎 TP 3: $8.775
⚡️ Plan:
➡️ Monitor the price reaction at TP1 ($8.345) — a pullback is possible. It’s recommended to close part of the position.
➡️ Wait for confirmation of the breakout above $8.180 (already happened, price is above).
➡️ Enter LONG after a retest (with volume) — in this case, the retest has already occurred, and the price is moving up.
➡️ Place the stop below the last low — at $8.000.
BYBIT:VANAUSDT.P is forming a confident bounce from key levels, and if it holds above the entry zone, we expect an upward movement!
#VICUSDT shows signs of reversal and strength📉 LONG BYBIT:VICUSDT.P from $0.2507
🛡 Stop loss $0.2470
🕒 1H Timeframe
📍 Important Note:
Wait for confirmation around the $0.2507 level. Enter the trade only if price holds above with volume.
✅ Overview BYBIT:VICUSDT.P :
➡️ The chart shows a completed Falling Wedge — a bullish reversal pattern that typically leads to an upside breakout.
➡️ After that, a Bearish Pennant formed but failed to push the price significantly lower, indicating weakness in sellers.
➡️ Currently, the price is breaking out of the triangle pattern, hinting at a possible bullish continuation.
➡️ Entry level marked at $0.2507, right after the breakout zone, supported by steady volume and short-term uptrend.
➡️ Volume Profile on the left reveals a low-volume zone above, making it easier for price to climb toward TP targets.
🎯 TP Targets:
💎 TP 1: $0.2525
💎 TP 2: $0.2545
💎 TP 3: $0.2565
⚡ Plan:
➡️ Monitor price reaction at TP1 — partial exit recommended.
➡️ Watch for confirmation above $0.2507.
➡️ Enter LONG after retest and volume confirmation.
➡️ Set stop loss below recent low — at $0.2470.
🚀 BYBIT:VICUSDT.P shows signs of reversal and strength — holding above the breakout zone could lead to upside movement!

Breakout ExpectedMonthly Closing above 18.40 will trigger
further upside.
Long Consolidation Breakout Expected.
Bullish on Weekly TF.
Hidden Bullish Divergence on Weekly TF.
