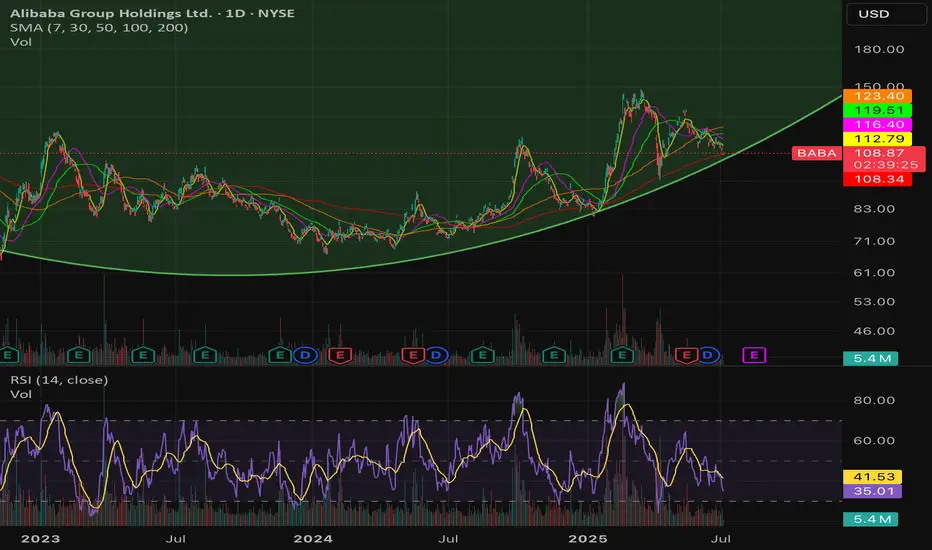
Long $BABA - NYSE:BABA is testing 200 SMA
- NYSE:BABA moves are explodes higher then cools then retest support then explodes higher than the last high. It's called trading with higher wavelength
-> Move 1: Started April 2024 when the trend reversal started. $68 -> $89 with around +30% then retraced $90 -> $72 ( -20% )
-> Move 2: July 2024, $72 -> $116 (+61%) then retraced $116 -> $80 ( -31% )
-> Move 3: Jan 2025, $80 -> $146 (+ 82.5%) then retraced $146 -> $108?? ( correction underway ) ~ -26% so far
-> Move 4: Likely from $100-105 to $180-200
Longsetup
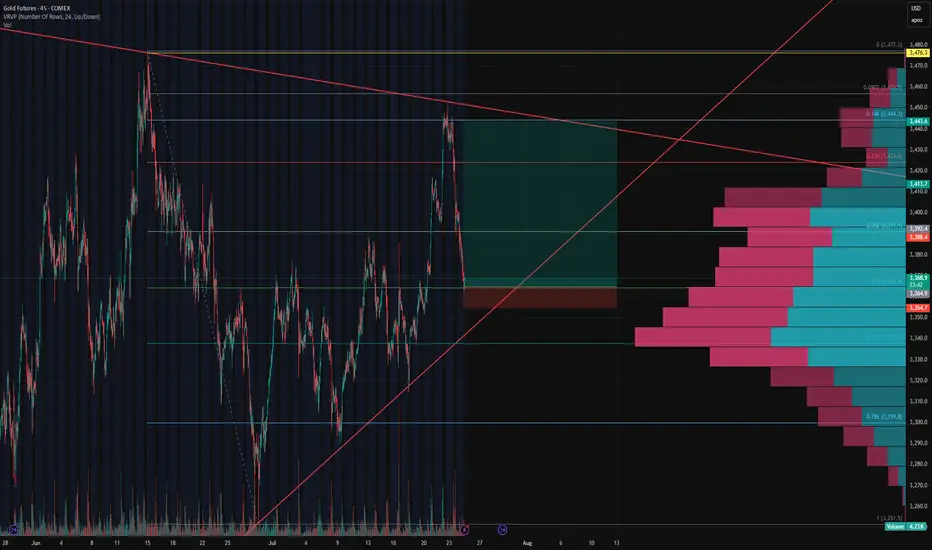
Gold Futures (GC1!) Long Setup – 0.5 Fib Bounce🟡 Gold Futures (GC1!) Long Setup – 0.5 Fib Bounce
After nailing the long from the bottom and perfectly shorting the top, we’re stepping back in for another calculated move.
📉 Price pulled back to the 0.5 Fibonacci retracement, aligning perfectly with the upward trendline support and a key HVN on the Volume Profile.
📈 Entered long at 3,365 with a tight stop below 3,354 (0.3% risk), targeting the descending trendline near 3,444 for a clean 7.7R setup.
🧠 Context:
Price reacted hard at resistance, but volume support and structure still lean bullish.
Clear invalidation if we break trend and lose 3,350 support cluster.
Let’s see if this bounce gets legs. 🚀
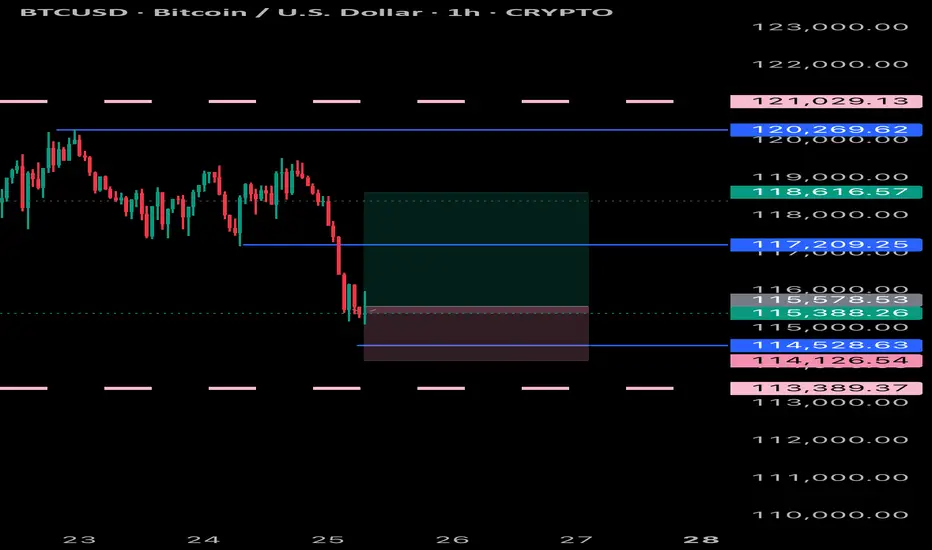
BTCUSD BUYING can expect a bullish move from bitcoin as it has dropped a fair amount and can extract a reversal to the up side due to being oversold
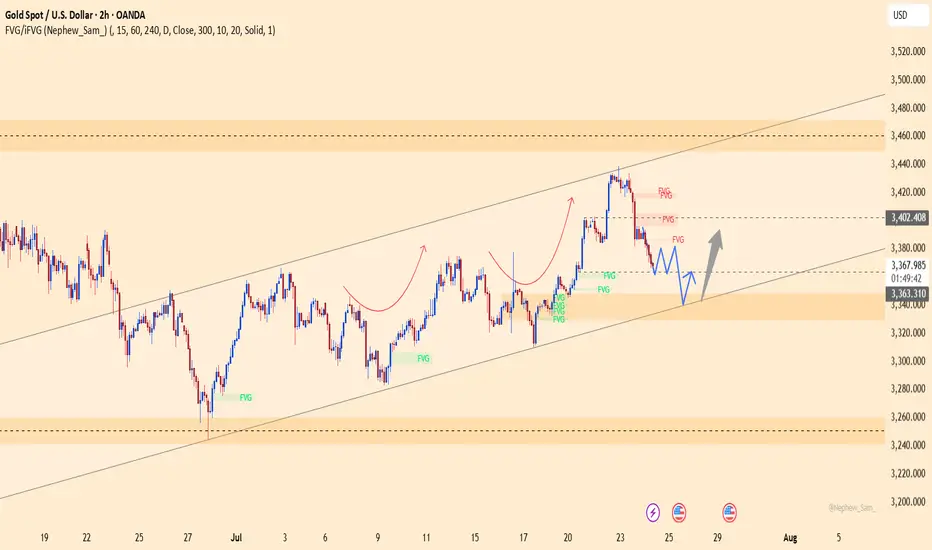
XAUUSD – healthy correction, ready to bounce from 3,338Gold is retracing within an ascending channel after facing rejection at the FVG zone near 3,402.800. This pullback is seen as a healthy correction, with confluence support around 3,338, which previously acted as a springboard for bullish momentum.
As long as price holds above this zone, a rebound toward 3,402 remains likely.
Primary scenario
Buy zone: 3,338
Target: 3,402
Invalidation: Break below 3,320
Note
Weak volume near the FVG zone may cause short-term consolidation, but the broader trend still favors buyers.
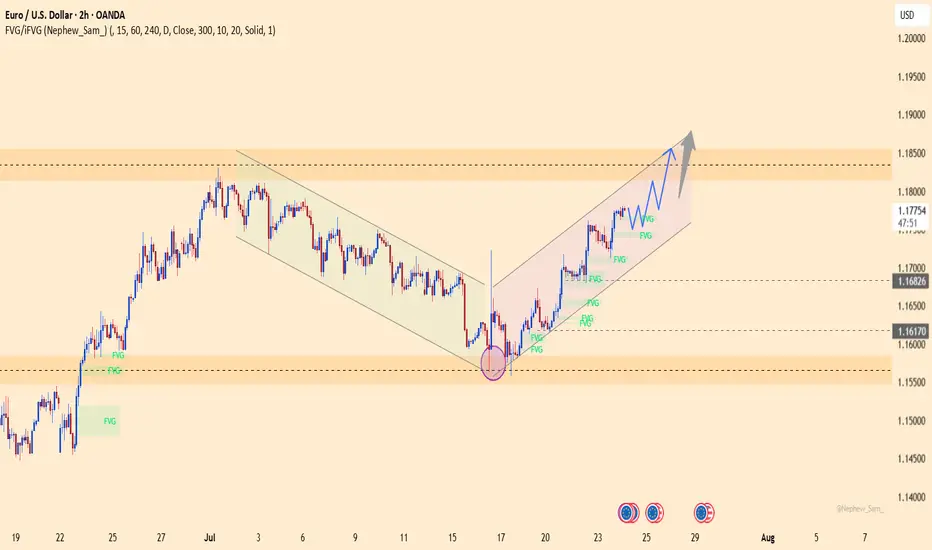
EURUSD – The Comeback is Real! After weeks trapped in a descending channel, EURUSD has broken out in style, launching into a clean bullish channel. Price is now carving a staircase of FVG zones, with momentum clearly favoring the bulls.
What’s fueling the fire?
Flash Manufacturing PMI from Europe beat forecasts
Eurozone consumer confidence improved
Markets pricing in dovish Fed as jobless claims dropped but inflation expectations stall
As long as price stays above 1.1750 and respects the ascending channel, the 1.1850 zone is well within reach.
Strategy: Buy the dips inside the bullish channel. FVGs act as stepping stones for further upside.
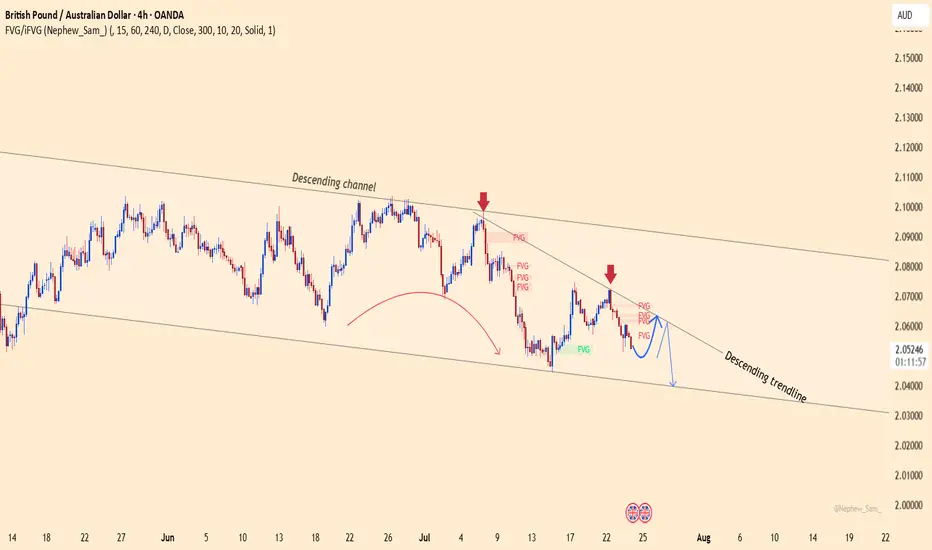
GBPAUD – False breakout or the next sharp drop?The GBPAUD pair continues to trade within a well-defined descending channel, with every bullish attempt being firmly rejected by the descending trendline. Recent candlesticks show a clear sell signal right at the FVG resistance zone.
Market-moving news:
Australia’s manufacturing PMI surprised to the upside → strong support for AUD
GBP remains under pressure after dovish comments from the BoE, diminishing hopes of further rate hikes.
If the price fails to break above the 2.0640 zone — creating yet another fake top — a sharp drop toward 2.0400 is highly likely.
Strategy: Look to SELL near the trendline and FVG zone, targeting 2.0400.
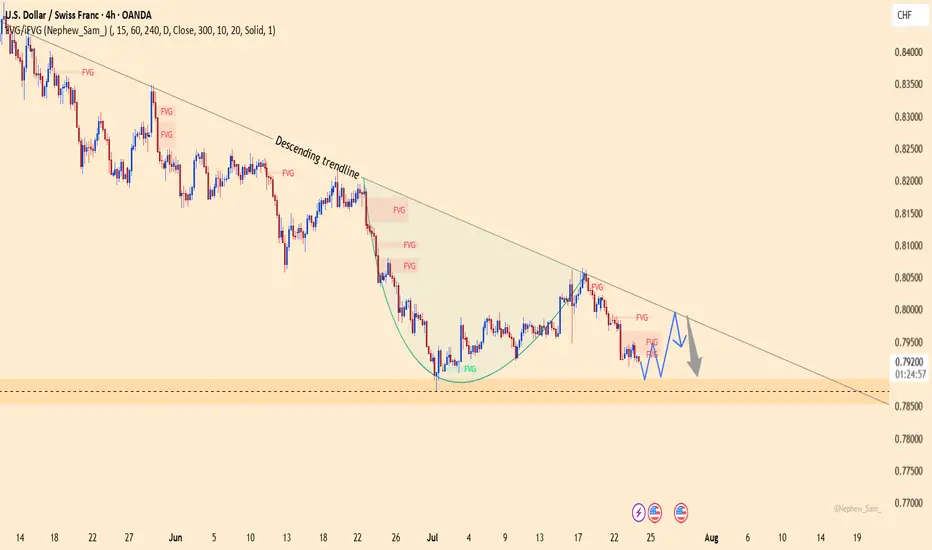
USDCHF – The Wind Still Blows South!USDCHF remains trapped below the descending trendline since June. Every bullish attempt has been sharply rejected – showing sellers are still in control.
Fresh U.S. data just released:
Jobless claims dropped → strong labor market → Fed likely to keep rates high → USD gains strength.
Manufacturing PMI beat expectations → resilient economy → more reason for a hawkish Fed.
But don’t forget: CHF is attracting safe-haven flows, adding downward pressure on USD!
If price fails to break above 0.7990 and gets rejected at the trendline, a drop toward 0.7890 is likely.
Strategy: Look to SELL around the trendline – follow the trend, not your emotions!
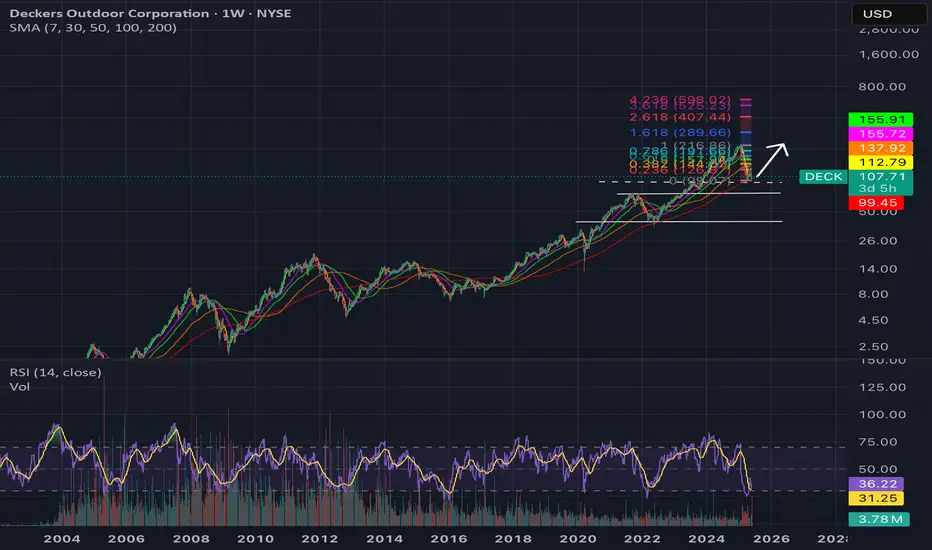
Long $DECK - NYSE:DECK is the only growth story I'm comfortable buying. This was wall street darling for many years. I believe sell off was overdone.
- It has lot of room to run. It is getting traction and NYSE:NKE because of law of large number is not growing much in %age.
- However, NYSE:DECK has lot of road ahead and it can grow for many years to come. Global expansion is also not out of the question.
- I strongly believe NYSE:DECK will make an all time high when this tariff narrative takes a backseat.
- Another bullish thing for NYSE:DECK is that Trump doesn't plan to bring back shoes or clothing manufacturing back in US.
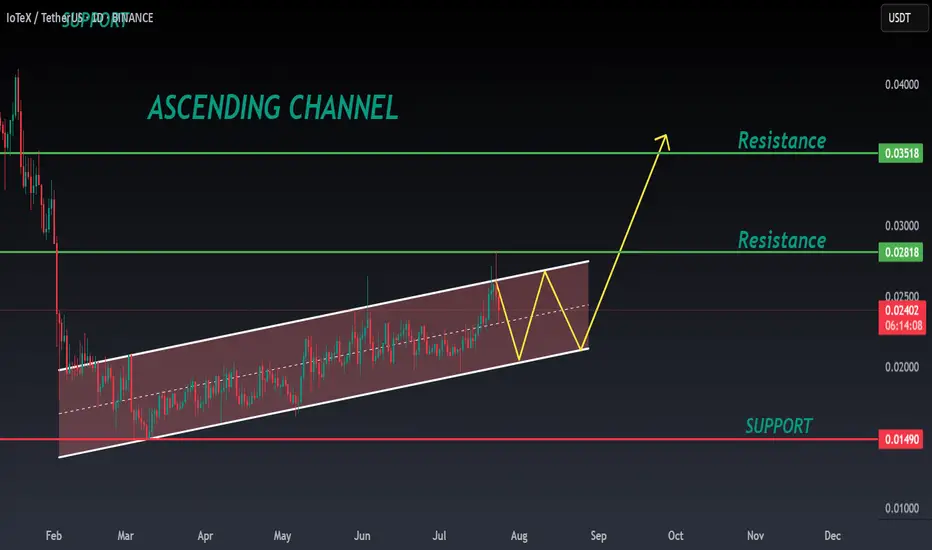
IOTX ANALYSIS🔆#IOTX Analysis : Channel Following ⛔️⛔️
As we can see that #IOTX is following ascending channel on daily time frame. We can see a bullish formation here. And if it trade with good volume then we can see a proper bullish move in #IOTX 📈📈
🔖 Current Price: $0.02400
⏳ Target Price: $0.03500
⁉️ What to do?
- Keep your eyes on the chart, observe trading volume and stay accustom to market moves.🚀💸
🏷Remember, the crypto market is dynamic in nature and changes rapidly, so always use stop loss and take proper knowledge before investments.
#IOTX #Cryptocurrency #ChartPattern #DYOR
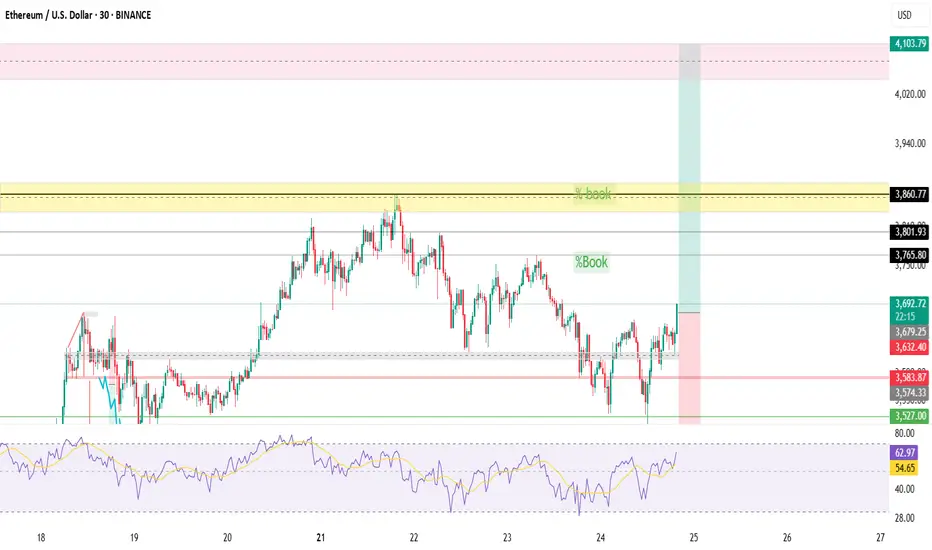
ETHUSD News Over / 30 minutes time frame Bullish Trade
Mange risk Always chart explains trade plan well
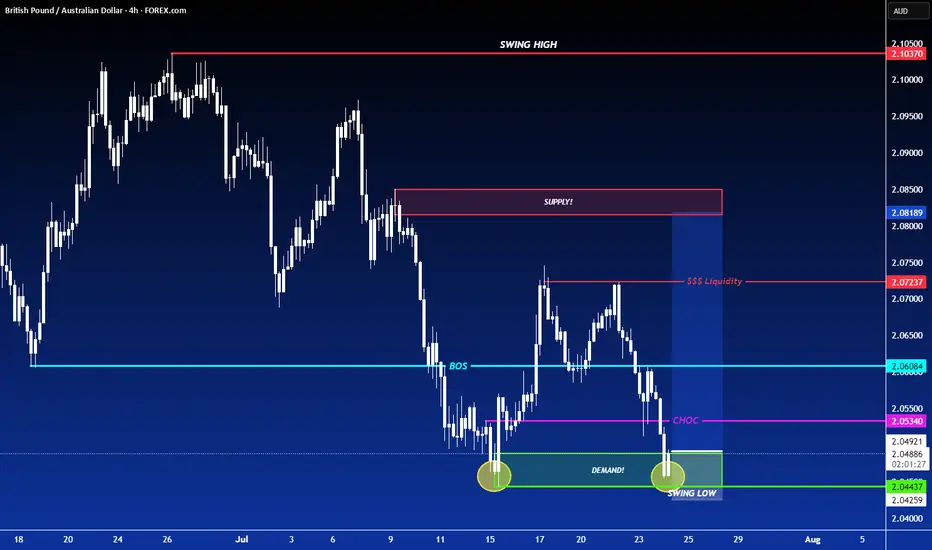
LONG ON GBP/AUDGA has given us a CHOC (change of character) to the upside after making a new low.
Price has since pulled back to the demand area that created that change leaving us with a possible double bottom forming.
I expect GA to rise to sweep buy side liquidity at the equal highs then reaching the previous supply level / previous High.
Looking to catch 200-300 pips.
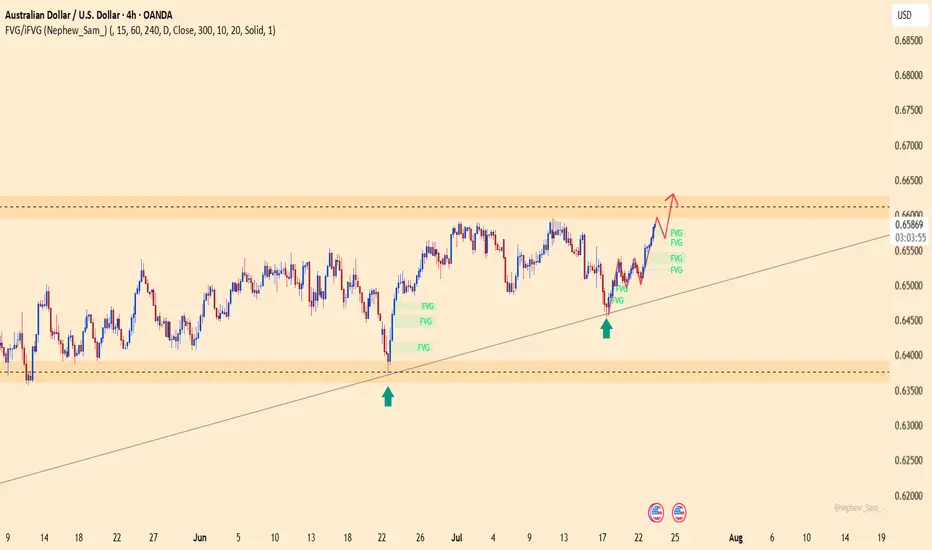
AUDUSD – a rebound from the bottom, ready to break free?After a strong bounce off the ascending trendline, AUDUSD is climbing decisively, clearing out multiple FVG zones on its way toward the key resistance near 0.66300. The bullish structure is intact, and buyers are clearly in control.
News backing the move:
– U.S. S&P Global PMI just came in below expectations, slowing the USD.
– China – Australia’s major trading partner – is signaling fresh stimulus, giving AUD an indirect boost.
If price reaches the 0.66300 zone without strong rejection, this could trigger a breakout that sets the stage for a new rally in August.
Caution: A USD rebound from this week’s data could briefly slow AUDUSD. But for now, the bulls are driving!
GBPJPY – is the end of the range near?After nearly two weeks stuck in the 197.600–200.000 range, GBPJPY has successfully shaken off a bearish fakeout and is now consolidating near the upper FVG zone. The bullish structure remains intact within the rising channel – and this time, the market may not forgive another missed opportunity.
Supporting news:
– UK CPI data released yesterday came in hotter than expected → inflation pressure is back → market expects the BoE to stay hawkish → GBP gains strength.
– Meanwhile, the JPY continues to weaken as the BoJ maintains ultra-low interest rates, setting the stage for this pair to surge.
A breakout above 200.000 could open the door for a push toward the channel top – this could be the ignition point for a major summer rally.

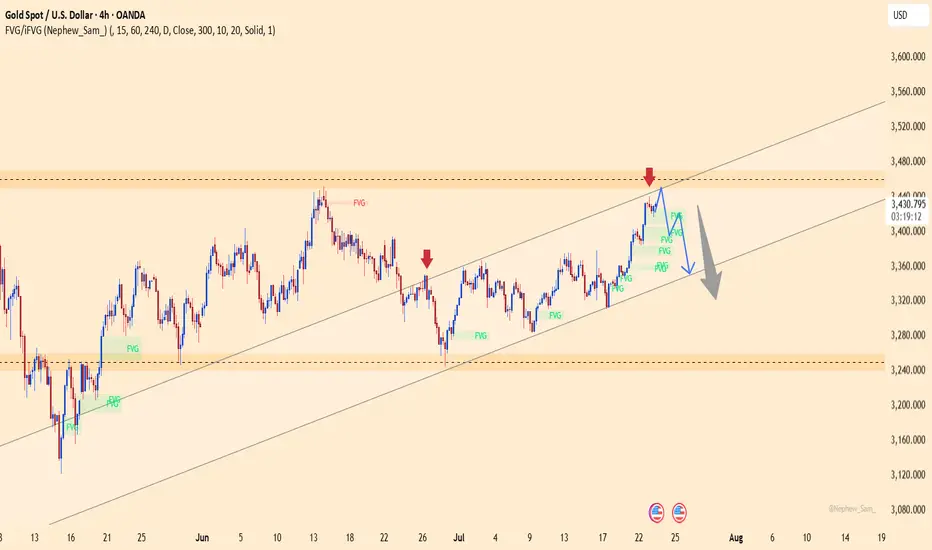
XAUUSD – the final bounce before the fall?Gold has lost its shine — at least for now.
After a relentless climb within the rising channel, price has just “kissed the ceiling” near the strong resistance at 3,447, forming a series of doji candles with long upper wicks — a classic sign of exhaustion. Meanwhile, FVG zones are being filled repeatedly, suggesting that buyers are losing dominance.
But could this final push be a trap?
The familiar script: price dips slightly toward the channel bottom — shaking out weak positions — then breaks straight down to 3,351. This zone once sparked strong rallies, but this time, everything seems to be working against gold.
EURUSD – Recovery losing steam, correction risk is risingAfter rebounding from the trendline support, EURUSD is now approaching the key resistance area around 1.17500 — a zone that has historically triggered multiple rejections. However, with French and German PMI figures coming in below expectations and the ECB holding rates steady without providing any fresh policy guidance, the euro lacks the momentum for a sustained move higher.
On the H4 chart, price action is showing signs of exhaustion as it tests resistance. If buyers fail to break through convincingly, a pullback toward the 1.16800 support zone — or even deeper toward 1.16400 — becomes increasingly likely.
Preferred strategy: Watch for bearish rejection patterns near 1.17500. If confirmed, this could be a favorable opportunity to initiate short positions in anticipation of a correction.

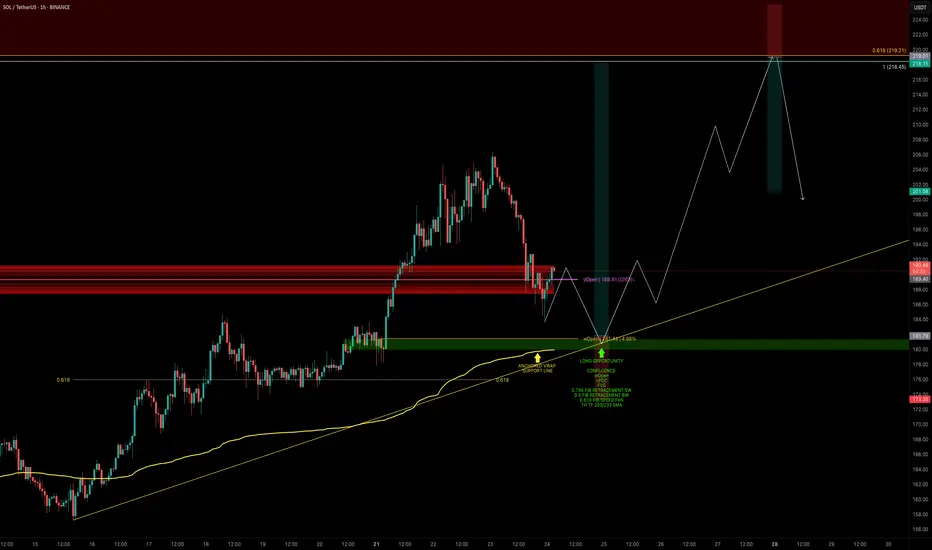
SOL — Bullish Retest in Motion: Time to Strike?SOL has finally broken through the $180 barrier decisively — a key zone it failed to clear back in May.
Now we’re seeing a retest, which may offer one final dip before continuation. Let’s break down the next high-conviction long opportunity.
🧩 Key Retest Zone: $182–$180
➡️ Retesting Prior Resistance as Support
SOL broke above $180 with conviction and is now pulling back.
➡️ First Reaction at $184
A clean bounce occurred at the anchored VWAP, but this might not be the final low.
➡️ Strong Confluence at $180–$182 Zone
This zone is packed with support elements:
Weekly Open (wOpen): $181.44
nPOC: $180.85
Anchored VWAP: ~$179.90
0.5 Fib retracement (of the larger wave)
0.786 Fib retracement (of the smaller wave)
0.618 Fib Speed Fan — projected for tomorrow’s price path
1H 200 & 233 SMAs supporting from below
SOL is currently trading at yOpen — another key pivot level to watch
🟢 Long Trade Setup
Entry: Laddered between $182–$180 (ideal long entry would be at wOpen)
Stop-loss: Invalidation at $173.35
Target (TP): TBFE 1.0: $218.45 / 0.618 Fib retracement: $219.21
R:R: ~1:4.5
Potential Move: ~+20%
🛠 Indicator Used: DriftLine — Pivot Open Zones
For this analysis, I’m using my own published indicator called "DriftLine – Pivot Open Zones " feel free to check it out on my profile.
It helps identify and visualise critical opens (daily, weekly, previous days), providing real-time support/resistance zones.
➡️ You can use it for free — just check my profile under “Scripts” and add it to your chart.
💡 Pro Tip: Support Zones Are Stronger with Confluence
Don’t rely on a single fib or level. When opens, VWAPs, SMAs, and fibs cluster, the probability of a strong reaction increases.
This is how smart traders define clear entries and invalidation.
_________________________________
💬 If you found this helpful, drop a like and comment!
Want breakdowns of other charts? Leave your requests below.
AAPL LIVE PRICE ACTION JULY 23 2025This is the price action for AAPL. I have discussed indicators as well. Do not blindly trade without understanding the logics. I am long here with stocks only.
NOTE: DO NOT BLINDLY BUY

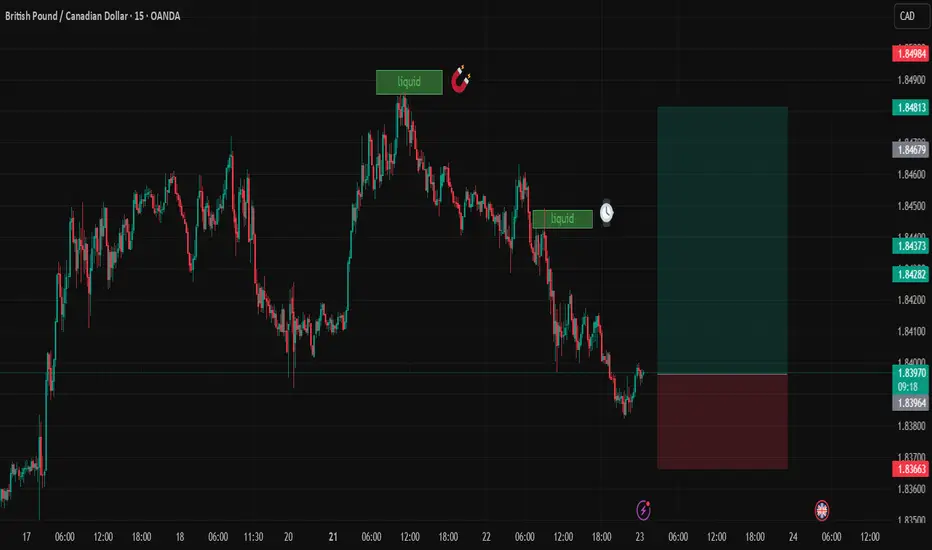
GBPCADDate:
July 23,2025
Session:
Tokyo and London session
Pair:
GBPCAD
Bias:
Long
2 liquidity pools that are waiting to be swept this week. Looks like price is gonna be magnetized towards these levels during London and Tokyo. The trade may even stretch into NYC.
Entry: 1.83970
Stop Loss: 1.83674
Target: 1.84811
RR: 2.82
AUDJPY: Waiting to BUYIn this video I walk through my full thought process on how I plan to approach this setup. I’m not rushing in or trying to predict what price will do. Instead, I’m staying reactive. I’ve identified a clean FVG that price is currently approaching, and my plan is to wait patiently for price to tap into that zone.
But tapping the FVG alone is not enough for me to jump in. What I really want to see is a clear bullish reaction, something like a strong bullish engulfing candle or a shift in structure that confirms the buyers are stepping in. If that happens, then I’ll look to take a long position targeting another liquidy zone.
This isn’t about guessing the bottom. It’s about letting price tell the story and only acting when there’s a clear signal. That’s the discipline behind this trade.

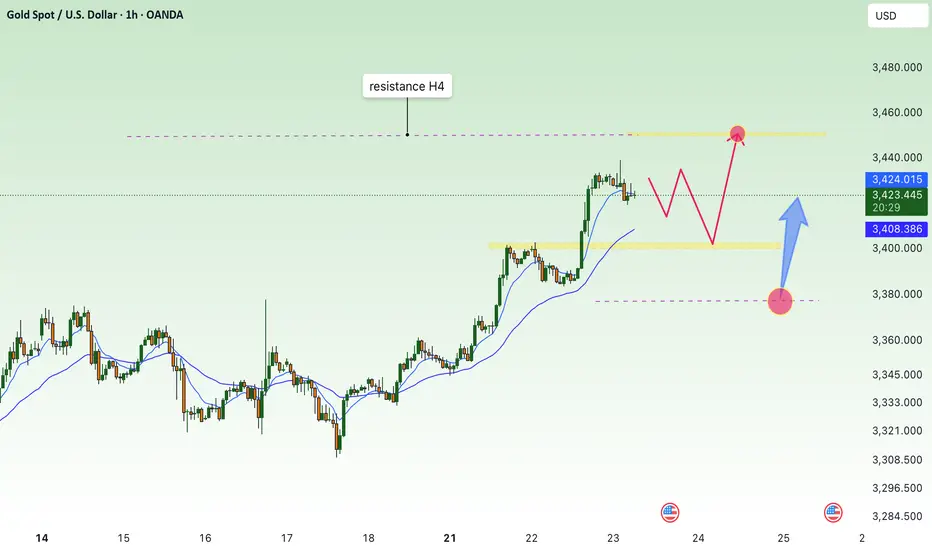
Continued price increase - gold increased to 3450⭐️GOLDEN INFORMATION:
Gold prices climbed for a second straight session on Tuesday, gaining over 0.9% as sliding US Treasury yields continued to weigh on the US Dollar. Investors remained cautious amid lingering uncertainty over upcoming US trade agreements. At the time of writing, XAU/USD is trading at $3,427, having rebounded from an intraday low of $3,383.
Yields on US government bonds have now declined for five consecutive days, pressuring the Greenback—reflected in the softer US Dollar Index (DXY). Heightened speculation that the US and European Union (EU) may fail to secure a trade agreement before the looming August 1 deadline has intensified demand for safe-haven assets. As a result, gold surged to a five-week high of $3,433.
⭐️Personal comments NOVA:
Gold price continues to increase, FOMO from the market is good and positive. Heading towards 3450
⭐️SET UP GOLD PRICE:
🔥SELL GOLD zone: 3449- 3451 SL 3456
TP1: $3435
TP2: $3422
TP3: $3405
🔥BUY GOLD zone: $3380-$3378 SL $3373
TP1: $3390
TP2: $3400
TP3: $3415
⭐️Technical analysis:
Based on technical indicators EMA 34, EMA89 and support resistance areas to set up a reasonable BUY order.
⭐️NOTE:
Note: Nova wishes traders to manage their capital well
- take the number of lots that match your capital
- Takeprofit equal to 4-6% of capital account
- Stoplose equal to 2-3% of capital account
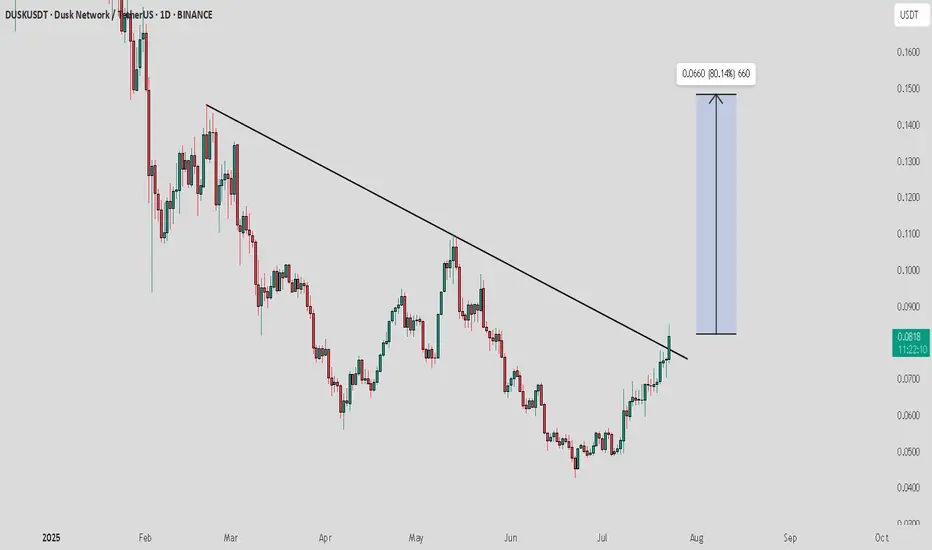
DUSK / USDT : Trend reversal in progressDUSK/USDT - Trend Reversal in Progress
DUSK/USDT has recently broken above a significant downtrend resistance line, signaling a potential trend reversal. With a successful breakout, we’re expecting a strong move towards the $0.0660 target, representing an 80% potential upside from the current price.
Bullish Scenario:
Break above the downtrend resistance confirmed, setting the stage for a significant move toward $0.0660.
A sustained uptrend could lead to further gains in the medium term.
Pro Tip:
Watch for confirmation with increased volume during the breakout. Manage risk by setting stop losses below the breakout level.
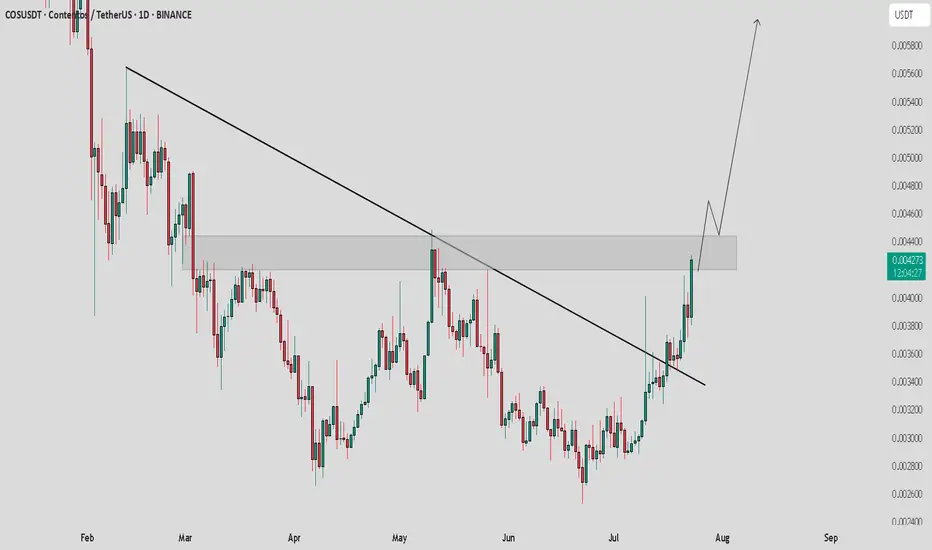
COS / USDT : Breakout setupCOS/USDT - Breakout Setup
COS/USDT is showing strong potential, currently trying to break out from horizontal resistance after a successful trendline breakout. Once the horizontal resistance is cleared, we could see a bullish move of +30% to +40%.
Bullish Scenario:
Break above horizontal resistance confirms continuation, targeting a move of +30% to +40%.
Pro Tip:
Watch for confirmation with volume before entering. Set stop losses below the breakout level for risk management.
LONG ON GBP/CADGBP/CAD is now at a major key area/demand zone after completing its pullback phase.
I expect price to now rise to the next level of supply or previous high.
looking to catch 200-400 pips throughout the week.
