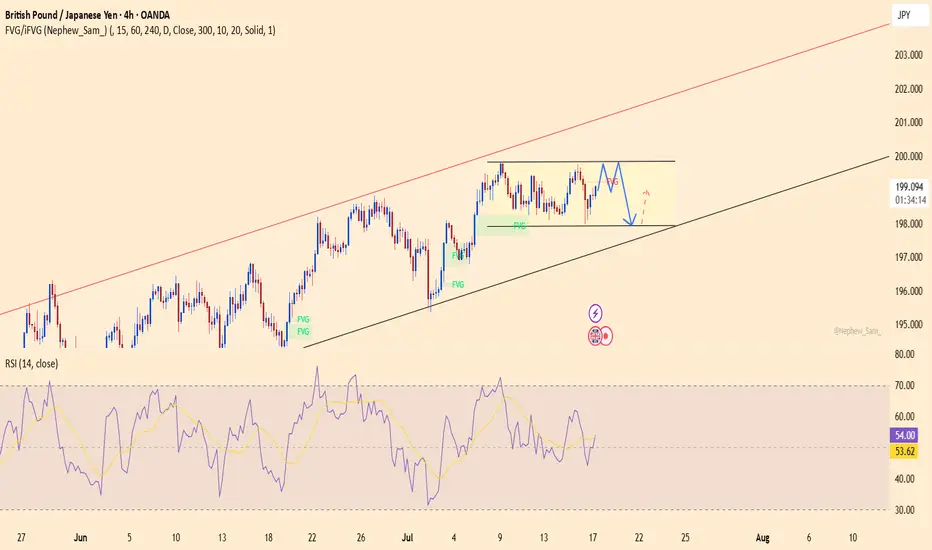
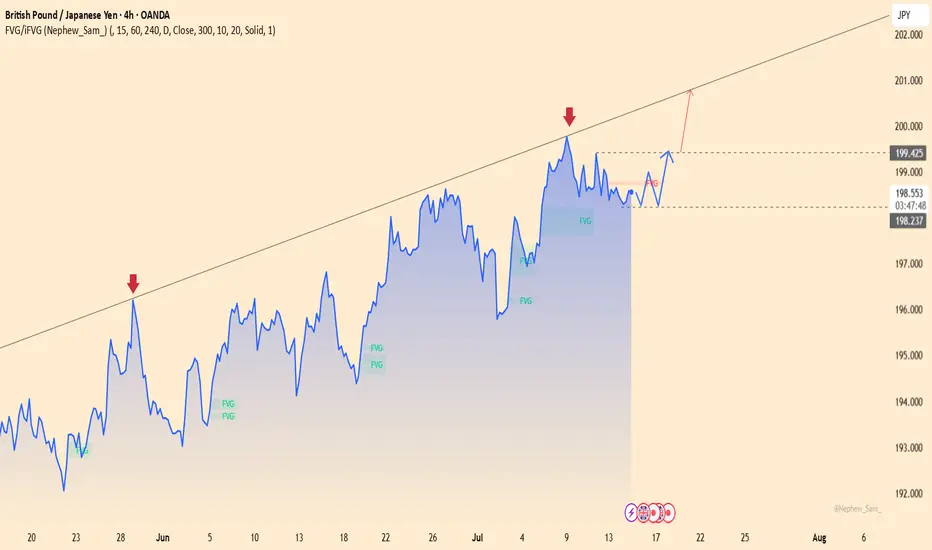
GBPJPY set for breakoutGBPJPY is currently trading in a sideways pattern within an ascending channel. The support zone around 197.900 has been respected multiple times, while price repeatedly fails to break above the 199.800 resistance – signaling that built-up pressure may soon erupt.
Recent data shows that UK inflation remains high, and the Bank of England may maintain its hawkish stance, supporting the GBP. Meanwhile, global risk-off sentiment continues to weaken the JPY.
If price breaks through the current resistance, it would confirm the continuation of the uptrend, with a target toward the upper boundary of the red channel. However, if rejection persists, buying from support remains a valid strategy.
Longsetup
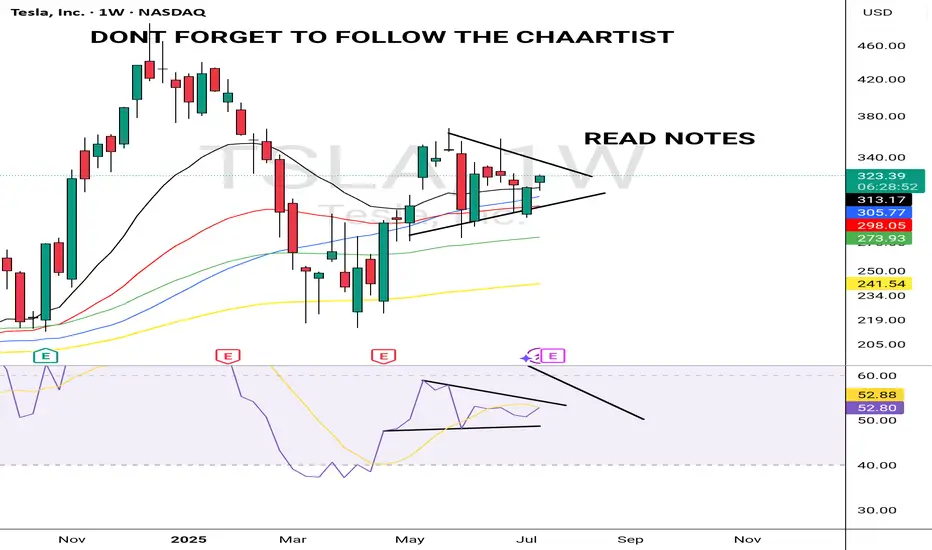
TSLA ULLISH JULY 18 2025Tsla is lloling extremely bullish technically. If it stops me out ,il exit but my my targets from here would be $390.
Always put a SL & decide a target before your entry
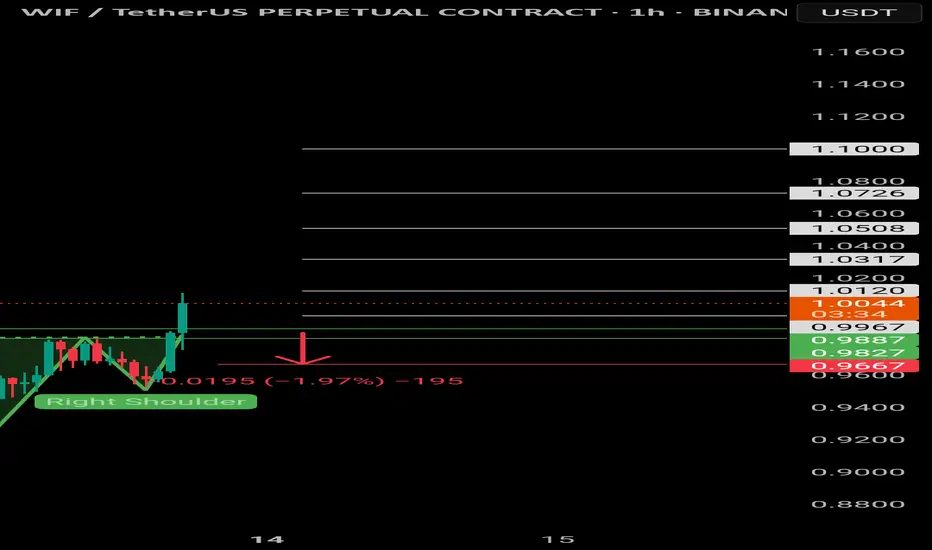
$WIF | Inverted head and shoulders $Wif/Usdt
BINANCE:WIFUSDT.P
The price is formed the Inverted head and shoulders pattern and did a breakout of the neckline, expecting the price to retest green lines (neckline).
If 1H CC hit and bounce above the green lines, it'll be a long opportunity.
Entering at current price will increase the SL, it's suggested to wait for a retest, to have better entry and a good risk management.
Use only 1-2% of your portfolio.
NFA, DYOR
TP:
XAUUSDDear traders,
In my previous analysis, I mentioned that gold could extend its short-term decline after being rejected from the range boundary. However, that bearish structure was quickly invalidated following a sharp upside move, signaling a potential trend reversal. If this momentum continues, I anticipate that price may soon reach the levels of 3,355 and 3,365.
Feel free to leave a comment if you have any thoughts to add. Good luck!

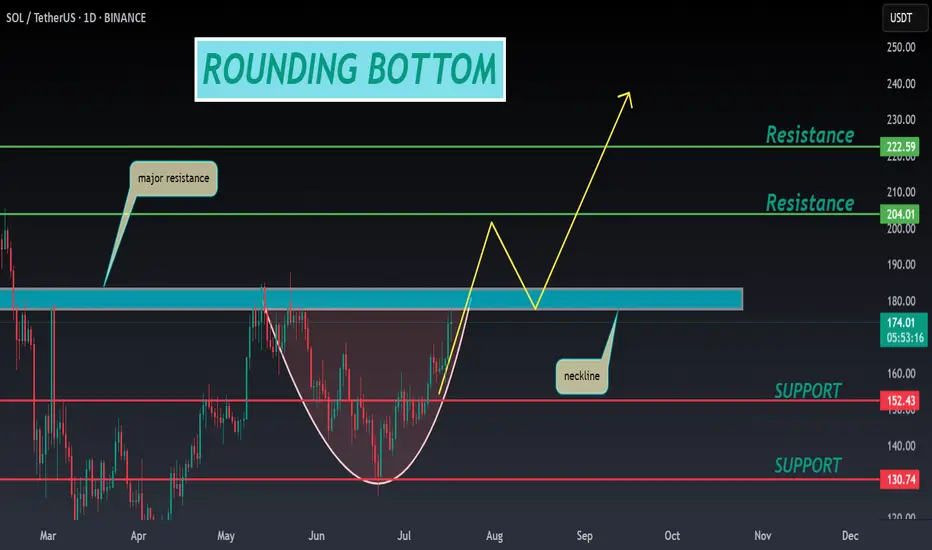
SOL ANALYSIS🔮 #SOL Analysis 💰💰
📊 #SOL is making perfect and huge rounding bottom pattern in daily time frame, indicating a potential bullish move. If #SOL retests little bit and breakout the pattern with high volume then we will get a bullish move📈
🔖 Current Price: $173.75
⏳ Target Price: $204.00
⁉️ What to do?
- We have marked crucial levels in the chart . We can trade according to the chart and make some profits. 🚀💸
#SOL #Cryptocurrency #Pump #DYOR
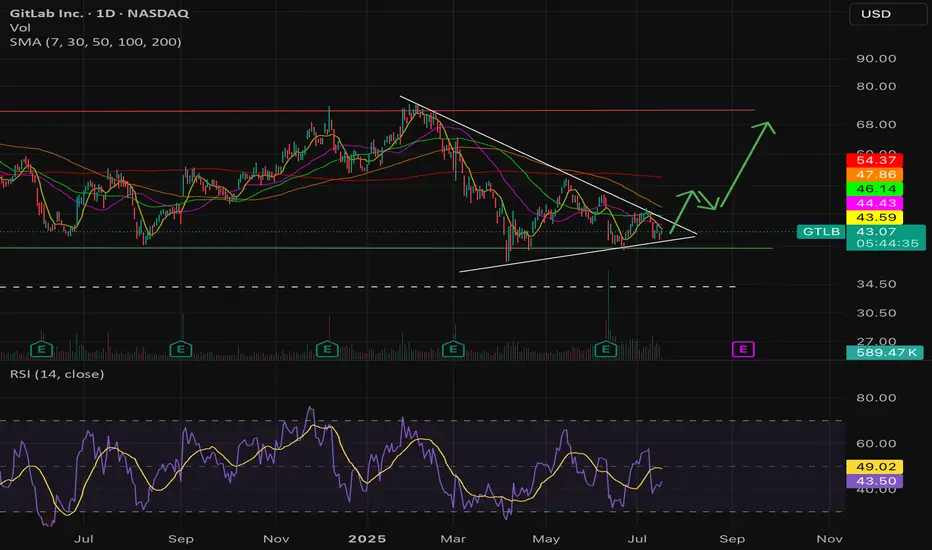
$GTLB undervalued, Potential 2X, AI assisted coding tailwind- NASDAQ:GTLB is likely one of the play for Agentic AI. When other companies like Windsurf, Codium, Cursor are in a goldrush. NASDAQ:GTLB is selling shovels.
- AI assisted coding is now a theme and is happening at a fast pace. I'm certain NASDAQ:GTLB will be a beneficiary of this trend.
- NASDAQ:GTLB has launched various AI based features on its platform which will get adoption and it will be easier for the company to upsell these features.
- P/S for NASDAQ:GTLB is depressed. If they even execute on their fiscal goals, re-rating should lift the stock up.
- NASDAQ:GTLB should be a 2X in less than 3 years in my opinion given secular shift and macro as a tailwind.
Fair value for NASDAQ:GTLB as of now is $68-72
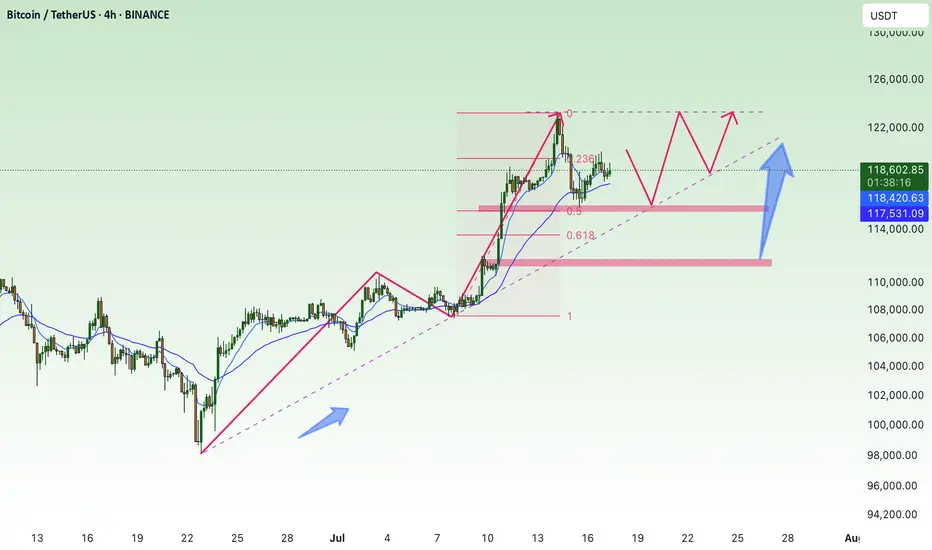
BTC sideways above 115k💎 BTC PLAN UPDATE (July 17)
NOTABLE NEWS ABOUT BTC
Bitcoin Price Forecast: BTC Recovers as Trump Steps In to Revive Crypto Legislation Momentum
Bitcoin (BTC) saw a mild recovery, trading around $119,000 at the time of writing on Wednesday, after falling nearly 2% the previous day. This rebound followed an announcement by U.S. President Donald Trump on Wednesday morning, stating that the GENIUS Act is ready to be passed by the House during the legislative “Crypto Week”, sparking optimism in the crypto market. Furthermore, institutional demand continues to grow, with spot Bitcoin ETFs recording over $400 million in inflows on Tuesday, extending the growth streak since July 2.
TECHNICAL ANALYSIS
🧠 Pattern Overview:
The chart clearly displays an Elliott Wave pattern (1) → (2) → (3) → (4) → (5) along with Fibonacci Retracement and Extension levels, helping to identify potential support and resistance zones.
1. Elliott Waves:
Wave (3) was completed around the $122,144 zone and the market is currently in the corrective wave (4).
Wave (5) is expected to move upward with targets at:
• 1.618 Fibonacci Extension: ~$127,404
• Or further: ~$130,747
2. Support Zone (grey area below):
Located around $115,000 – $116,000, which is:
• The 0.5 – 0.618 retracement of Wave (3)
• Aligned with the EMA200 and dotted black trendline support.
If the price falls into this area, it’s highly likely to bounce back and form Wave (5).
3. Danger Zone if Broken:
If this support fails, price may fall deeper to:
• $113,200 (0.786 retracement),
• Or even lower: $111,600 – $111,800
4. Potential Scenarios:
Two main outcomes:
• Continued Uptrend: Price bounces from the support zone and heads toward $127,000 – $130,000
• Breakdown: If the support breaks, a deeper decline may occur, breaking the wave structure.
Follow the channel for continuous and up-to-date analysis on XAUUSD, CURRENCIES, and BTC.
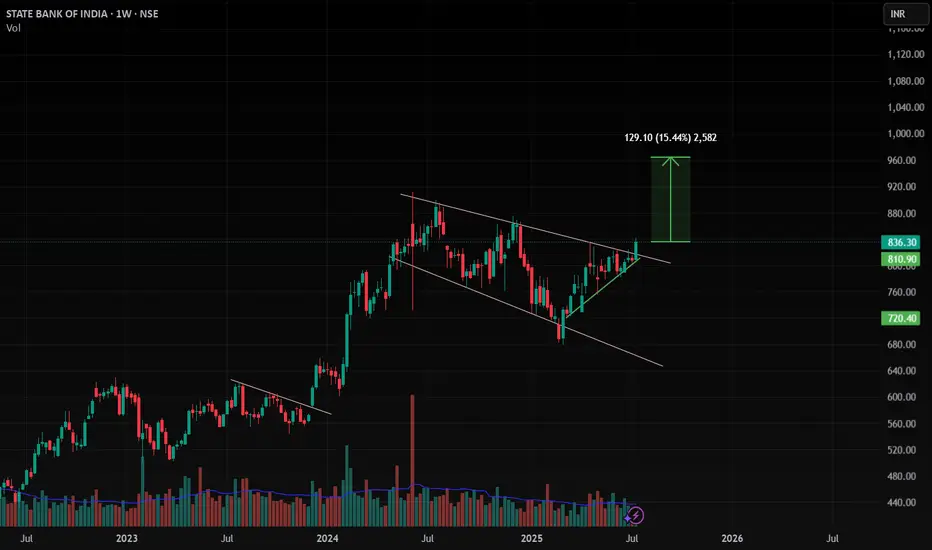
SBIN , 1W , Bullish As the Pattern is Formed and given Breakout , enter after strong candle close in weekly Timeframe and put SL below Swing low . follow proper risk management
follow for more swing ideas like this
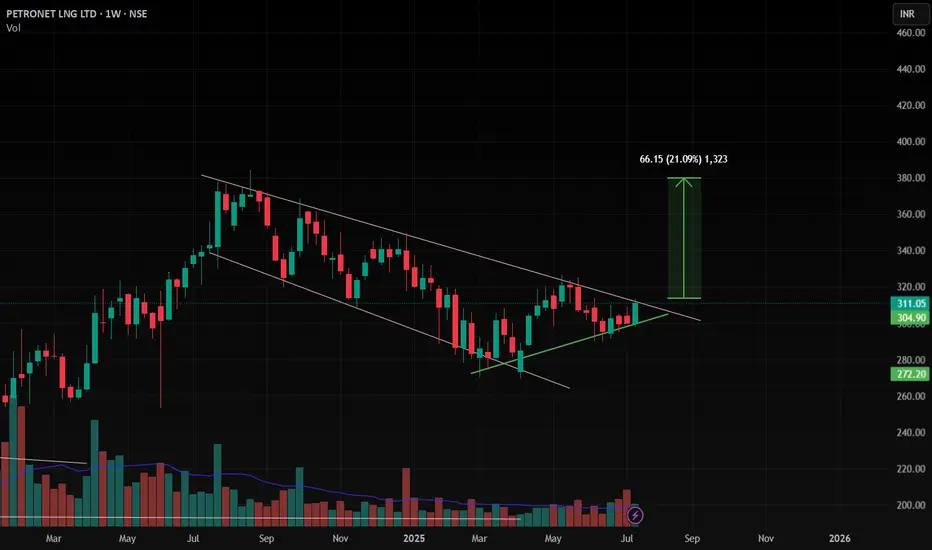
Petronet , 1W , BullishAs the Pattern is Formed and Ready for Breakout , enter after strong candle close in weekly Timeframe and put SL below Swing low . follow proper risk management
follow for more swing ideas like this
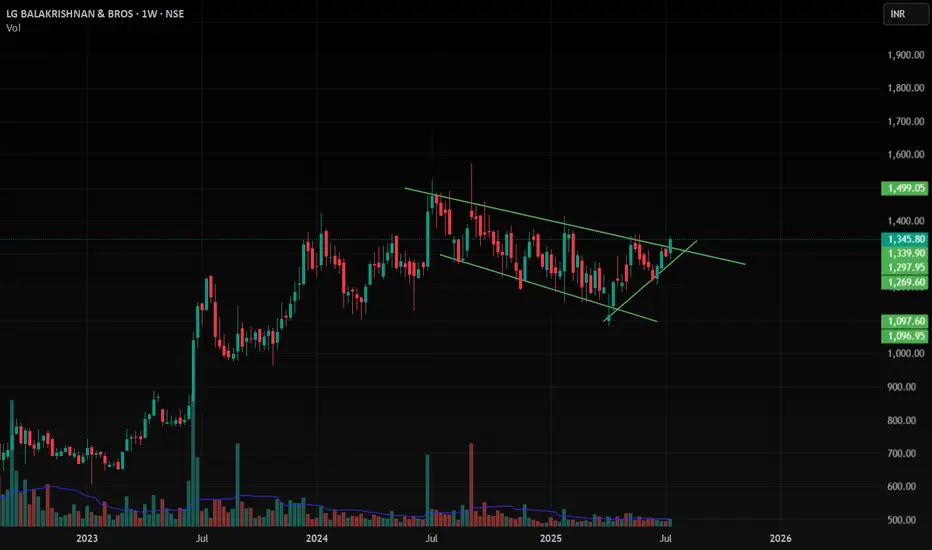
LGBBROSLTD , 1W , Bullish NSE:LGBBROSLTD as the channel pattern is Broken , wait for proper Close in Weekly then enter with proper risk management ,
put SL below its swing low
Follow for more swing ideas like this
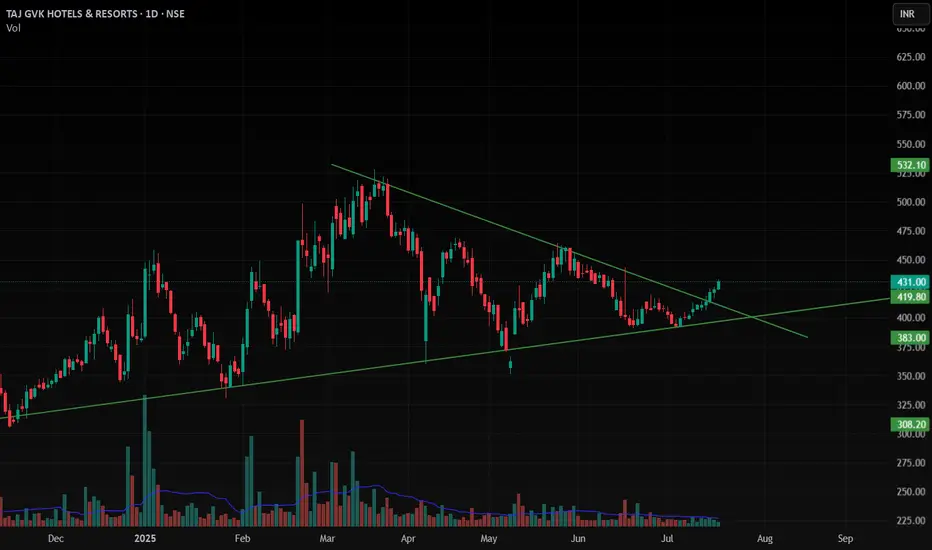
TAJGVK , 1D , Bullish as this stock given breakout from the Triangle Pattern with Good Volume , this stock is ready to Enter .
put SL below its swing low
follow more swing ideas like this .
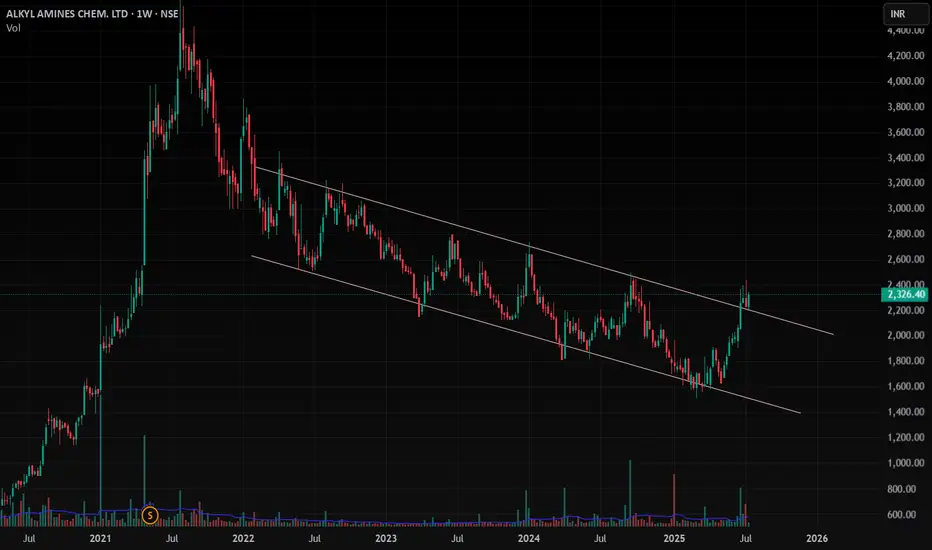
ALKYLAMINE , 1W , Bullishas this stock is given good breakout and now it is at Retest Point and You can enter with Good position Size with very minimal Risk
put the SL below the Swing Low . Take risk according to your position size
Follow for More Swing Ideas Like this
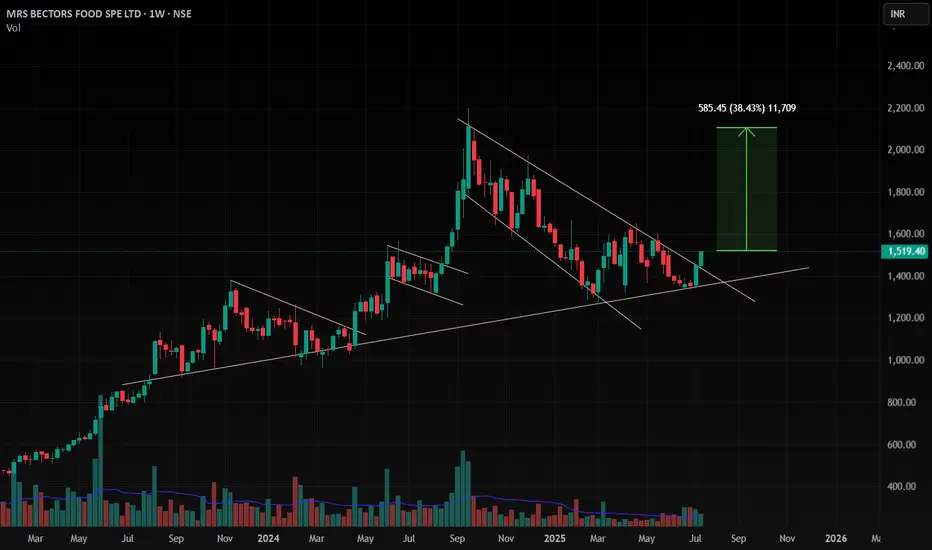
BECTORFOOD , 1W , Bullish As the trendline is giving support at below and formed a good pattern and given breakout with good close in weekly and daily .
This stock is ready to enter into this
Follow for more Ideas like this
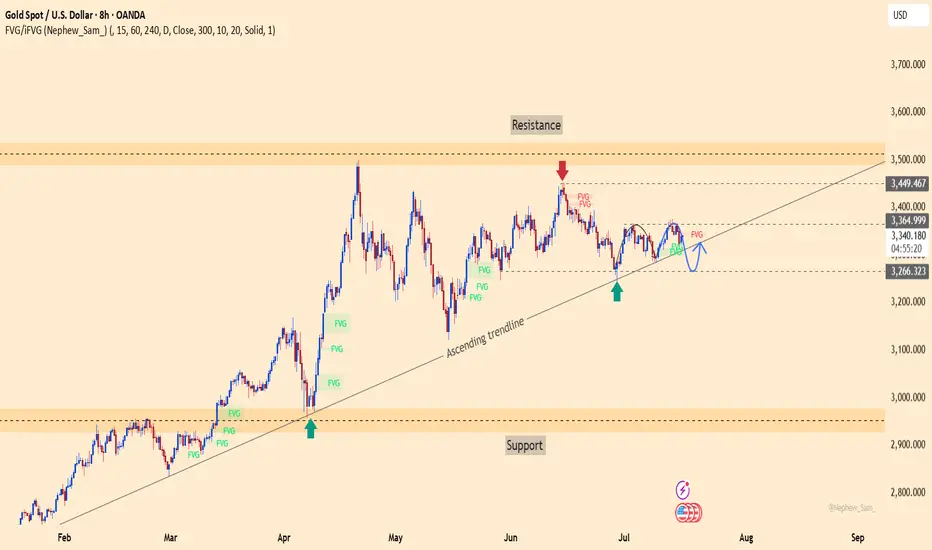
xauusd – is gold coiling up for a breakout?After multiple retests of the ascending trendline since March, gold (XAUUSD) continues to hold a solid bullish structure. While it hasn’t decisively broken through the 3,366 resistance, price action suggests that buyers are still in control. The repeated appearance of FVG zones signals smart money accumulation beneath the surface.
On the news front, U.S. PPI data came in at a 0.2% increase — exactly in line with expectations. This neutral result hasn’t given the USD a strong push, which may allow gold to maintain or even inch higher in the short term.
As long as the 3,265 support zone holds, the path remains open for a move toward the 3,449 target area. This might be the final consolidation before a powerful breakout. The question is: are you ready to ride the next leg up?
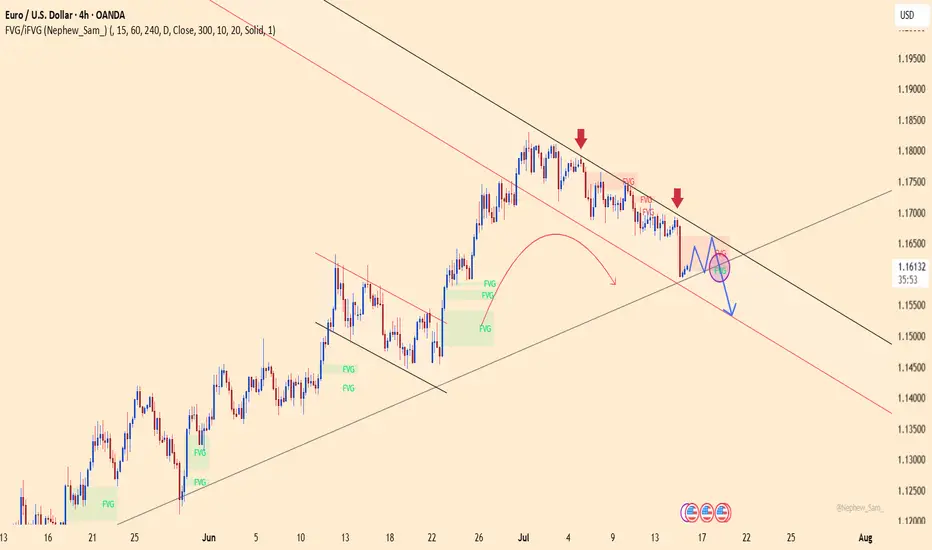
EURUSD – Weakness emerges at descending channel resistanceEURUSD remains within a well-defined descending channel and was recently rejected at the upper trendline – a key dynamic resistance zone. Price action shows the recovery is limited around 1.16600, with multiple FVG (Fair Value Gap) zones reinforcing the potential for further downside.
On the news front, the euro remains under pressure as Eurozone inflation data brought no surprises, while the US dollar is supported by June’s PPI rising exactly as expected at 0.2%. This combination leaves EURUSD with little momentum to break higher, making a move back toward the 1.15300 support area a scenario to watch.
If the price fails to break above 1.16600 and forms a lower high, the bearish trend will be further confirmed. Keep an eye on price behavior around the FVG zones to identify optimal entry points.
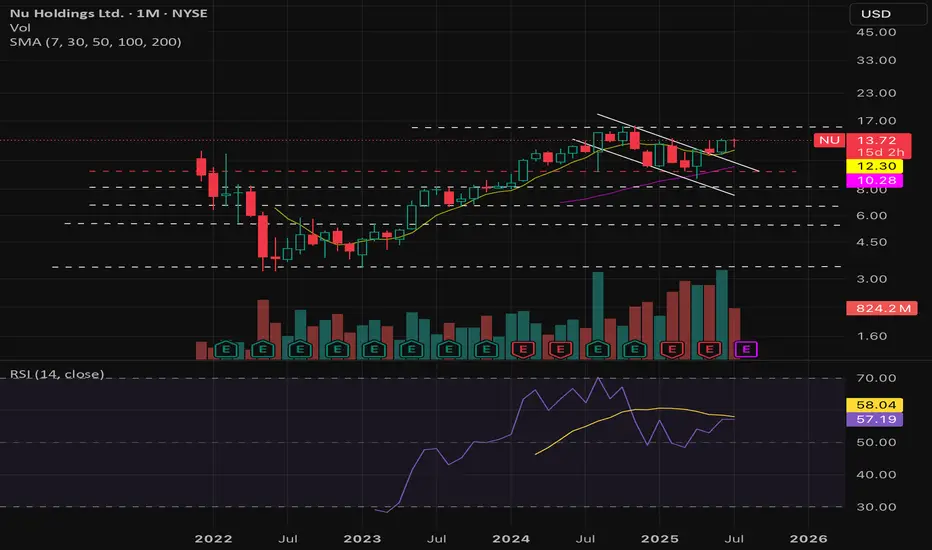
$NU : 30% CAGR for your portfolio for the next 3-5 years!- NYSE:NU is a big name in the LATAM.
- LATAM is expected to grow significantly in next decade with digitalization as the strongest theme.
- Let's talk about fundamentals:
Year | 2025| 2026| 2027 | 2028
EPS | 0.56 | 0.77 | 1.05 | 1.45
EPS growth% | 31.99% | 37.71% | 36.05% | 38.58%
For a company growing EPS at 30%+ deserves a forward p/e of 30
Base Case Stock Value ( Forward p/e = 30 ):
Year | 2025| 2026| 2027 | 2028
fair value | $16.8 | $23 | $31 | $43
Bear Case ( Forward p/e = 20 )
Year | 2025| 2026| 2027 | 2028
fair value | $11.2 | $15.4 | $21 | $29
Bull Case ( Forward p/e = 35 )
Year | 2025| 2026| 2027 | 2028
fair value | $19.6 | $26.95 | $36.75 | $50
GBPJPY – Eyeing new highs as bullish structure holdsGBPJPY continues to trade within a steady ascending channel and has recently bounced from short-term support around 198.200. If price breaks above 199.400, bullish momentum could strengthen, targeting the previous high near 200.800 — a key resistance zone that has been rejected before.
From a fundamental perspective, expectations that the Bank of England will maintain high interest rates to combat inflation are supporting the pound. Meanwhile, investor sentiment remains cautious toward the yen following dovish signals from the Bank of Japan. If upcoming UK economic data is positive, GBPJPY may continue climbing in the sessions ahead.
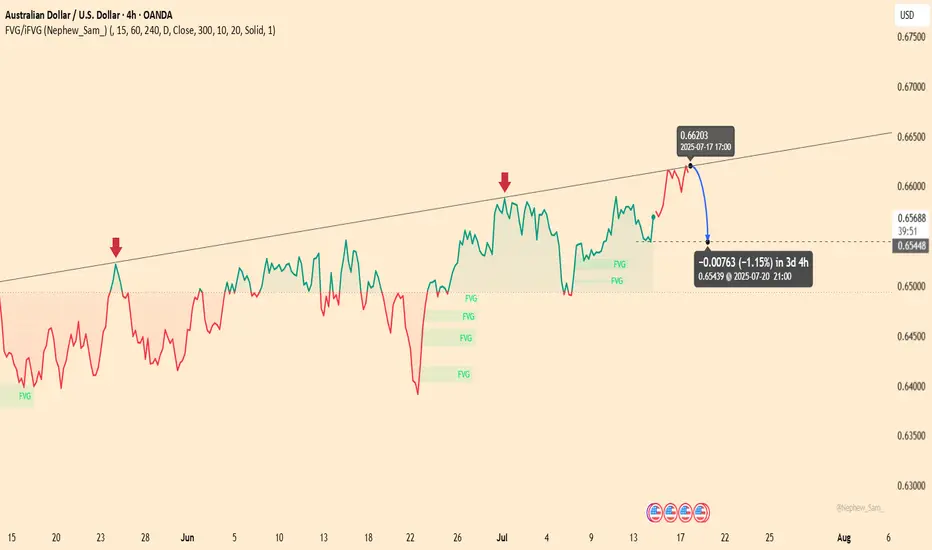
AUDUSD – Mild rebound, downside risk aheadAUDUSD is approaching a key trendline resistance after a short-term recovery. However, repeated rejections at this level in the past suggest a potential reversal is forming. The current structure mirrors previous setups – a mild rally into the trendline followed by weakness.
On the news front, recent U.S. economic data has supported the dollar, particularly stable job numbers and consumer confidence. Meanwhile, the market is awaiting the upcoming FOMC meeting minutes and Australia’s CPI report. Without a surprise boost from AUD fundamentals, the pair could face renewed downward pressure in the coming sessions.
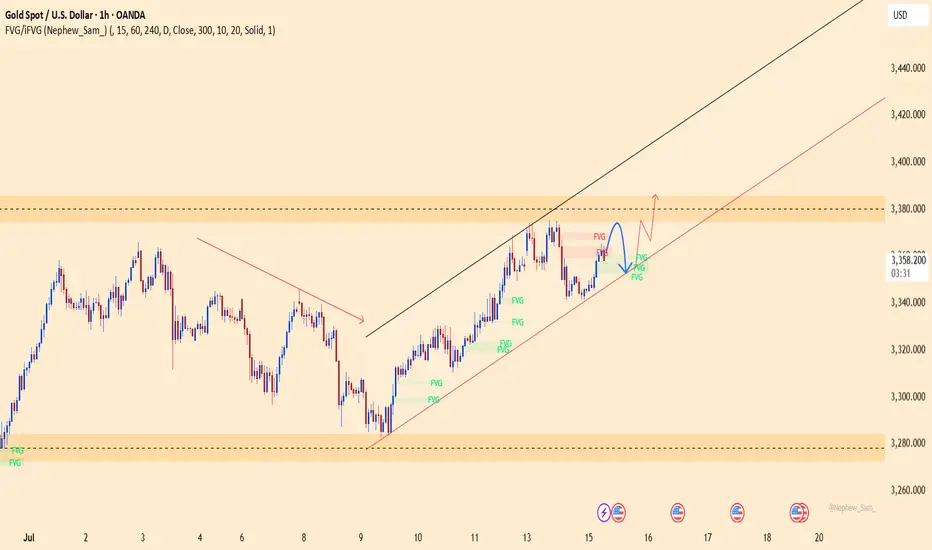
Gold set to surge? XAUUSD is holding firmly within a clear ascending channel on the H1 chart. After a strong rally, price is showing signs of a minor pullback toward the trendline support – potentially the last chance for buyers before gold accelerates toward the upper resistance zone.
On the news front, lower-than-expected U.S. producer inflation data has weakened the dollar, increasing gold’s appeal as a safe haven. In the coming days, key economic events like retail sales and comments from the Fed could serve as catalysts for the next bullish leg.
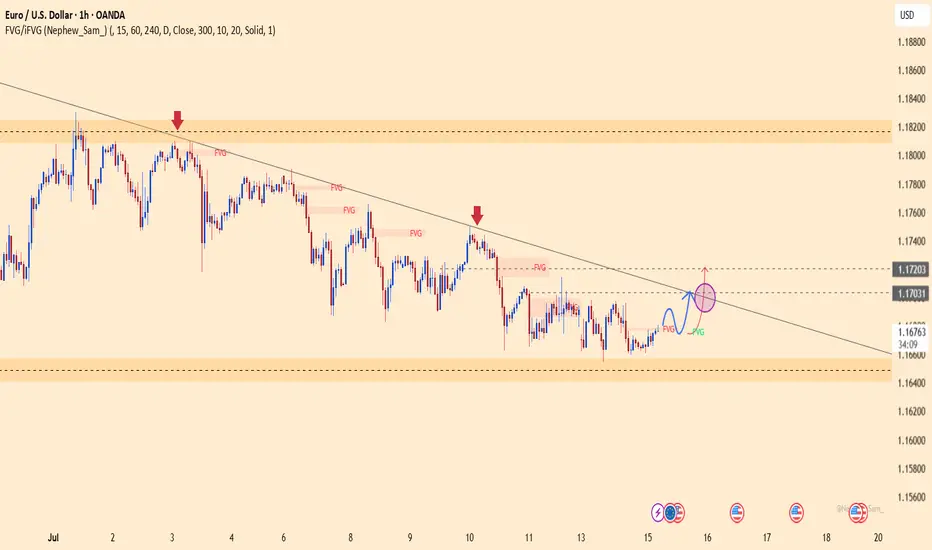
EURUSD – Bullish Momentum ReturnsEURUSD is gradually breaking free from downward pressure as it breaches the short-term accumulation structure, aiming for the resistance zone around 1.1720. On the chart, a clear bullish trend is emerging, supported by FVG signals reinforcing the recovery.
On the news front, expectations are rising that the European Central Bank will maintain a tighter policy stance for longer, as core inflation in the Eurozone remains elevated. Meanwhile, the USD is under corrective pressure following last week’s lower-than-expected U.S. CPI data. Upcoming statements from ECB and Fed officials today will be key in determining the next move for this currency pair.
Unless a surprise arises from the U.S. side, EURUSD is likely to sustain its short-term upward momentum and test the next technical resistance area.
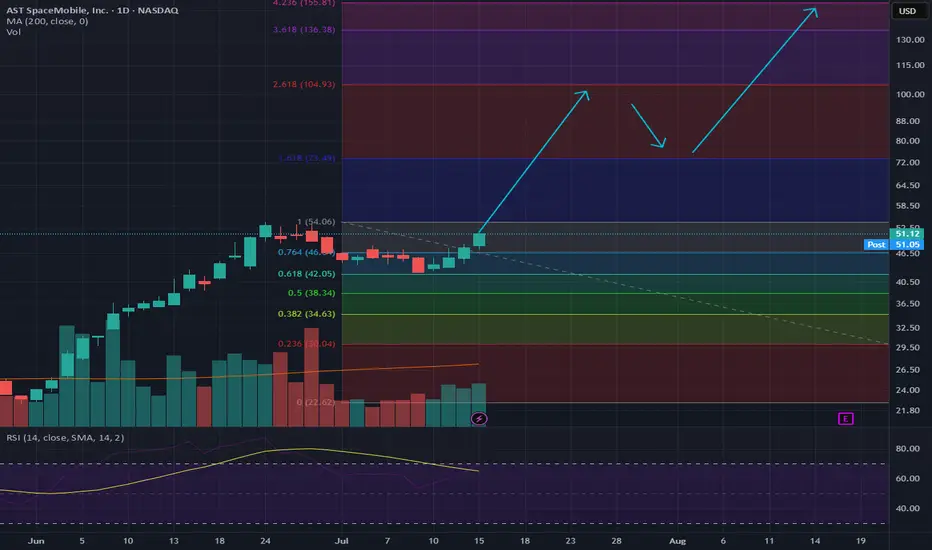
LONG-TERM $ASTSYou can't spell Sats without ASTS
This will be a trillion dollar company - here's the next few years, cheers!
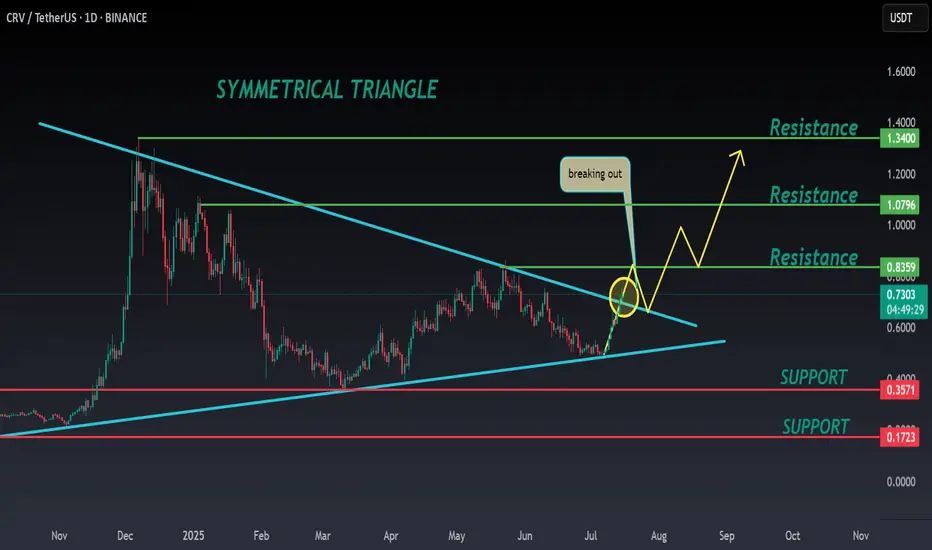
CRV ANALYSIS🔮 #CRV Analysis 💰💰
🌟🚀 As we can see that #CRV is trading in a symmetrical triangle and given a perfect breakout. But there is an instant resistance. If #CRV breaks the resistance 1 then we will see a good bullish move in few days . 🚀🚀
🔖 Current Price: $0.7280
⏳ Target Price: $1.0800
#CRV #Cryptocurrency #DYOR
$BABA don’t miss this milky bottle. Called this out at $105 in minds. This Monthly declining volume, support at $100, and uptrend pattern. China will boom into the end of Q3 and early 2026. Target is $180 and $200.
WSL.
