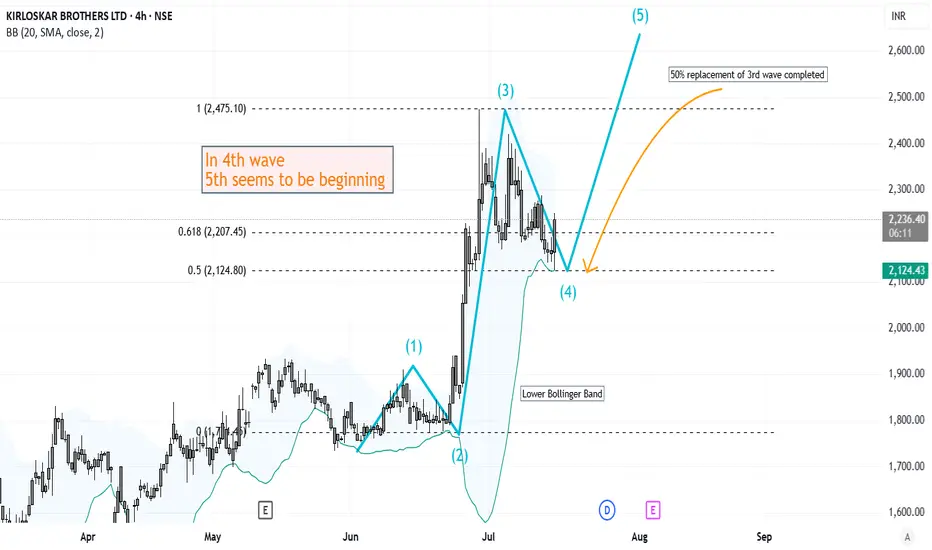
Elliott Wave Analysis of Kirloskar Brothers KIRLOSBROSThe script is currently in 4th wave of hourly chart. The 4th wave seems to be ending, which means a 5th wave will start from here. The wave patters and patterns, retracements and analysis have been highlighted on the chart. Will update this as it progresses.
Longsetup
$BABA 160+ before year end looks realistic thanks $NVDA- NASDAQ:NVDA export ban lifted for China will be beneficial for NASDAQ:NVDA for sure but main advantages would be for NYSE:BABA as they can get the shovels from the shop as well so that they can compete in Gold Rush and compete with NASDAQ:GOOGL , NASDAQ:META and other private companies like Open AI and Anthropic.
- There are good universities in China and NYSE:BABA is regional big tech in China which gets great talent. I'm confident that NYSE:BABA would be able to compete with NASDAQ:META & NASDAQ:GOOGL in building LLMs even better with this export ban lift.
- Long NYSE:BABA and short/avoid NASDAQ:META ( overvalued )

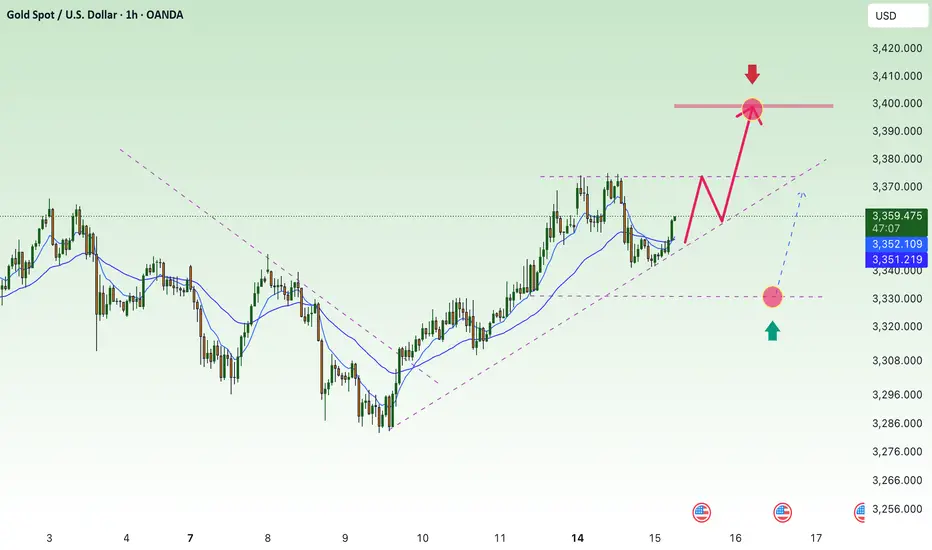
uptrend, heading towards 3400⭐️GOLDEN INFORMATION:
Gold prices (XAU/USD) climb toward $3,350 in early Asian trading on Tuesday, supported by renewed safe-haven demand after US President Donald Trump threatened sweeping 100% tariffs on Russia. Traders now shift focus to the upcoming US Consumer Price Index (CPI) report, which could offer further cues for the Federal Reserve’s policy outlook.
Late Monday, Trump warned that unless Russian President Vladimir Putin agrees to a peace deal to end the Ukraine conflict within 50 days, the US will impose 100% tariffs on Russian goods. The proposed sanctions, described as secondary tariffs, lack detailed clarification but have already fueled market anxiety. Heightened geopolitical tensions are likely to sustain near-term demand for gold as investors seek safety in the yellow metal
⭐️Personal comments NOVA:
Maintaining buying pressure above 3350, gold price in an uptrend, paying attention to CPI results to assess the inflation level of the world's number 1 economy
⭐️SET UP GOLD PRICE:
🔥SELL GOLD zone: 3400- 3402 SL 3407
TP1: $3390
TP2: $3380
TP3: $3370
🔥BUY GOLD zone: $3330-$3328 SL $3323
TP1: $3340
TP2: $3350
TP3: $3360
⭐️Technical analysis:
Based on technical indicators EMA 34, EMA89 and support resistance areas to set up a reasonable BUY order.
⭐️NOTE:
Note: Nova wishes traders to manage their capital well
- take the number of lots that match your capital
- Takeprofit equal to 4-6% of capital account
- Stoplose equal to 2-3% of capital account
EURUSD – Bearish Pressure Mounts Ahead of Triangle Breakout EURUSD is trading within a contracting triangle and currently leans toward a bearish bias. After several failed attempts to break the upper boundary, momentum is weakening, and the pair is showing signs of a potential breakdown toward lower support levels.
With several key events ahead, the euro may face additional pressure if upcoming Eurozone inflation data disappoints or if the Fed maintains a hawkish tone through upcoming speeches by U.S. officials. Unless there is a strong bullish catalyst, EURUSD is likely to correct further to the downside.
GBPJPY: Downside Pressure Increasing - Sell Opportunity!GBPJPY is showing clear signs of weakness, currently trading around 198.620. If it breaks and holds below 198.300, the bearish trend will be confirmed, with the next potential target at 192.000.
Upcoming key economic news from the UK (inflation, retail sales) and Japan (BOJ policy) will be decisive. Prioritize selling strategies, monitor news closely, and manage risk tightly.
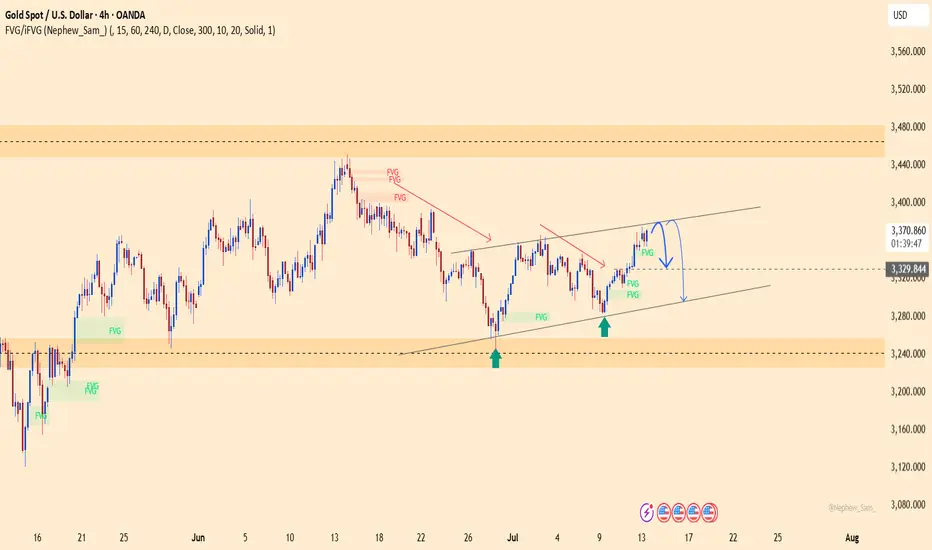
XAUUSD – Topping Out, Correction Pressure MountsGold prices are stalling after approaching the key resistance at $3,381, precisely at the upper boundary of the short-term ascending channel. The bullish momentum is fading as the USD and U.S. bond yields remain firm, supported by stable jobs data and a lack of clear rate guidance from the Fed.
Additionally, the World Gold Council (WGC) has warned of medium-term correction risks if geopolitical tensions ease or the dollar continues to strengthen — prompting buyers to stay cautious. In the near term, XAUUSD may pull back toward the $3,295 support zone before the market defines its next direction.
WELCORPi Observed these Levels based on Price Action and Demand & Supply which is my own Concept "PENDAM CONCEPTS"... Please don't take any trades based on this chart/post... Because this chart is for educational purpose only not for Buy or Sell Recommendation... Thank Q

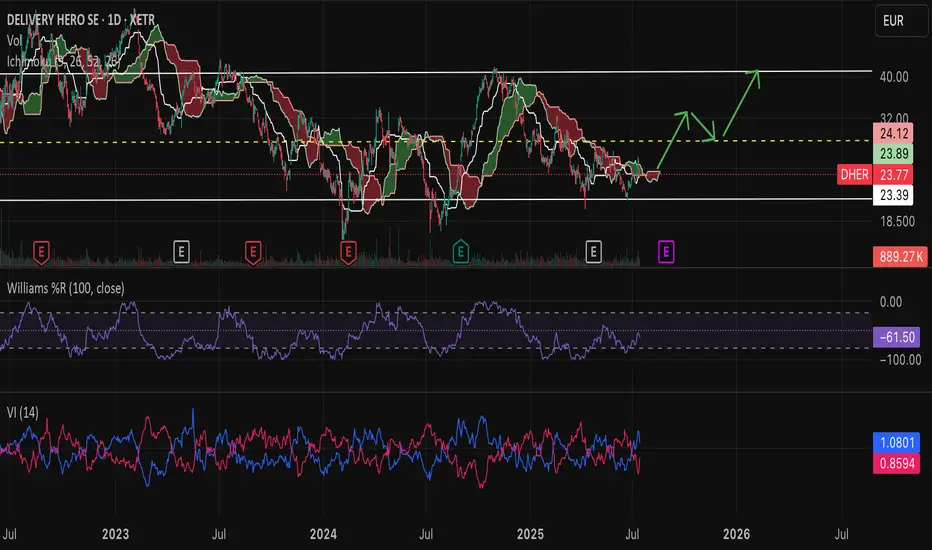
$DHER to $40- XETR:DHER i.e Delivery Hero is working towards profitability and exiting markets where it doesn't want to burn on operations.
- Company is becoming leaner, meaner and strategic in areas where it operates and dominates.
- Region MENA is growing (31% YoY)
- It has nice free cash flow per share growth. XETR:DHER posted ~227% YoY growth in free cash flow, putting it in the top 10% of its peers, well above its 3‑year average of ~32% .
recovery, towards 3400, gold price⭐️GOLDEN INFORMATION:
Gold prices (XAU/USD) extended their gains to around $3,365 during the early Asian session on Monday, as investors flocked to safe-haven assets in response to an escalation in global trade tensions.
The move comes after US President Donald Trump intensified the trade war over the weekend, announcing a 30% tariff on imports from the European Union and Mexico, effective August 1. This followed last week’s declarations of a 35% duty on Canadian goods and a sweeping 15%–20% tariff proposal on most trading partners, in addition to a 50% tariff on copper imports. Mounting concerns over the economic fallout from these aggressive trade measures have fueled demand for gold, a traditional refuge during times of uncertainty.
⭐️Personal comments NOVA:
Continued price increase, tariff pressure helps gold to be positive again
⭐️SET UP GOLD PRICE:
🔥SELL GOLD zone: 3384- 3386 SL 3391
TP1: $3376
TP2: $3364
TP3: $3352
🔥BUY GOLD zone: $3308-$3310 SL $3303
TP1: $3319
TP2: $3328
TP3: $3340
⭐️Technical analysis:
Based on technical indicators EMA 34, EMA89 and support resistance areas to set up a reasonable BUY order.
⭐️NOTE:
Note: Nova wishes traders to manage their capital well
- take the number of lots that match your capital
- Takeprofit equal to 4-6% of capital account
- Stoplose equal to 2-3% of capital account
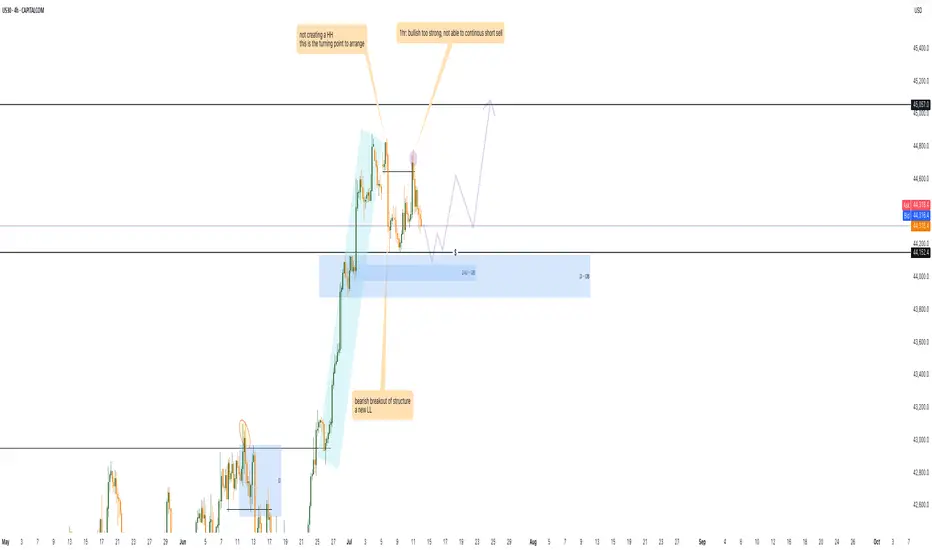
US30 prepare for the bullish 1. there is double bottom at 44152 level, i will tend to wait for the sweep meaning the price go down and hit the 4hr order block.
2. wait for 15m/ 30m TF a strong bullish momentum.
3. retest the 44152 around level or 0.618 to enter the market to long
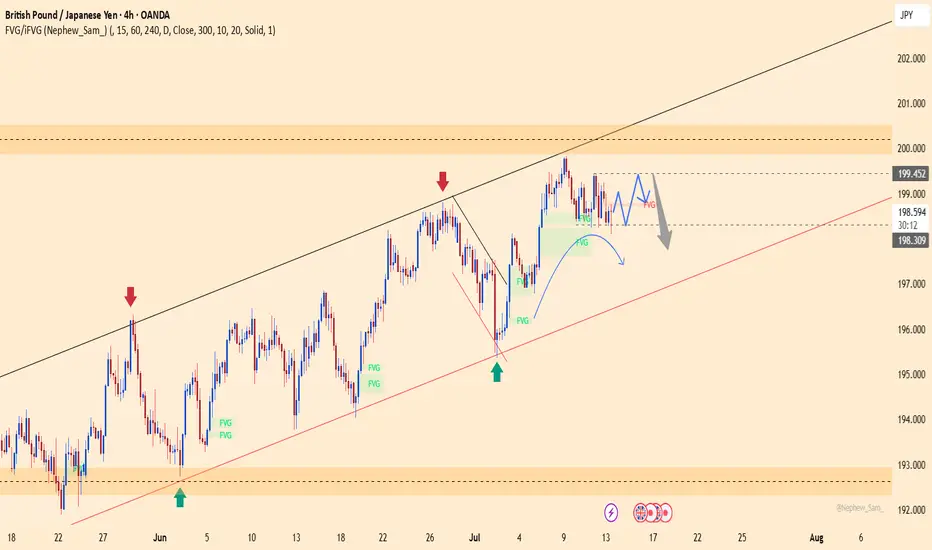
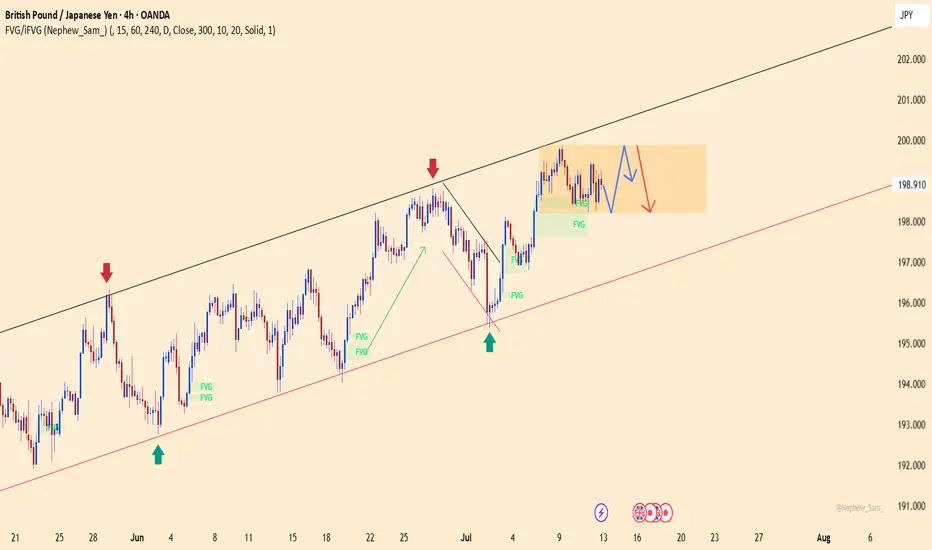
GBPJPY: floating at the top – is a drop being loaded?GBPJPY is hovering around 198.91 after an impressive rally, but now it's trapped between two key zones: 199.85 – a resistance level that keeps rejecting price, and 198.20 – a fragile support below. The price action reveals a tense sideways pattern, like a spring coiling up before release.
What’s concerning is that buyers have attempted to break above the high multiple times and failed – and each failure comes with weaker rebounds. With the Bank of England shifting toward a “pause” stance and the yen gaining mild support from rising risk-off sentiment, the market is starting to lean toward a correction.
If price breaks below 198.20, it could mark the beginning of a deeper slide back toward the lower boundary of the channel. Don’t be fooled by the silence – sometimes, calm is the precursor to a sharp fall.
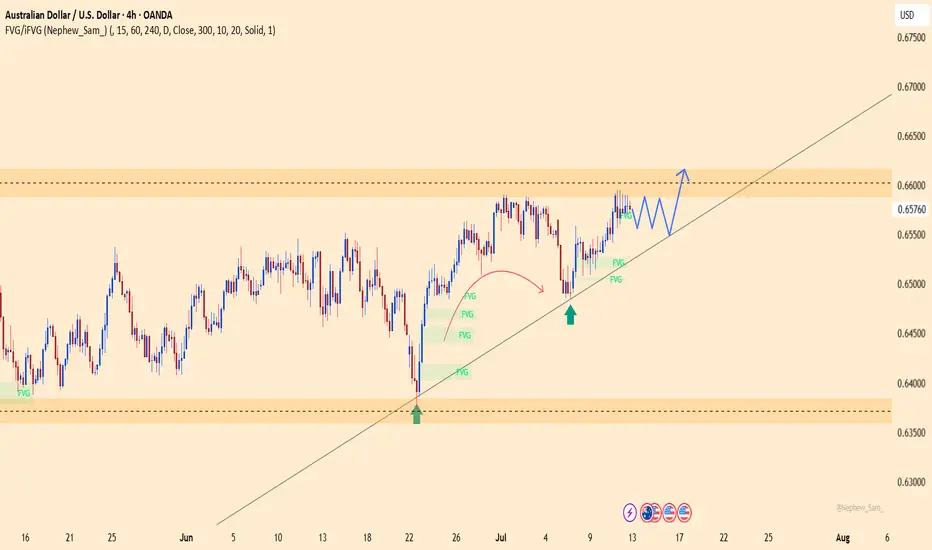
AUDUSD holds bullish structureAUDUSD is currently trading around 0.6576, maintaining a clear uptrend with higher lows and strong respect for the ascending trendline. A consolidation pattern is forming just below the key resistance zone at 0.6600–0.6617, suggesting a potential breakout if price stays above the support at 0.6546.
On the news front, the Australian dollar is supported by expectations that the RBA will keep interest rates high, while the USD is under slight pressure following weaker U.S. job data this week. Additionally, improving consumer data from China – Australia’s major trading partner – is further boosting AUD sentiment.
If the price breaks above 0.6617, AUDUSD could extend its rally into next week. Buyers are in control – have you planned your entry yet?
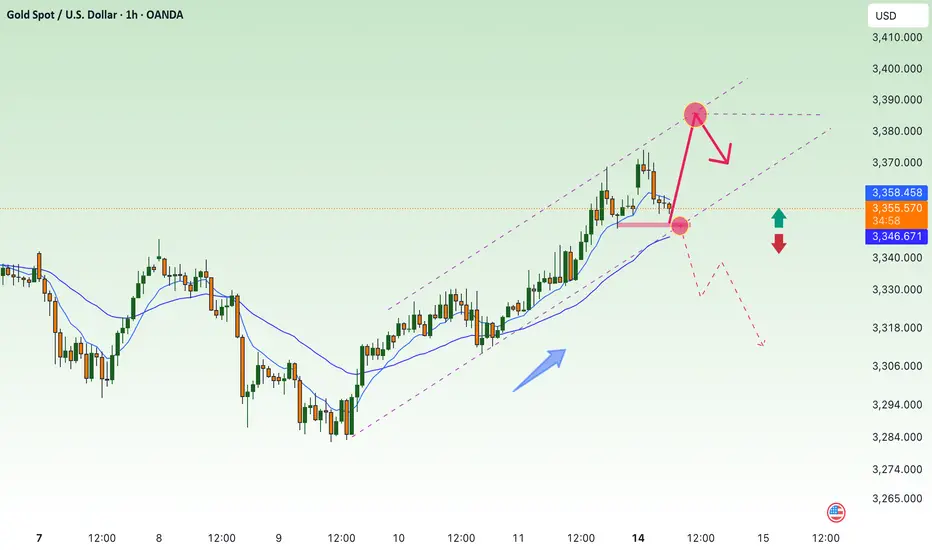
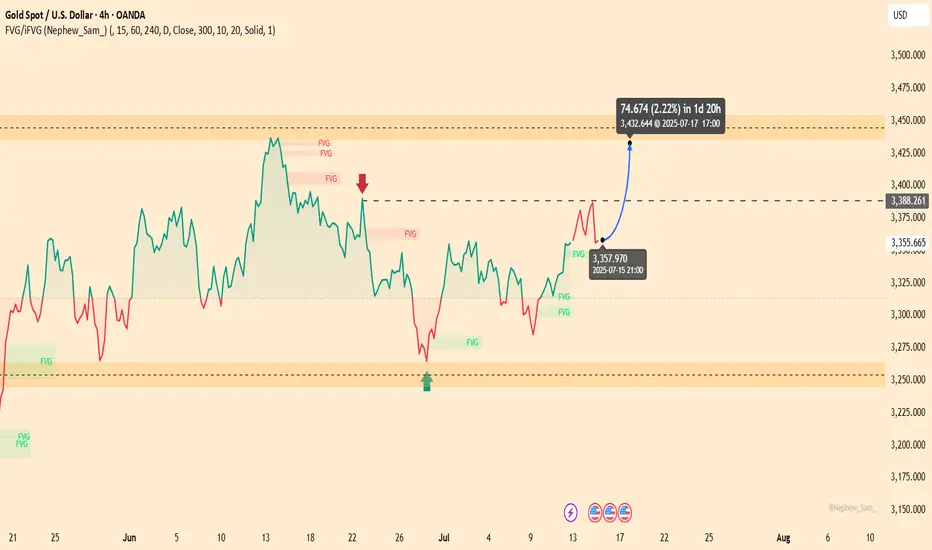
GOLD EYES 3,360 BREAKOUT – IS THIS THE BUY SETUP?Gold is currently trading around $3,355, up 18 pips from yesterday. The bullish momentum is fueled by rising trade tensions as Trump imposes 35–50% tariffs on Canada and Brazil, along with a weakening USD and falling U.S. bond yields.
Technically, gold maintains a clear uptrend with higher lows. The $3,360 zone is now a key breakout level — if breached, price could surge toward $3,432. As long as gold holds above $3,250, the bullish structure remains intact.
What’s your move — breakout or pullback?
short recovery, trend line✍️ NOVA hello everyone, Let's comment on gold price next week from 07/14/2025 - 07/18/2025
⭐️GOLDEN INFORMATION:
Gold prices surged nearly 1% on Friday as market sentiment soured in response to US President Donald Trump’s controversial trade policies targeting Canada, while hinting at broader tariffs on other nations and copper. At the time of writing, XAU/USD is trading at $3,354, rebounding from intraday lows of $3,322.
On Thursday, Trump announced a 35% tariff on Canadian imports, though goods complying with the 2020 USMCA trade agreement remain exempt. He also signaled intentions to expand tariffs across most trading partners, proposing blanket rates ranging from 15% to 20%.
With a light US economic calendar, attention turned to Fed commentary. Chicago Fed President Austan Goolsbee pushed back on calls for rate cuts aimed at reducing government borrowing costs, stressing the central bank’s focus remains firmly on employment and price stability.
⭐️Personal comments NOVA:
growth according to the trend, maintaining the accumulation price zone above 3300
🔥 Technically:
Based on the resistance and support areas of the gold price according to the H4 frame, NOVA identifies the important key areas as follows:
Resistance: $3392, $3447
Support: $3330, $3308, $3246
🔥 NOTE:
Note: Nova wishes traders to manage their capital well
- take the number of lots that match your capital
- Takeprofit equal to 4-6% of capital account
- Stoplose equal to 2-3% of capital account
- The winner is the one who sticks with the market the longest
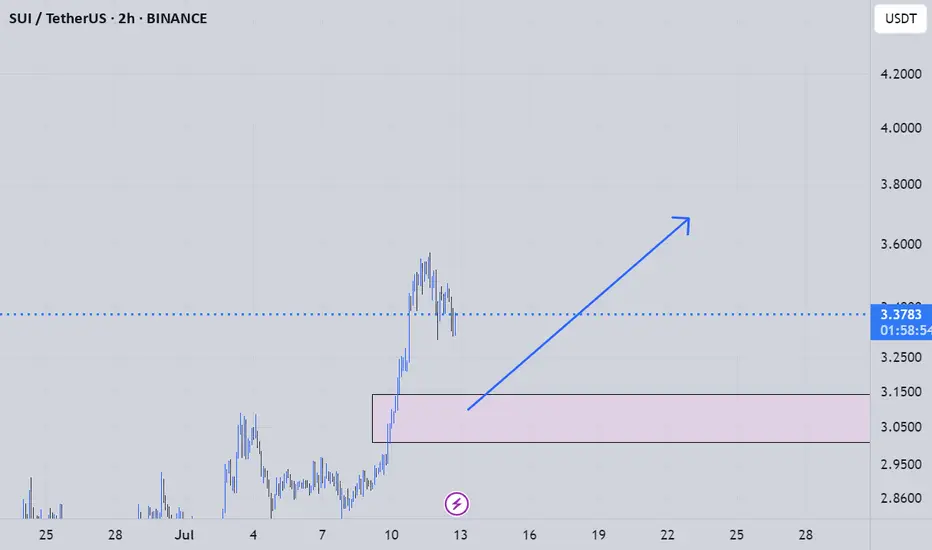
suiusdt long analysyou can use this analys for your spot trades its a longsetup for making a good profit and a getting on a big trend
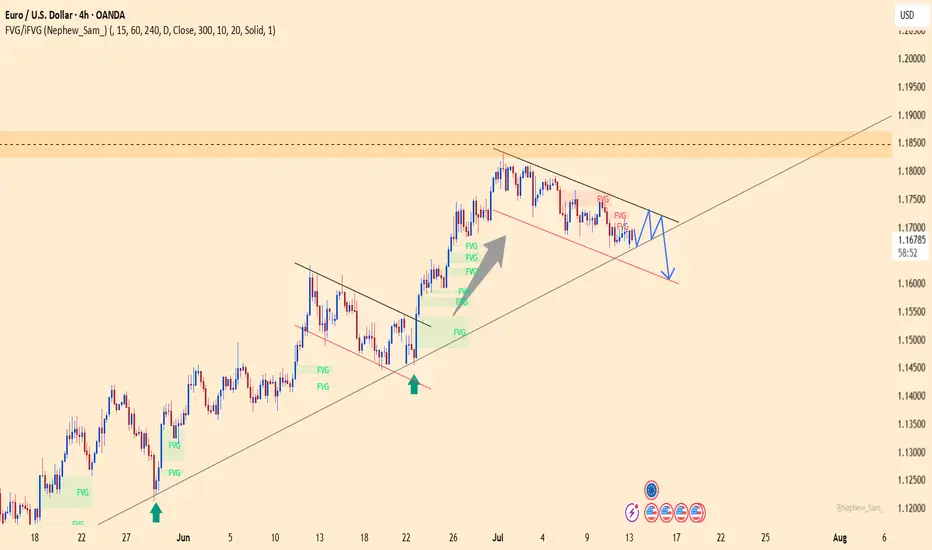
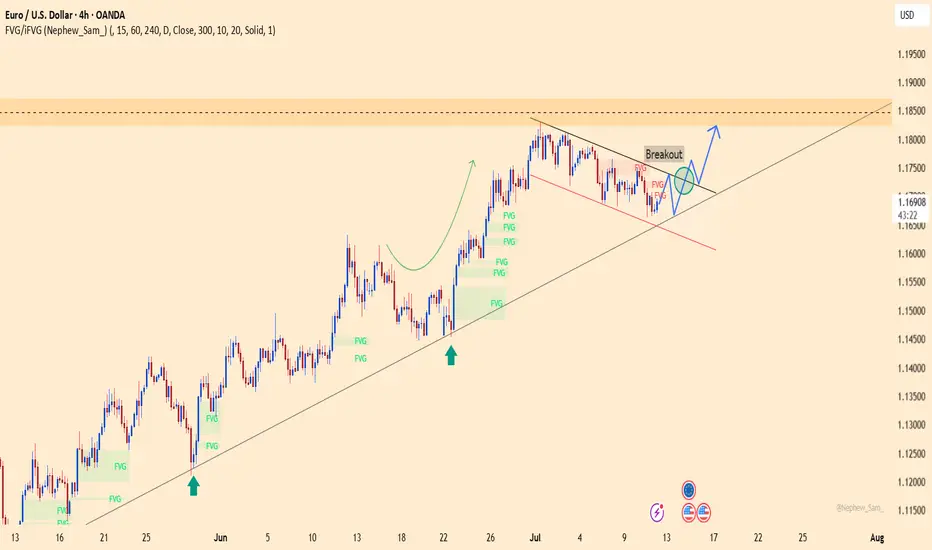
EURUSD – Breakout Confirms Bullish ContinuationEURUSD has just successfully broken out of a corrective triangle pattern, confirming that the bullish structure remains intact. The price reacted well to the support zone around 1.1660 and bounced back, opening the way toward the 1.1820 target in the short term.
On the news front, the euro is gaining support as the Eurozone’s July CPI held steady at 2.6%, indicating that inflationary pressures have not fully eased—this may prompt the ECB to maintain a tighter policy for longer. Meanwhile, the USD is under mild correction pressure after U.S. CPI came in higher than expected but not strong enough to reignite rate hike expectations from the Fed.
Given the current technical setup and news backdrop, EURUSD could continue rising in the coming sessions as long as it holds above the trendline support.
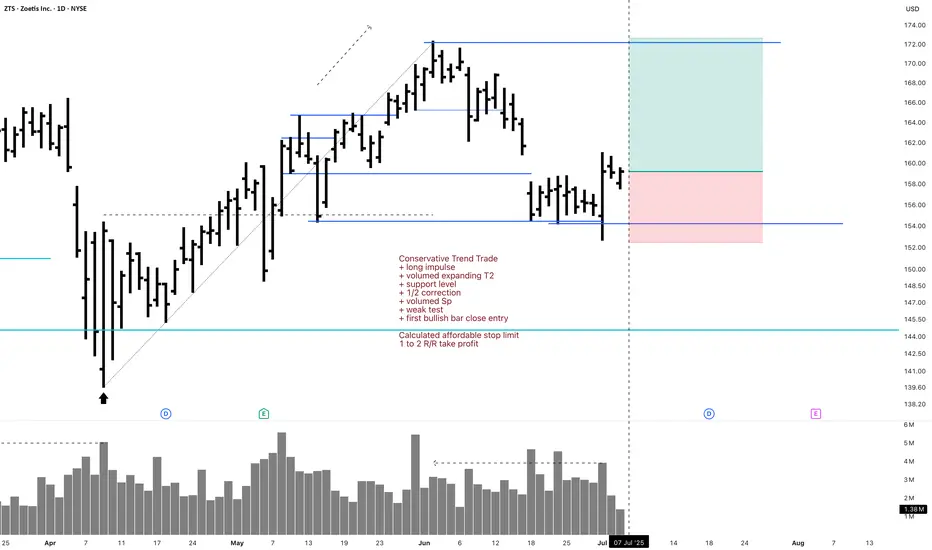
ZTS Investment 1D Long Conservative Trend TradeConservative Trend Trade
+ long impulse
+ volumed expanding T2
+ support level
+ 1/2 correction
+ volumed Sp
+ weak test
+ first bullish bar close entry
Calculated affordable stop limit
1 to 2 R/R take profit
Monthly trend
"+ long impulse
+ ICE level
+ support level
+ 1/2 correction
+ volumed 2Sp
+ weak test?"
Yearly trend
"+ long impulse
- correction"
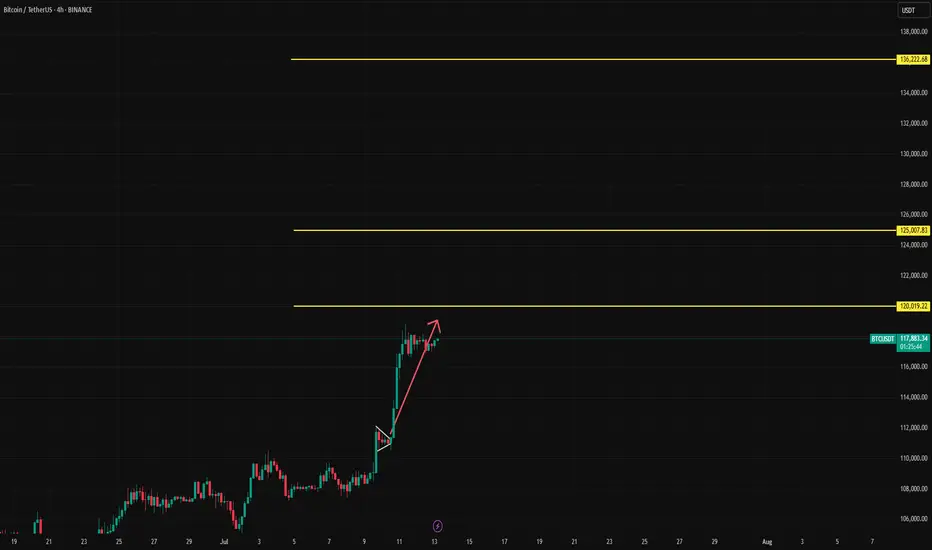
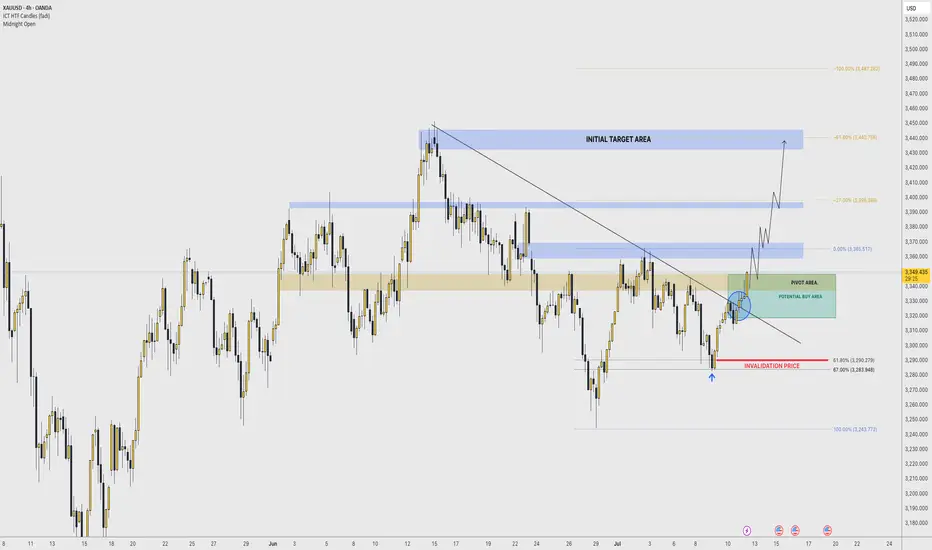
THE LONG SHOT 〉POTENTIAL OUTLOOKAs illustrated, I'm trying to visualize how a potential continuation impulse could look like during " Bullish July " and toward the end of the year (depending on how aggressive buyers step in; specially central banks and institutions).
As you can see on this Daily chart, price respected a long term trend line + is forming higher lows, funneling into a shorter and shorter range of accumulation.
This is a very strong bullish behavior; when price gets tighter and tighter respecting a resistance level, but making higher lows. It tends to indicate that price is accumulating and "loading" (sort of speak).
Now, analyzing gold from the fundamental aspect, one MUST align those factors with price. In other words: DOES IT MAKE SENSE TO BE BULLISH OR "THINK" PRICE COULD RISE?
Well, ask yourself and do the research on the following (but not limited to) questions:
1. How is the US dollar doing? (Since it is the world's "reserve" currency)
2. Are the interest rates in the USA favoring the economy?
3. How is the world economy as a whole doing?
- inflation in the top world powers and important economies?
4. How is international trade policy looking like for the world?
- Positive or negative? Are countries happy with each other currently, trading without any issues? (Or maybe... there's a tariff war and a trade war goin on?...)
5. Politically speaking, is the general public UNITED or POLARIZED? (politics is a key fundamental aspect for the price of gold, as it either adds to uncertainty and tensions, or it calms things down).
6. Geopolitically speaking (and most importantly); is the "conflict" (war) ending, getting better, resolving? ...
7. Where is the money going and flowing? Black rock, vanguard, and other top hedge funds; where are they investing their money? ( because central banks keep BUYING gold... )
Those are some of many many questions one must study and understand, in order to align the technical aspects of the price of the yellow metal.
If any question/factor DOES NOT POINT to bullishness in price, then the technical and price projection of any analysis starts to have weakness.
On the other hand, if the fundamental factors and questions in play INDEED POINT toward an uncertain situation, adding bullishness to the price, any analysis and bullish projection simply has those aspects to its favor.
--
GOOD LUCK!
persaxu

Clear breakout Clear trendline breakout and good to go long. Check volume and do your own analysis too. This is only for educational purposes.
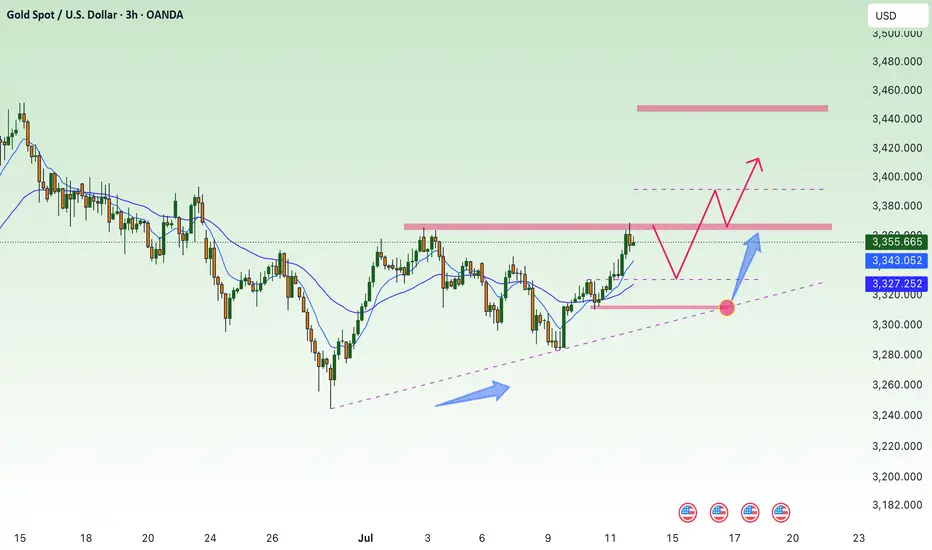
IMPORTANT BREAKOUT 〉BULLS ARE BACKAs illustrated, price has broken out of an important 4H and 1D trend line that had kept price bearish since the beginning of the month.
Yesterday, gold made its way to a ket resistance level and broke it, CLOSING above it in the 4H timeframe, which is a key sign that bulls are back.
An interesting sign is that price bounced from the 61.8 - 67% retracement of the last bullish impulse that had an extended correction.
Should price manage to stay above 3250-3300 next week, , (a very strong psychological and algorithmic price range), the path to a new ATH is well opened and the probabilities arise on its favor.
I try to visualize a potential buy area shown in green, and the invalidation of this idea would be the level from which price has bounced.
--
I have been bullish on gold since 2023, ignoring any correction to be a "bearish market" and rather accumulation phases of longer term potential for growth.
The world economy and geopolitical conflict along many other financial macroeconomic data and circumstances, are simply NOT pointing toward a better future, and gold is screaming so by continuing to rise, and central banks back this up by continuing to buy it physically.
--
GOOD LUCK
ASAHI INDIA GLASS- Bullish Flag & Pole Breakout (Daily T/F)Trade Setup
📌 Stock: ASAHI INDIA GLASS ( NSE:ASAHIINDIA )
📌 Trend: Strong Bullish Momentum
📌 Risk-Reward Ratio: 1:3 (Favorable)
🎯 Entry Zone: ₹851.00 (Breakout Confirmation)
🛑 Stop Loss: ₹809.00 (Daily Closing Basis) (-5 % Risk)
🎯 Target Levels:
₹875.10
₹897.85
₹920.90
₹945.65
₹969.00.00 (Final Target)
Technical Rationale
✅ Bullish Flag & Pole Breakout - Classic bullish pattern confirming uptrend continuation
✅ Strong Momentum - Daily RSI > 60, Weekly RSI >60 Monthly rsi >60
✅ Volume Confirmation - Breakout volume 121.30K vs previous day's 1.63M
✅ Multi-Timeframe Alignment - Daily and weekly charts showing strength
Key Observations
• The breakout comes with significantly higher volume, validating strength
• Well-defined pattern with clear price & volume breakout
• Conservative stop loss at recent swing low
Trade Management Strategy
• Consider partial profit booking at each target level
• Move stop loss to breakeven after Target 1 is achieved
• Trail stop loss to protect profits as price progresses
Disclaimer ⚠️
This analysis is strictly for educational purposes and should not be construed as financial advice. Trading in equities involves substantial risk of capital loss. Past performance is not indicative of future results. Always conduct your own research, consider your risk appetite, and consult a financial advisor before making any investment decisions. The author assumes no responsibility for any trading outcomes based on this information.
What do you think? Are you watching NSE:ASAHIINDIA for this breakout opportunity? Share your views in the comments!

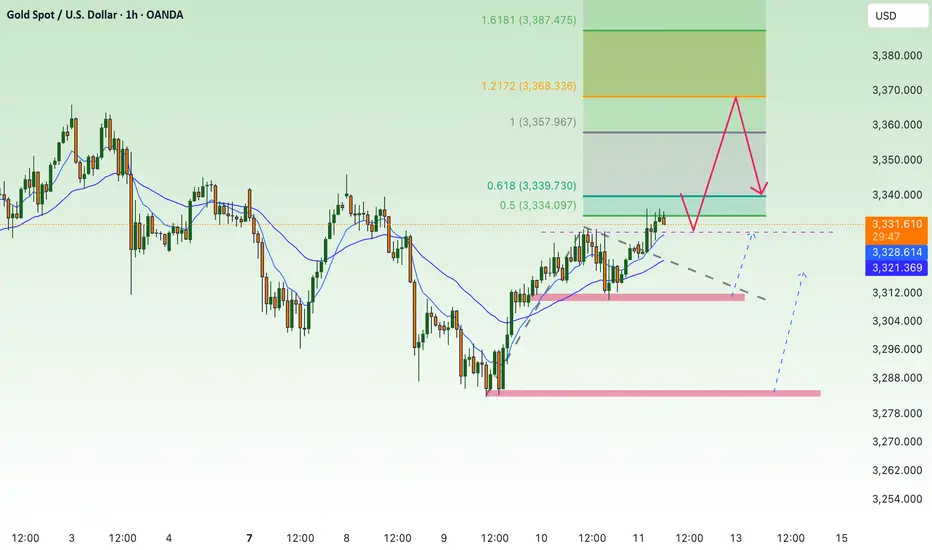
Uptrend at the end of the week 3367, maintain the upward force⭐️GOLDEN INFORMATION:
Gold prices (XAU/USD) are on track to notch a third straight day of gains on Friday, climbing toward the upper boundary of this week’s trading range as escalating trade tensions fuel safe-haven demand. In a significant intensification of global trade disputes, US President Donald Trump issued formal notices this week to multiple trading partners, detailing individual tariff rates set to take effect on August 1 should no agreements be reached. This has rattled investor sentiment and weighed on risk assets, offering solid support to Gold.
Meanwhile, expectations for an imminent interest rate cut by the Federal Reserve (Fed) have cooled following last week’s strong US jobs data. As a result, the US Dollar (USD) remains firm, holding near a more than two-week high reached on Thursday. This USD strength could limit the upside for the non-yielding yellow metal in the near term. Therefore, traders may look for a sustained breakout before committing to further bullish positions in the XAU/USD pair.
⭐️Personal comments NOVA:
Gold price breaks 3330, maintaining good buying pressure, recovering at the end of the week
⭐️SET UP GOLD PRICE:
🔥SELL GOLD zone: 3367- 3369 SL 3374
TP1: $3355
TP2: $3342
TP3: $3325
🔥BUY GOLD zone: $3306-$3308 SL $3301
TP1: $3315
TP2: $3325
TP3: $3338
⭐️Technical analysis:
Based on technical indicators EMA 34, EMA89 and support resistance areas to set up a reasonable BUY order.
⭐️NOTE:
Note: Nova wishes traders to manage their capital well
- take the number of lots that match your capital
- Takeprofit equal to 4-6% of capital account
- Stoplose equal to 2-3% of capital account