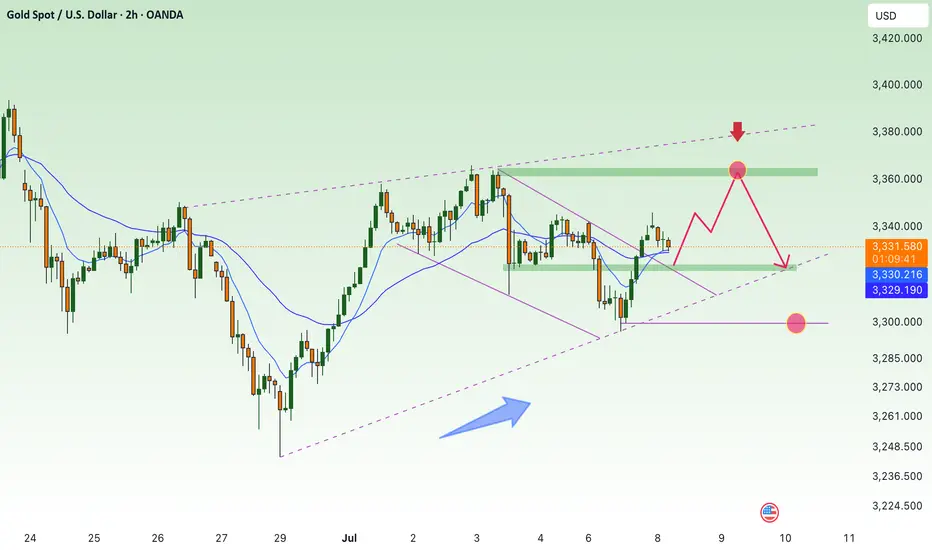
XAUUSD – Gold Surges on Safe-Haven Flows and Strategic BuyingXAUUSD is rebounding from the bottom of a descending channel, showing signs of breaking through the short-term resistance around $3,332.700. If price holds above this level, the bullish momentum could extend toward $3,350 and beyond.
On the news front, President Trump's announcement of new import tariffs on multiple countries has triggered safe-haven inflows into gold. Meanwhile, consistent buying from central banks and the ongoing trend of global de-dollarization continue to provide solid support. Unless a major negative shock occurs, gold is likely to maintain its upward momentum in the short term.
Longsetup
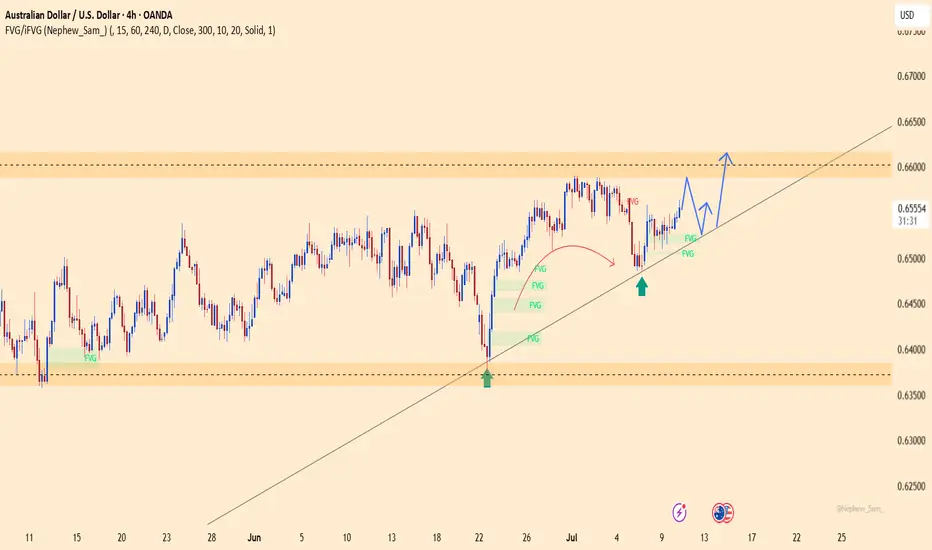
AUDUSD – The Spring Is Loading!AUDUSD has just pulled off an impressive rebound from the 0.6460 support zone, bouncing cleanly off the ascending trendline — like a compressed spring ready to launch. The repeated appearance of Fair Value Gaps after recent upward moves reveals a critical clue: smart money is stepping back in, and this time, they want control.
The price is now testing the familiar resistance at 0.6616 — a zone that has previously rejected several bullish attempts. But this time feels different. The US dollar is clearly losing steam after softer CPI data, pushing bond yields lower and giving AUD a tactical edge.
If the 0.6520 support holds strong, the next breakout won’t just be about overcoming resistance — it could be the spark for a new bullish wave. And when that wave hits... it won’t go unnoticed.
GBPJPY – Correction Pressure Is Building UpGBPJPY is still trading within a well-defined ascending channel on the H4 chart. However, recent signals suggest a potential short-term correction. The price has repeatedly rejected the upper boundary of the channel and is now forming a distribution pattern with lower highs. The FVG zone near 200.400 may act as a short-term take-profit area before price pulls back toward the support zone around 198.400, which also aligns with the lower trendline.
Additionally, the upcoming UK GDP data this week could strongly impact GBP. If the data comes in weaker than expected, downside pressure may intensify and reinforce the developing correction scenario. Traders should monitor price action around 198.400 for confirmation of the pullback.

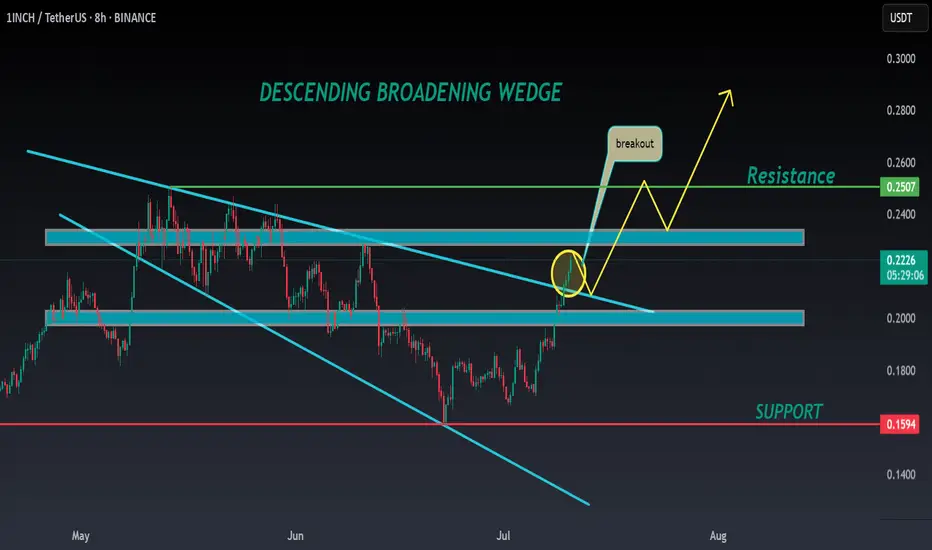
1INCH ANALYSIS🔮 #1INCH Analysis 🚀🚀
💲💲 #1INCH was trading in a Descending Broadening Wedge Pattern, give a perfect breakout and will retests the levels. If the price of #1INCH sustains the breakout then we will see a bullish move. 📈📈
💸Current Price -- $0.2220
📈Target Price -- $0.2510
⁉️ What to do?
- We have marked crucial levels in the chart . We can trade according to the chart and make some profits. 🚀💸
🏷Remember, the crypto market is dynamic in nature and changes rapidly, so always use stop loss and take proper knowledge before investments.
#1INCH #Cryptocurrency #Breakout #DYOR
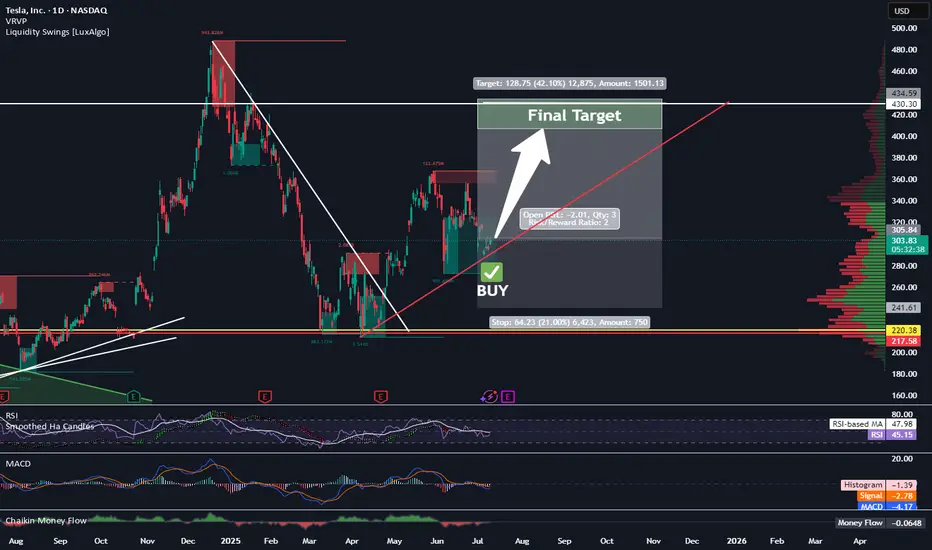
Long TESLATrading Fam,
Today my indicator has signaled a BUY on $TSLA. The technicals align. M pattern looks to have completed at strong support (RED TL) and is bouncing upwards inside of a solid liquidity block. Buyers are stepping in. I'm in at $315 and will shoot for $430 (probably taking some profit along the way). My SL is currently $241 but will trail as we enter profit.
Best,
Stew
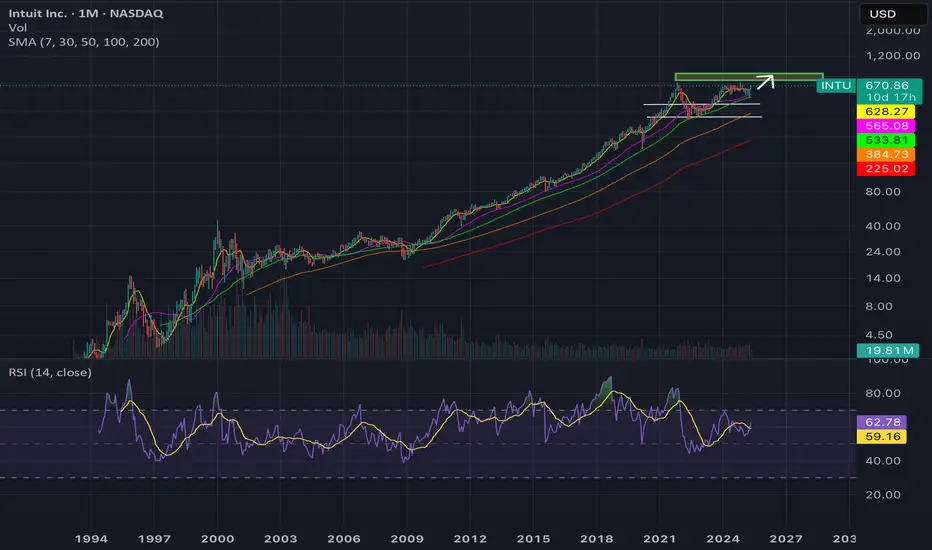
Juggernaut to ATH PT : $750-850- Absolute juggernaut of a company. Top tier management and solid execution lately deserves premium valuation.
- NASDAQ:INTU is moving up market i.e targeting on mid markets as compared to just focussing on SMBs ( Small & Medium Sized Businesses )
- Company has a MOAT all those FUD regarding simplification of tax laws/rules was overblown.
- Company should do well irrespective of the MACRO. Even, if US enters recession, People gotta file taxes and do accounting. Some segments will show weakness in case of recession like Mailchimp and Credit Karma. But TurboTax and Quickbooks are all weather products.
- Final take: NASDAQ:INTU should break to all time highs if the upcoming quarter impresses.
- PT: 750-850
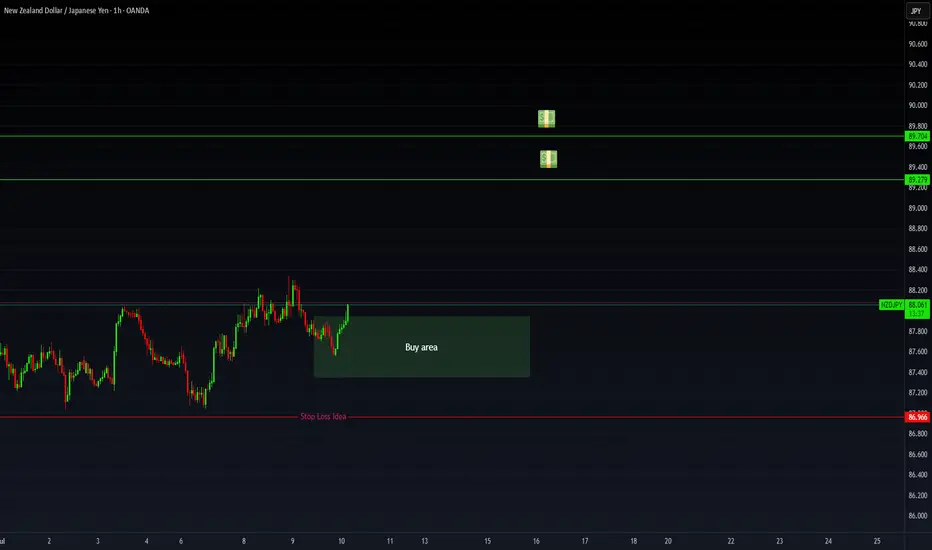
NZDJPY Long Setup: Institutional Flow Signals Upside to 89.690🗓 Seasonal Outlook
- JPY Seasonal Weakness: Historical trends show July and August tend to be bearish months for the Japanese Yen, reinforcing weakness across JPY pairs.
- NZD Seasonal Strength: July typically supports bullish momentum for NZD, while August may present challenges. However, strength in NZD versus relative JPY softness suggests continued upside potential into early August.
💼 Institutional Positioning (COT Analysis)
- JPY: Commercial traders remain net short, suggesting expectations of further depreciation.
- NZD: Also shows commercial net shorts, yet the price structure aligns more with bullish continuation, hinting at speculative flow favoring NZD upside.
🧠 Technical Analysis
- Liquidity Dynamics:
- Price has cleared multiple buy-side liquidity levels near prior swing highs.
- Sell-side zones continue to hold, indicating strong bullish intent and failed bearish follow-through.
- Market Structure:
- Higher lows and sustained bullish reactions post-liquidity sweeps reinforce an upward trajectory.
- Current structure suggests accumulation and breakout patterns toward the proposed target.
🎯 Target Projection: 89.690
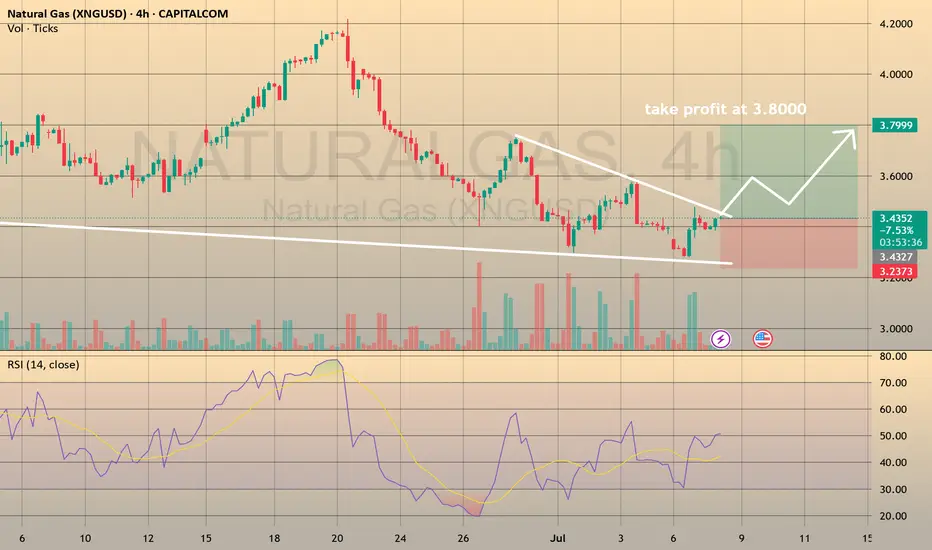
XNGUSD POSSIBLE LONG OPPORTUNITY
Us natural gas has been falling since June 20th and stopped a decline nearby the 3.3900 level with minor false breakouts of it. Currently we observe the reversal bullish wedge pattern, which is supported by a divergency on rsi on 4-h timeframe. Yesterday natural gas trading session opened with a gap downside, however, later, closer to the American session we observed buying volumes and the asset managed to hold above the 3.3900, which makes it interesting to go long.
If the price breaks above the MA50 at 3.4824, would be nice to set a
🔼buy stop order at 3.5144 with a
💰take profit at 3.8000 and a
❌stop loss at 3.2494, below the trendline.
The risk-reward ratio is 1:1.08.
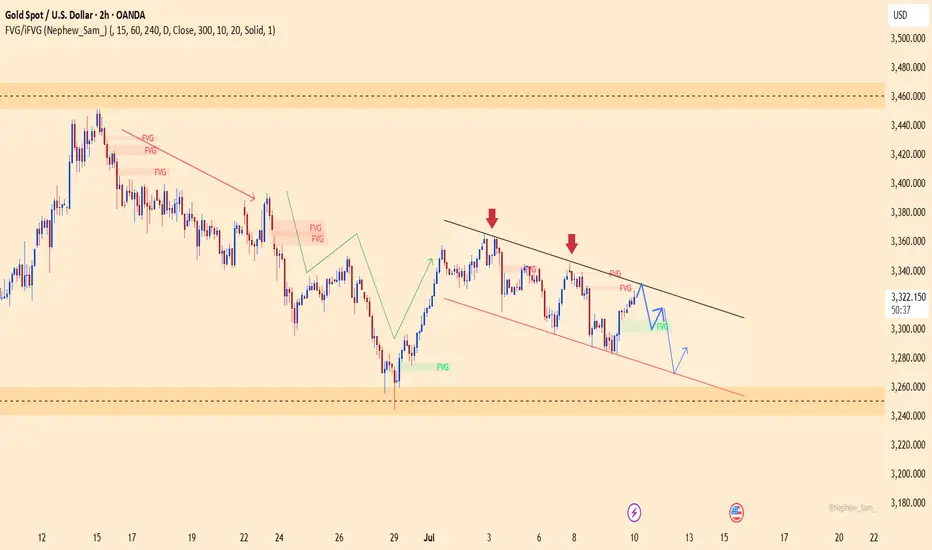
XAUUSD – Bearish Pressure Continues Below the TrendlineGold remains in a downtrend as price consistently gets rejected at the long-term descending trendline. After a short-term rebound toward the $3,341.300 level – near the trendline – XAUUSD is likely to resume its decline toward the support area at $3,254.400. The visible FVG zones indicate that selling pressure is still dominant.
In terms of news, the upcoming U.S. CPI data release on July 11 is the key event that could trigger strong volatility in gold prices. Previously, market sentiment turned cautious after the U.S. government delayed new tariffs on 14 countries, reducing risk-off demand and pulling capital away from gold. If the CPI data comes in hotter than expected, it could further fuel the downside momentum.
Keep an eye on the $3,254.400 level – this is the final support before gold potentially extends its drop to lower price zones.

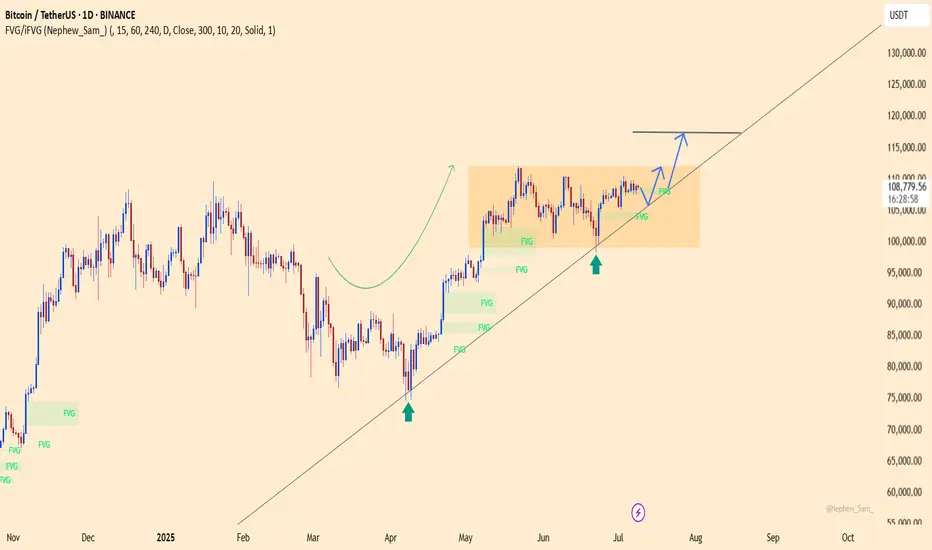
BTCUSDT – Calm Before the BreakoutBitcoin is holding firmly above the ascending trendline, consolidating within the accumulation range of $98,000 to $117,000. The current structure suggests that buyers remain in control, especially after a strong rebound from the $98,450 support zone.
In terms of news, BTC has been slightly affected by market concerns over new U.S. tariffs. However, on-chain data still shows strong accumulation around the $108,000 level. If this base holds, BTCUSDT could break out toward the $117,424 target in the near term. Conversely, if the trendline fails, the $98,000 level will be the final stronghold for the bulls.
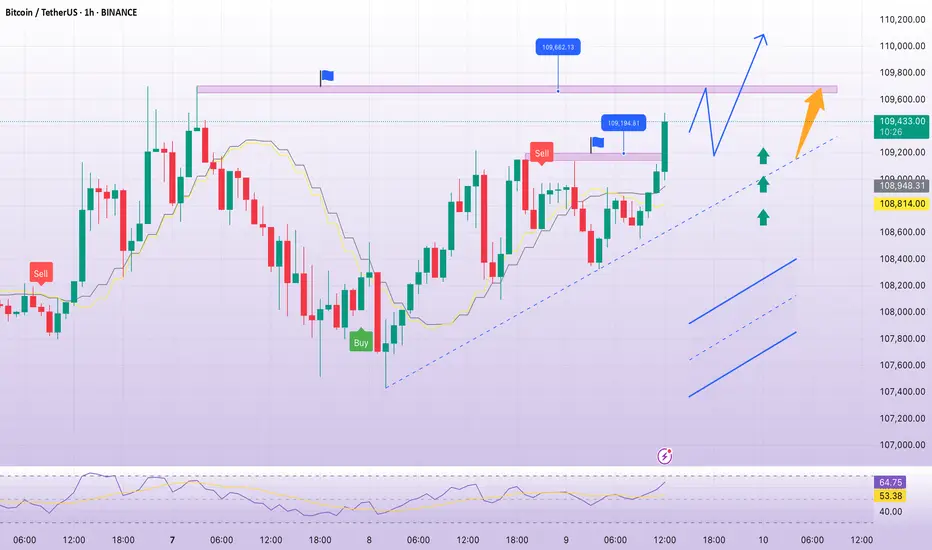
BTC back to 110K, ATH effortPlan BTC today: 09 July 2025
Related Information:!!!
Cryptocurrencies are trading in a volatile environment driven by tariff-related uncertainties ahead of the release of the Federal Reserve's (Fed) Minutes from the June meeting, scheduled for Wednesday. Bitcoin (BTC) continues to exhibit technical weakness, trading below the key resistance level near $109,000. Trading activity in the spot market remains subdued, with K33 Research reporting a 4% decline in weekly volume to $2.1 billion.
Aside from a few selective rallies, as evidenced by Wednesday’s top-performing tokens, most altcoins are underperforming relative to Bitcoin, reflecting limited engagement from the retail segment. Nonetheless, Ethereum (ETH) is showing early signs of a potential upward move after breaking above the former resistance-turned-support level at $2,600. Ripple (XRP), meanwhile, has extended its recovery above $2.33, posting over 1% in intraday gains.
personal opinion:!!!
Continued efforts by the bulls, breaking ATH above the 110,000 price zone. The time is near for the FED to lower interest rates.
Important price zone to consider :!!!
support zone : 109.200
resistance zone : 109.700
Sustainable trading to beat the market
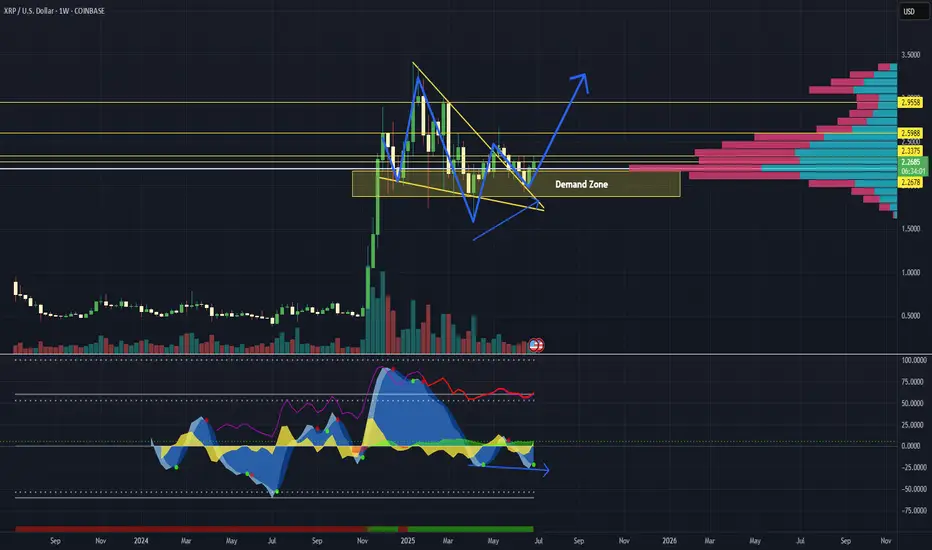
XRP: Ripple Ready to Unleash a Tsunami?Ripple (XRP) is coiling like a spring—ready to explode. After five clean re-tests of a powerful demand zone, buyers have repeatedly stepped in to defend key levels, launching 40–75% swings each time. Is this the moment it unleashes the wave?
🔍 Technical Breakdown:
✅ Demand Zone Strength
XRP is bouncing from a long-tested demand zone (5+ re-tests). Each bounce led to substantial upside momentum.
✅ Bull Flag Retest
XRP previously broke out of a large bull flag and has been holding the flag’s top trendline for over 40 days—acting as strong support.
✅ Higher Low Structure
Price formed a higher low (H/L) and has climbed steadily for two weeks—building bullish structure.
✅ Volume Profile
Price reclaimed ground above the high-volume node, signaling accumulation strength.
✅ Market Cipher B Divergence
A weekly hidden bullish divergence is present—not massive, but notable—hinting at momentum shift.
⚠️ What to Watch:
Volume is key: Current consolidation shows a decline in volume—a surge could ignite the breakout.
Confirmation for conservative traders: Wait for a break and hold above $2.33 with volume, or a retest of that level.
If past demand zone reactions repeat, a breakout could be imminent.
What do you think?
📈 As always—this is not financial advice. Do your own research.
🧭 Happy Hunting!
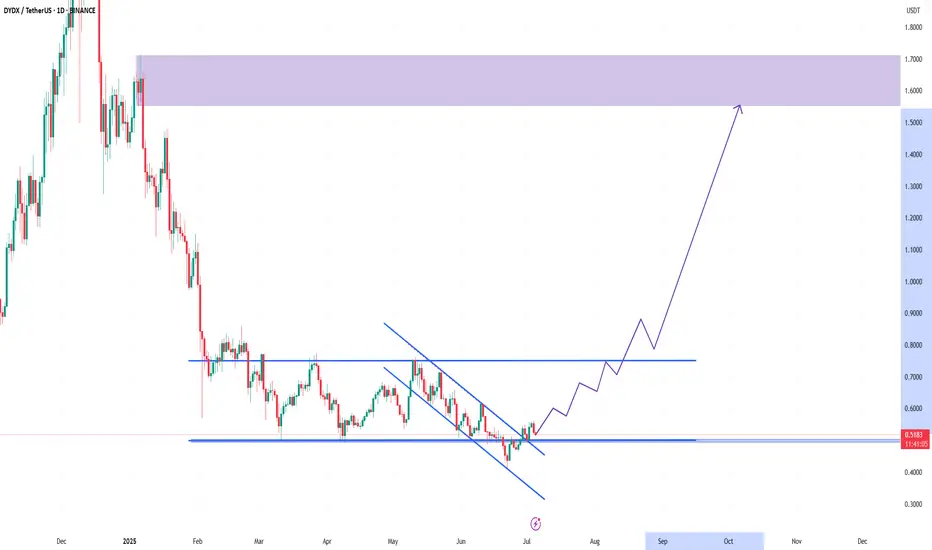
DYDX Breakout from Falling Wedge | Targeting $1.60+# DYDX Breakout from Falling Wedge | Targeting $1.60+
📈 **DYDX/USDT Analysis – Daily Timeframe**
DYDX has just broken out of a falling wedge pattern – a classic bullish reversal formation – after holding a strong support zone around **$0.50**. This zone has acted as a reliable demand area for several months.
---
🔍 **Technical Highlights:**
- ✅ Falling wedge breakout confirmed with daily candle close above resistance
- 🟢 Strong support at $0.50–$0.52
- ⚠️ Horizontal resistance at $0.75 may act as a short-term barrier
- 🚀 Potential rally toward major resistance at **$1.60–$1.70** (target zone)
---
🎯 **Profit Targets:**
- First Target: **$0.75**
- Final Target: **$1.60 – $1.70**
❌ **Invalidation (Stop-loss idea):**
- If price breaks below $0.48 with volume, the bullish scenario may be invalidated.
---
📊 This setup is based on breakout structure and potential trend reversal. If volume confirms, this could be the beginning of a new mid-term uptrend.
💬 Let me know what you think about this setup! Would love to hear your feedback.
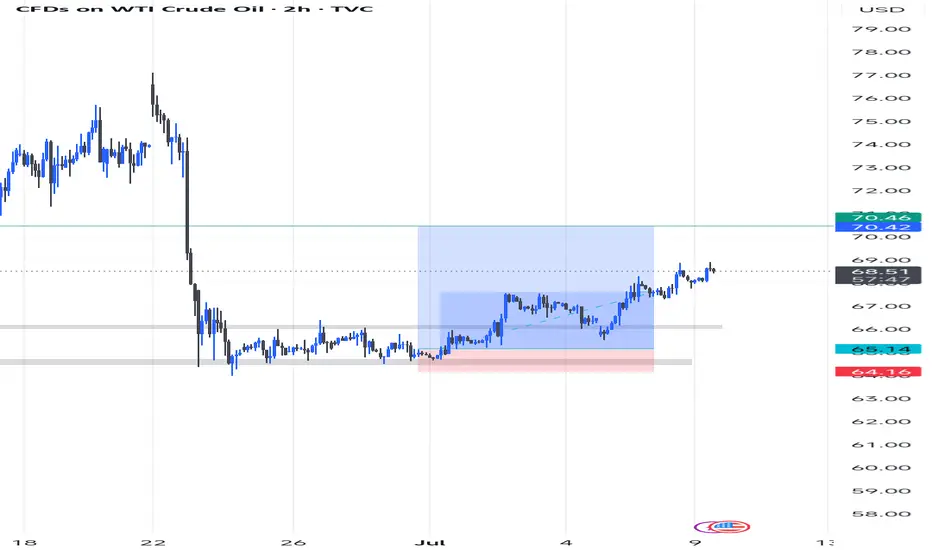
Usoil buy trade am holding since last week📈 USOIL Trade Update – Long Position Holding Strong Since Last Week 🔥
Guess I didn't post this last week...
Caught this buy from the demand zone around $64.16, with a clean structure shift and bullish momentum confirmation.
The market is respecting structure with higher highs and higher lows forming beautifully. As price approaches my target zone, I’m locking in profits and managing risk. Trade has been running smoothly for days 💪🏽
SL at break even now, Holding patiently for that final push to the $70+ area. Let's see how the market reacts at that key zone.
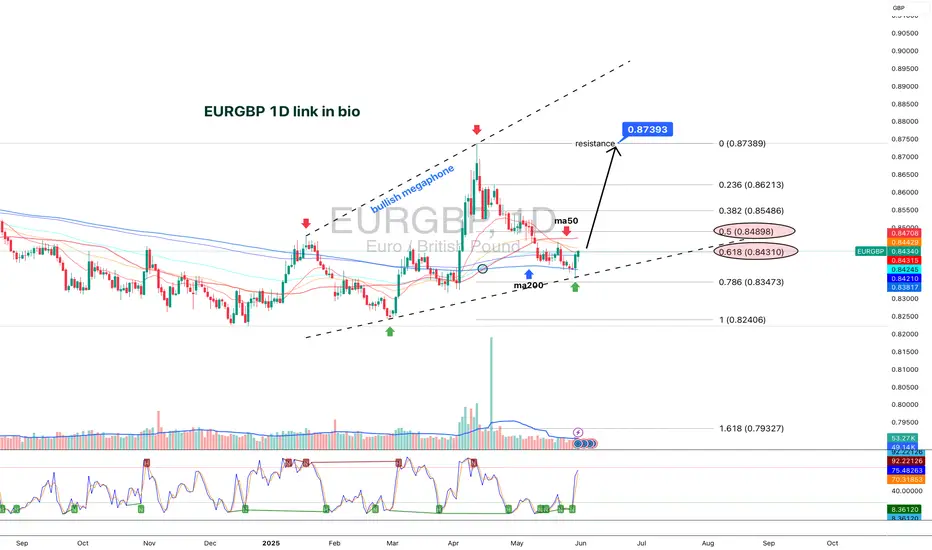
EURGBP 1D: This isn't a breakoutEURGBP 1D: This isn't a breakout — it's a deep reaction before the real move
EURGBP continues to form a textbook bullish megaphone, a structure designed not to trend, but to destabilize — forcing liquidity on both sides while smart money quietly positions. Two touches above (January and April), two below (February and May) — clean geometry, expanding volatility. Price is now reacting from the lower boundary, but we are still inside the pattern — and that matters.
The reaction zone sits right on the 0.786 Fibonacci level, near 0.8350, precisely where price meets the lower trendline and the 200-day moving average. The bounce didn’t come from noise — it came from confluence. Candle structure is clean, volume slightly expands — not panic, but controlled demand. As long as price holds above the MA200, the scenario remains intact. A break below kills the setup — but that hasn’t happened.
We’re not in breakout mode — yet. But price action is shifting. Pullbacks are weak, candles are full-bodied, and sellers don’t press. Momentum indicators confirm early recovery, but the real signal lies in how price holds its ground at key structure without struggle. Buyers aren’t running — they’re holding position.
If the market pushes above 0.8430–0.8480 and confirms — acceleration begins. Until then, we remain in balance. Every candle is a stress test — and so far, the structure is holding strong. If smart money controls 0.8350, the breakout won’t just be bullish — it’ll be aggressive.
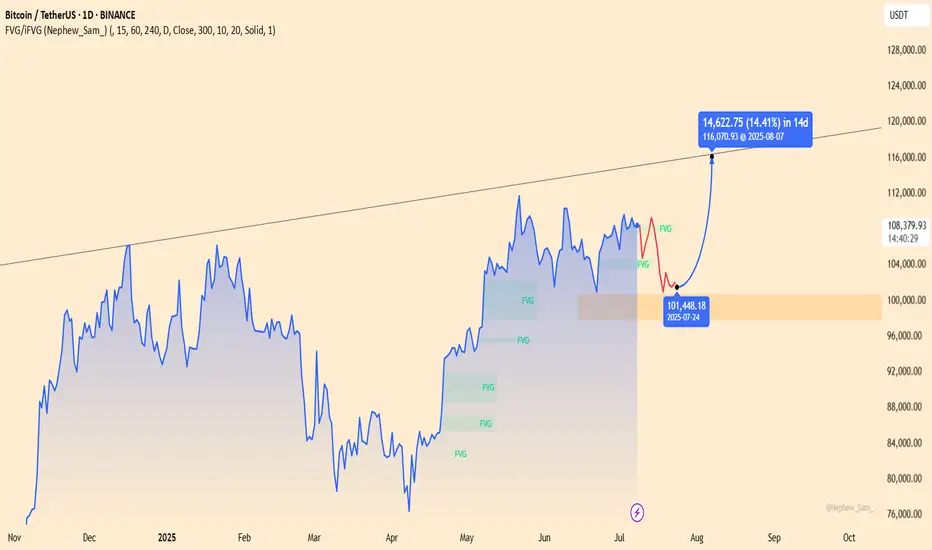
BTCUSDT – Ready to Launch from Accumulation Zone?BTCUSDT is consolidating around the $101,000 FVG zone – a previously strong launchpad. Price structure remains bullish, forming higher lows and showing a healthy throwback pattern.
If the $101,448 level holds, the next target could be $116,000 – a potential 14% rally in two weeks.
Fundamentals support the upside: expectations of Fed rate cuts and renewed ETF inflows are fueling fresh momentum for Bitcoin.
Still, watch for price action confirmation – and always manage your risk!
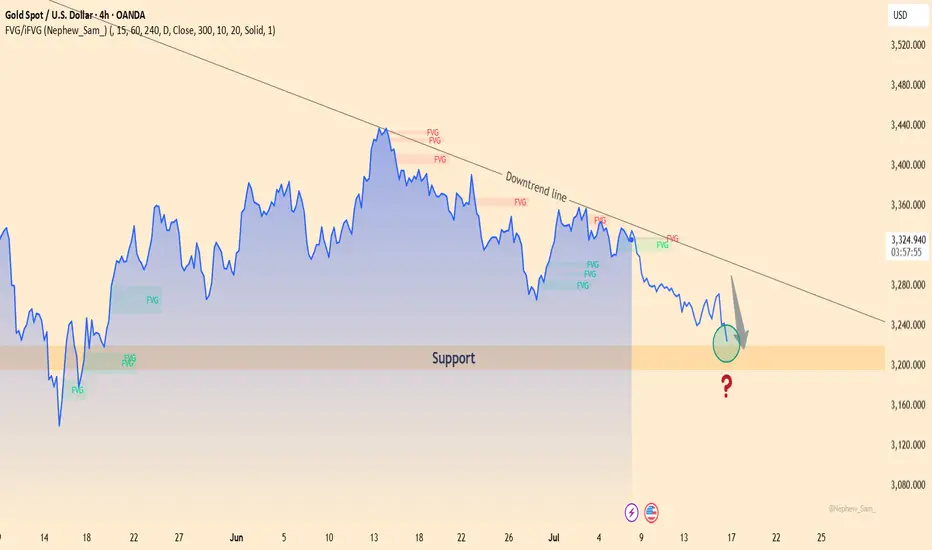
XAUUSD – Drifting Toward the “Eye of the Storm”Gold is currently trading right above the critical support zone at 3,220 – a level that successfully held prices two months ago. The ongoing decline remains well within a clear downtrend line that has persisted since early June. Every breakout attempt has been firmly rejected around the 3,337 level.
The price structure is forming lower highs, while multiple Fair Value Gaps (FVGs) appearing above indicate strong distribution pressure. If XAUUSD breaks below the 3,220 area, a further slide toward 3,160 is likely – a zone loaded with dense liquidity waiting below.
Post-Nonfarm news has eased bearish pressure on the USD, but the upcoming U.S. CPI release could be a game-changer. If inflation data comes in lower than expected, gold may lose the support of rate-cut expectations, paving the way for a deeper fall.
Key Zone to Watch: If 3,220 holds, a short-term technical rebound may occur. But if it breaks, closely monitor price behavior near 3,160.
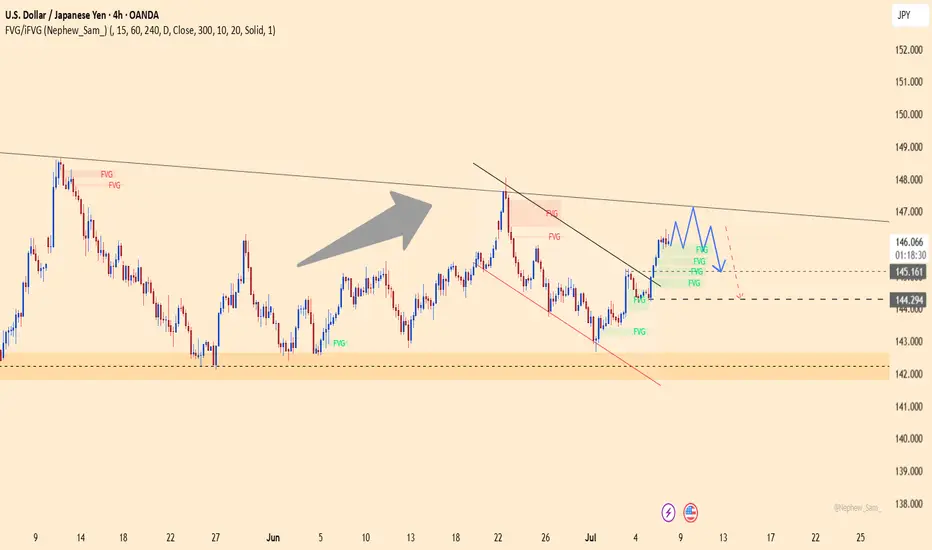
USDJPY – A Bull Trap in the Making?USDJPY has just broken above the descending trendline but stalled right at the confluence resistance near 147.100 – a former strong distribution zone. Although buyers have pushed the price higher, the current price structure is sketching a potential double top pattern, signaling a possible exhaustion of the bullish momentum.
If this pattern confirms and price breaks below the FVG support zone around 145.161, then 144.300 will likely be the next target – a level that previously halted price before the recent rally. Price action should be closely monitored here, as a breakdown below 145.161 could be an early reversal signal.
Disappointing Nonfarm data has pushed bond yields lower and weakened the USD, reinforcing expectations of an earlier Fed rate cut. If this week’s CPI also comes in lower than expected, USDJPY could sharply drop from the current top.
Gold Setup for longs and shorts This video covers gold on the local range whereby I expect price to eventually complete the move to the downside and clear the equal lows from MAy and June as well as take care of the poor lows and fill Quart Pivots .
I talk also about the Tradingview session volume profile chart and how this feature can really be a simple yet powerful guide for taking scalp trades off of specific levels and I show a couple of examples of the respect PA has for hitting those daily POC .
I Welcome any questions you may have

Carvana Leading Auto Retail – Outpacing LAD & AN-Financial Performance & Momentum:
Carvana reported a record-breaking adjusted EBITDA of $488M in Q1 2025, up $253M YoY, with an EBITDA margin of 11.5% (+3.8pp YoY). The company's strong operational efficiency positions it as a leader in the auto retail industry, nearly doubling the margins of competitors like Lithia Motors (LAD) and AutoNation (AN).
- Competitive Positioning & Growth Outlook:
Carvana’s EBITDA quality is superior due to lower non-cash expenses, enhancing long-term sustainability. The company expects sequential EBITDA growth in Q2 and targets 13.5% EBITDA margins within 5-10 years.
-Peer Comparison:
- Lithia Motors (LAD): EBITDA margin at 4.4% (up from 4% YoY), facing tariff-related headwinds that could impact pricing and demand.
- AutoNation (AN): SG&A as a percentage of gross profit rose to 67.5% in Q1, expected to stay between 66-67% in FY 2025, pressuring margins further.
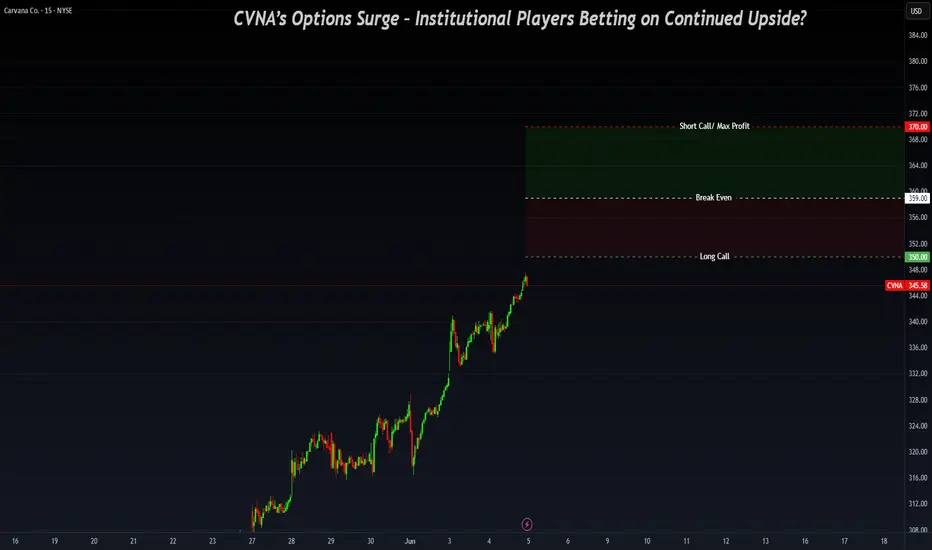
-Options Flow & Institutional Activity - Key Levels: $350/$370
Recent institutional flow activity indicates strong positioning around $350/$370 strikes, potentially signaling a vertical spread in play rather than outright selling:
1️⃣ Momentum Confirmation:
- CVNA has strong upside momentum following its Q1 results, reinforcing a bullish outlook for near-term price action.
- Institutional traders may be accumulating bullish vertical spreads rather than unwinding positions.
Vertical Spread Setup ($350/$370 Strikes)
- Long Call ($350 Strike) → Signals expectations for further upside.
- Short Call ($370 Strike) → Caps max profit while reducing cost.
- Breakeven Price: $359 → CVNA must close above $359 for profitability.
Profit & Risk Zones
- Above $370: Maximum profit achieved.
- Between $359-$370: Partial profit zone (spread remains in play).
- Below $359: Spread loses value, making recovery dependent on extended upside momentum.
maintain bullish, break H1 trend⭐️GOLDEN INFORMATION:
Gold prices (XAU/USD) trade in the red near $3,330 during Tuesday’s Asian session, weighed down by a stronger US Dollar (USD). The precious metal loses ground amid easing trade tensions, following US President Donald Trump’s announcement of a tariff deadline extension and his openness to further negotiations.
Market anxiety subsided after Trump signaled flexibility around the August 1 tariff deadline, describing it as “not 100% firm” and suggesting room for continued adjustments. This renewed optimism over trade policy has strengthened the Greenback, thereby pressuring USD-denominated assets like Gold, which becomes more expensive for holders of other currencies.
⭐️Personal comments NOVA:
Gold price accumulates waiting for news of new tariff information, breaking H1 trend. Good buying power
⭐️SET UP GOLD PRICE:
🔥SELL GOLD zone: 3364- 3366 SL 3371
TP1: $3350
TP2: $3340
TP3: $3330
🔥BUY GOLD zone: $3300-$3298 SL $3293
TP1: $3310
TP2: $3325
TP3: $3340
⭐️Technical analysis:
Based on technical indicators EMA 34, EMA89 and support resistance areas to set up a reasonable BUY order.
⭐️NOTE:
Note: Nova wishes traders to manage their capital well
- take the number of lots that match your capital
- Takeprofit equal to 4-6% of capital account
- Stoplose equal to 2-3% of capital account
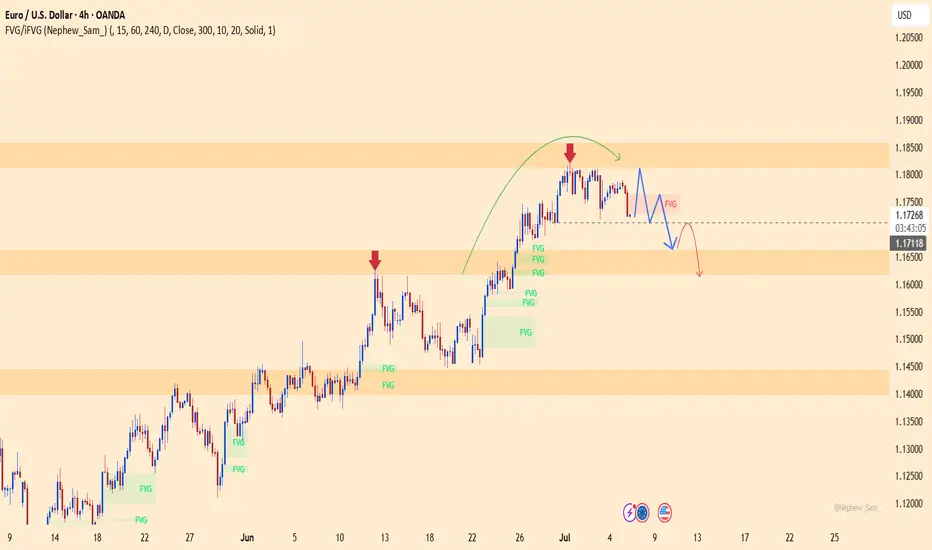
EURUSD – Rounded Top Signals Bearish Reversal The EURUSD pair is showing clear signs of weakness after forming a rounded top pattern near the 1.18100 resistance zone. Price has broken out of a short-term sideways range and may retest the FVG area near 1.17500 before continuing its downward move.
If the support at 1.17118 is breached, EURUSD could head toward the 1.16200 level – a key demand zone on the chart. The bearish momentum is being reinforced by recent news:
Yesterday: U.S. employment data exceeded expectations, strengthening the USD.
Today: The euro is under pressure due to EU recession concerns and political instability in France.
Coming up: The FOMC minutes may continue to reflect a hawkish stance, which could further weigh on EURUSD.