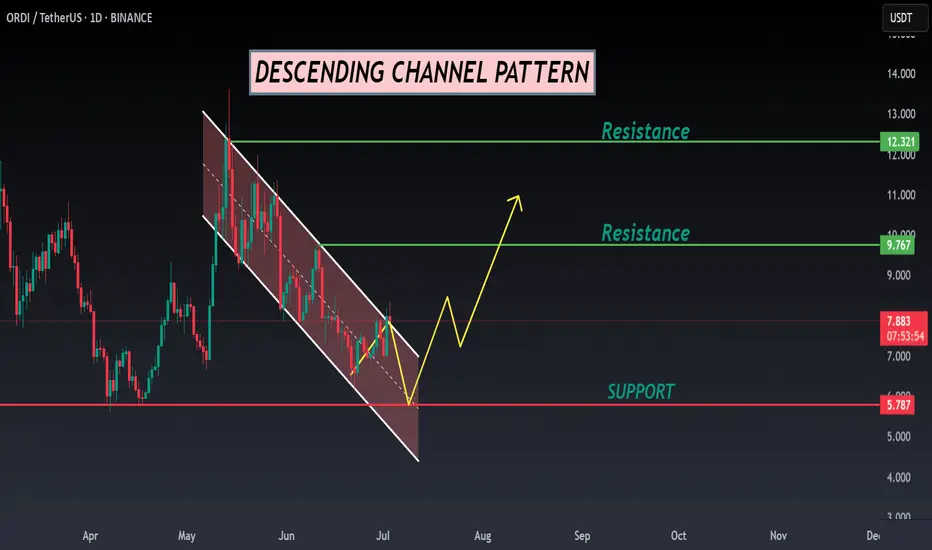
ORDI ANALYSIS📊 #ORDI Analysis
✅There is a formation of Descending Channel Pattern in daily time frame.
After a breakout of the pattern we would see a bullish momentum and can Target for $9.5 in few weeks🧐
👀Current Price: $7.890
🎯 Target Price : $9.500
⚡️What to do ?
👀Keep an eye on #ORDI price action and volume. We can trade according to the chart and make some profits⚡️⚡️
#ORDI #Cryptocurrency #Breakout #TechnicalAnalysis #DYOR
Longsetup
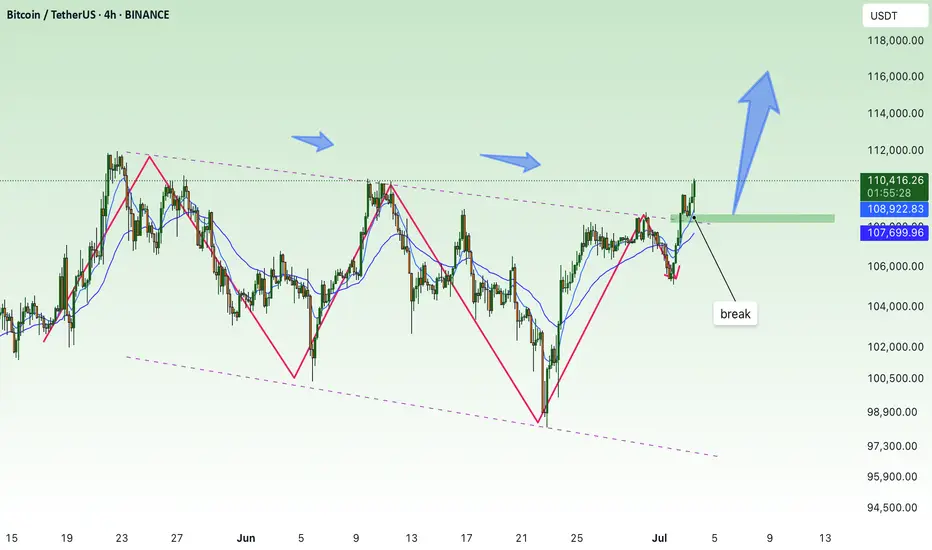
break, BTC soon reaches new ATH💎 Update Plan BTC after NFP (July 3)
Notable news about BTC:
Bitcoin (BTC) recovered to $ 109,000 on Wednesday when the US agreement with Vietnam and the increase in global M2 supply of M2 money has promoted an increase in open interest rates (OI), soaring to 689.78 thousand BTC worth about $ 75 billion. The cryptocurrency market in general has increased the price along with BTC, with leading altcoins, Ethereum (ETH), XRP and Solana (SOL) increased by 7%, 3%and 4%respectively.
Bitcoin, the market cryptocurrency market increased by the trade agreement with Vietnam and M2 money supply soared
The cryptocurrency market has recovered on Wednesday, an increase of 2% to regain the market capitalization of $ 3.5 trillion.
Technical analysis angle
First, congratulate the investors who follow the plan when we previously traded according to the model and had a short signal at 108k and took profit and then Long in the 106k area.
Currently, BTC is in wave 5 and is trapped in the Fibonanci area of 2,618 golden ratio around the price of 109k, this is also the threshold of the price of investors who are under pressure before the price area goes to 112k
The 112k region is a psychological area of profit and will appear on the 109k sales situation before the BTC price may rise further in the last 6 months of the year.
Please follow the channel to receive accurate scenarios about gold and BTC /-Teart /-heart
==> Comments for trend reference. Wishing investors successfully trading
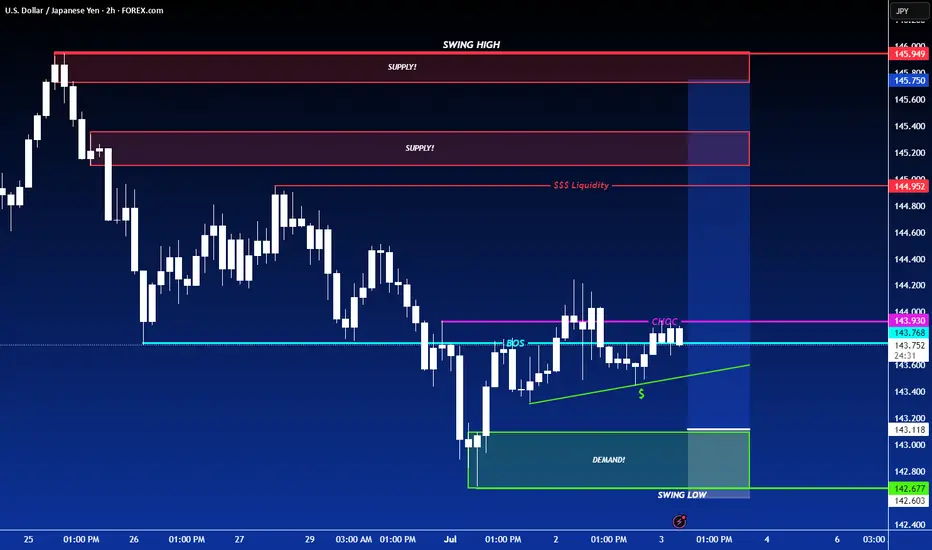
LONG ON USD/JPYUSD/JPY has given us a CHOC (change of character) from down to up.
It has engineered sell side liquidity right above a demand zone.
I expect price to sweep sell side liquidity, tap into the demand zone then take off to the upside.
looking to catch 150-250 pips on UJ. (Economic News could set this trade on Fire!)
Golden Opportunity with EURUSDEURUSD is maintaining a strong bullish structure, with a key support zone around 1.16600. Currently, the price is consolidating just below the 1.18100 resistance and may experience a short-term pullback before continuing higher.
Bullish Supporting Factors:
– The US dollar is weakening amid expectations that the Fed will act cautiously ahead of the upcoming jobs report.
– Eurozone PMI has shown signs of recovery, lending further strength to the euro.
Suggested Strategy:
Wait for buy opportunities around the 1.16600 – 1.17000 area if bullish reversal signals appear. The target remains 1.18100 and potentially higher if upward momentum continues.
Gold growth, recovery 3393⭐️GOLDEN INFORMATION:
Gold prices edge higher during the North American session as investors turn their attention to the upcoming US Nonfarm Payrolls (NFP) report — a key indicator that could influence the Federal Reserve’s next policy move. At the time of writing, XAU/USD is trading at $3,348, up 0.29%.
Recent labor data from ADP revealed that companies are pausing hiring rather than resorting to layoffs, reflecting caution amid uncertain economic conditions. Meanwhile, Microsoft’s decision to cut 9,000 jobs has added to concerns about a softening labor market.
Traders now await Thursday’s official employment report from the Bureau of Labor Statistics, which is projected to show 110,000 new jobs added in June — a slowdown from May’s 139,000. The Unemployment Rate is expected to tick up slightly to 4.3%, still within the Fed’s projected range of 4.4% according to its latest Summary of Economic Projections.
⭐️Personal comments NOVA:
good buy, hold before NF news. Dollar continues to be under selling pressure from investors, worried about the Trump administration's unstable tariff policies.
⭐️SET UP GOLD PRICE:
🔥SELL GOLD zone: 3393- 3395 SL 3400
TP1: $3380
TP2: $3363
TP3: $3350
🔥BUY GOLD zone: $3296-$3294 SL $3289
TP1: $3308
TP2: $3318
TP3: $3330
⭐️Technical analysis:
Based on technical indicators EMA 34, EMA89 and support resistance areas to set up a reasonable BUY order.
⭐️NOTE:
Note: Nova wishes traders to manage their capital well
- take the number of lots that match your capital
- Takeprofit equal to 4-6% of capital account
- Stoplose equal to 2-3% of capital account
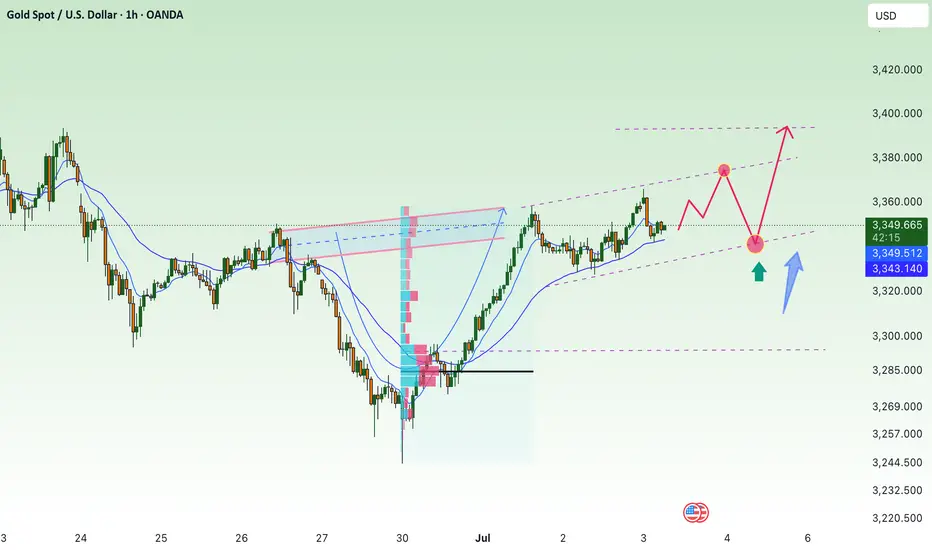
XAUUSD: Gold Surges on U.S. Fiscal Reform ExpectationsGold remains firmly within a short-term bullish structure after rebounding strongly from the $3,258 support zone and forming a consolidation pattern just below the $3,342 resistance. This area marks the confluence of a descending trendline and a fair value gap (FVG), where buyers may gather momentum to break through.
Fundamental news continues to favor the upside: concerns over the U.S. budget deficit and an upcoming tax reform package have boosted safe-haven demand for gold. Meanwhile, U.S. bond yields and the dollar remain low, further driving capital into precious metals.
Yesterday, gold rose by approximately $33.49, equivalent to 3,349 pips, confirming strong bullish inflows. If price breaks above the $3,342–$3,356 zone, the next target could extend beyond the $3,400 mark.
However, if short-term pullbacks occur, the $3,258 area remains a key support level to watch for potential bullish re-entry signals.
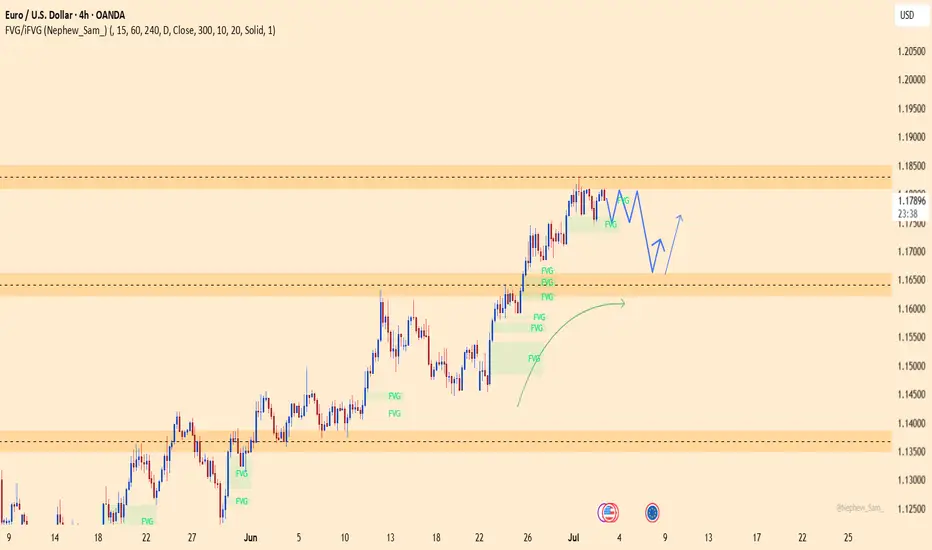
EURUSD: Uptrend Targeting 1.18600EURUSD is maintaining a solid bullish structure after breaking above the 1.17300 zone. The pair is currently consolidating around 1.1800 and may see a minor pullback before pushing toward the 1.18600 target.
The main support comes from a weaker USD following Fed Chair Powell’s “patient” remarks, along with strong PMI data from the EU. EURUSD has now posted 10 consecutive days of gains, signaling strong upward momentum.
As long as price holds above the FVG zone near 1.1780, the bullish trend remains intact, with 1.18600 as the next potential upside target.
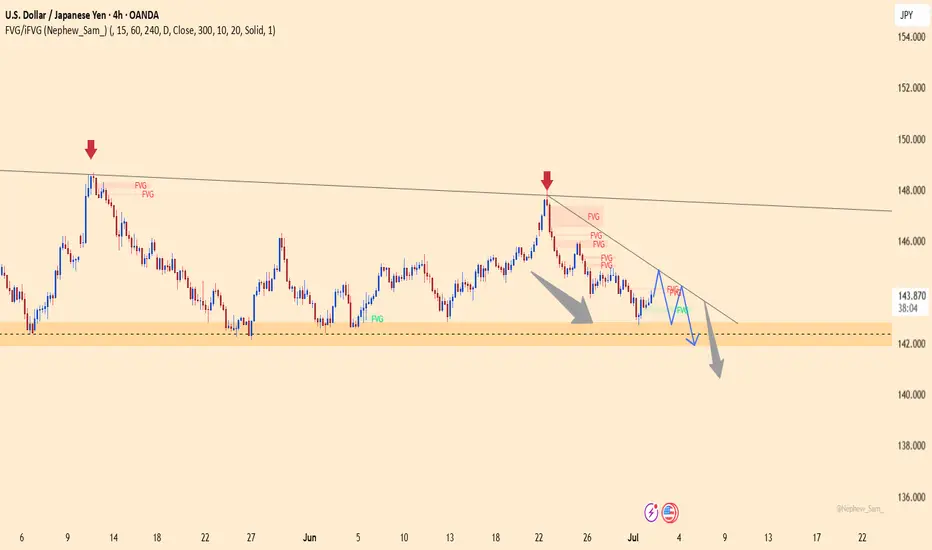
USDJPY: Bearish Trend Remains in ControlUSDJPY continues to follow a clear downtrend on the H4 chart, respecting a descending trendline and forming consistent lower highs. The strong rejection at 144.800 and the presence of multiple FVGs further reinforce the bearish structure.
Price is currently retracing to test the FVG zone. If rejection occurs here, the downtrend could resume towards the 141.900 support level.
Trade Setup:
Sell near 144.700
TP: 141.900
SL: above 145.300
Supporting News:
"Risk-on" sentiment is back after strong manufacturing data from China and rising expectations that U.S. interest rates may soon peak, weakening the USD against the JPY.
Are you watching for a short setup like I am?
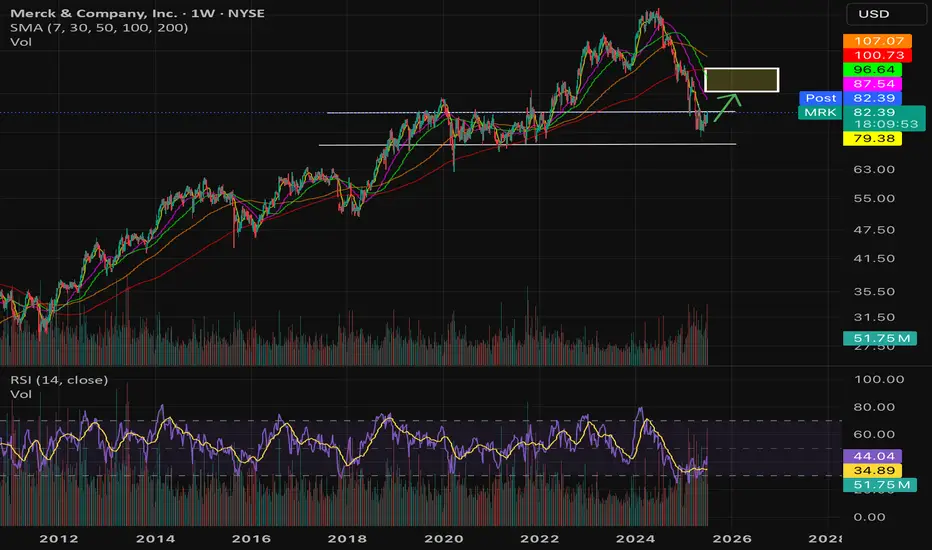
Long $MRK- NYSE:MRK is a quality compounder selling at a discount.
Year | 2025 | 2026 | 2027 | 2028
EPS | 8.90 | 9.72 | 10.65 | 10.38
EPS% | 18.36% | 9.21% | 9.54% | -2.52%
Conservative forward p/e should be 10
Fair Stock value:
EPS | 8.90 | 9.72 | 10.65 | 10.38
Price | 89 | 97 | 106 | 103
Positive Suprises or rotation into healthcare by fund manager would leead to forward p/e of 15
EPS | 8.90 | 9.72 | 10.65 | 10.38
Stock price | 133 | 145 | 159 | 155
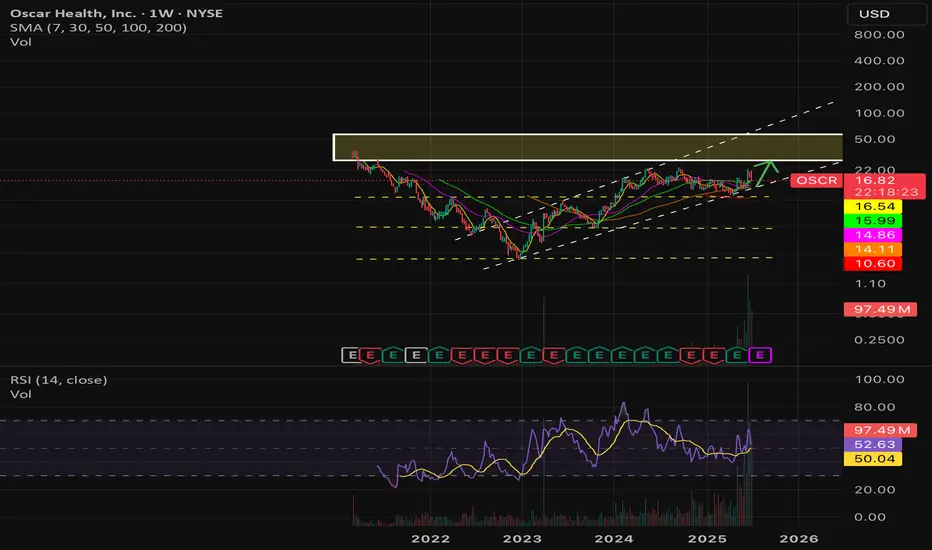
$OSCR long PT: $30-60 range- Undervalued Healthtech company growing revenue double digits.
- PEG < 1
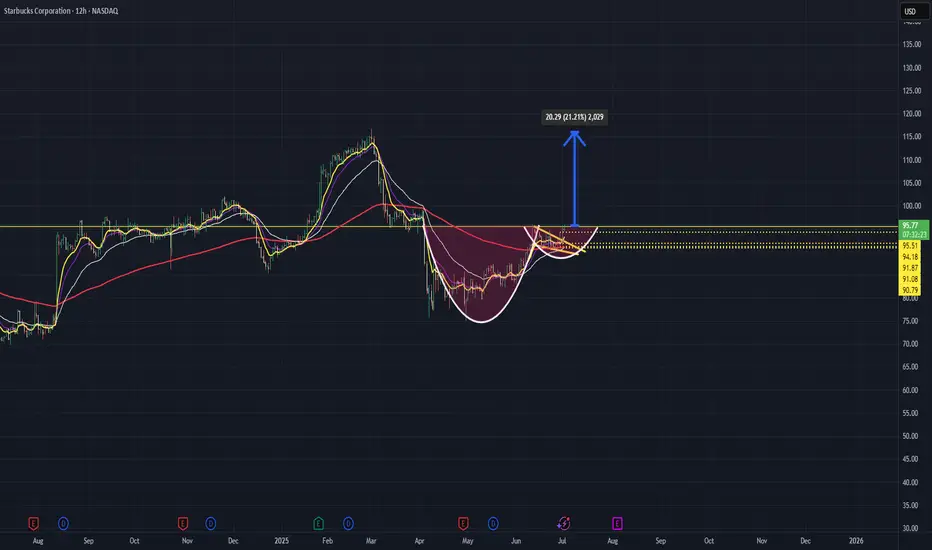
Cup and Handle with a shot of espresso: A bullish blendSince March, Starbucks ( NASDAQ:SBUX ) has been in a sustained downtrend, gradually rounding out a base. Now, the chart is showing early signs of a trend reversal.
Yesterday, price broke out of a bull flag formation on the daily chart and is now testing the $95.50 zone — a critical neckline level of a cup and handle pattern.
✅ Bullish Scenario:
A clean break and hold above $95.50 would confirm the cup-and-handle breakout.
If confirmed, this setup could target a measured move that eventually retests all-time highs.
More conservative traders may want to wait for a back test of the $95.50 neckline as confirmation, especially given its past historical significance.
⚠️ Bearish Invalidation:
A break and hold below $95.50 would invalidate the cup-and-handle pattern, suggesting the breakout has failed.
📌 This is a purely technical idea. No fundamentals involved.
As always, Happy Hunting!
This is not financial advice. Always do your own due diligence
Waiting for gold price to grow with ADP-NF⭐️GOLDEN INFORMATION:
Gold (XAU/USD) finds it difficult to extend its two-day rally and trades within a tight range during Wednesday’s Asian session, hovering just below Tuesday’s one-week high. A modest rebound in the US Dollar—recovering from its lowest level since February 2022—has put pressure on the precious metal. Additionally, improving market sentiment continues to reduce demand for safe-haven assets like Gold, further limiting its upside.
⭐️Personal comments NOVA:
Steady trendline recovery, sustained buying could move towards 3383 with today's ADP-NF data
⭐️SET UP GOLD PRICE:
🔥SELL GOLD zone: 3382- 3384 SL 3389
TP1: $3370
TP2: $3360
TP3: $3350
🔥BUY GOLD zone: $3312-$3310 SL $3305
TP1: $3320
TP2: $3330
TP3: $3340
⭐️Technical analysis:
Based on technical indicators EMA 34, EMA89 and support resistance areas to set up a reasonable BUY order.
⭐️NOTE:
Note: Nova wishes traders to manage their capital well
- take the number of lots that match your capital
- Takeprofit equal to 4-6% of capital account
- Stoplose equal to 2-3% of capital account
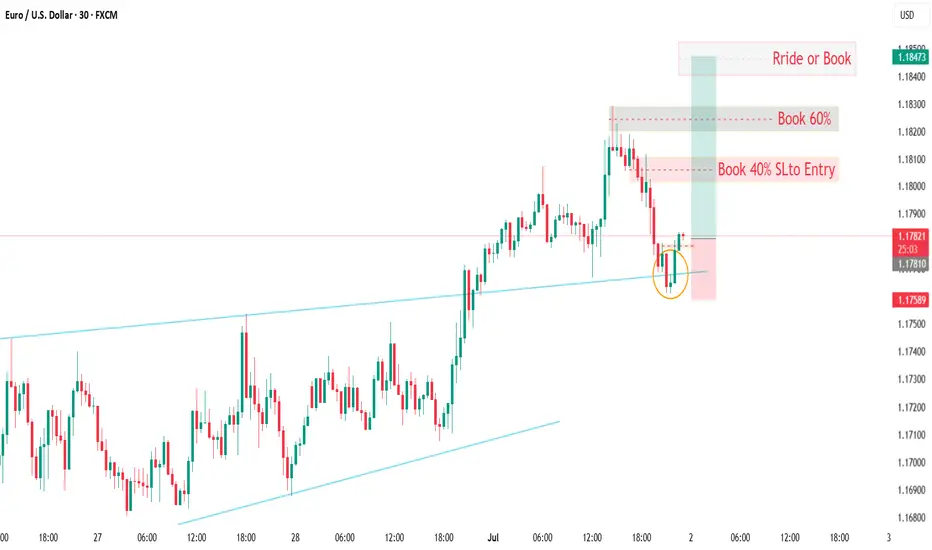
EURUSDEURUSD
30m Time Frame Bullish setup, Candle Stick Pattern
Move SL To Entry once reach first target.
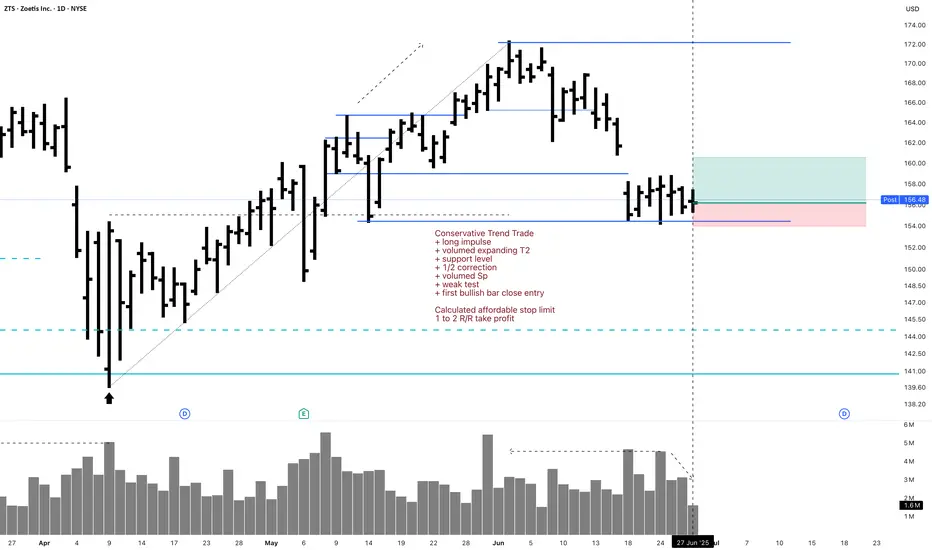
ZTS 1D Investment Conservative Trend TradeConservative Trend Trade
+ long impulse
+ volumed expanding T2
+ support level
+ 1/2 correction
+ volumed Sp
+ weak test
+ first bullish bar close entry
Calculated affordable stop limit
1 to 2 R/R take profit
Monthly Trend
"+ long impulse
+ T2 level
+ support level"
Yearly Trend
"+ long impulse
- correction"
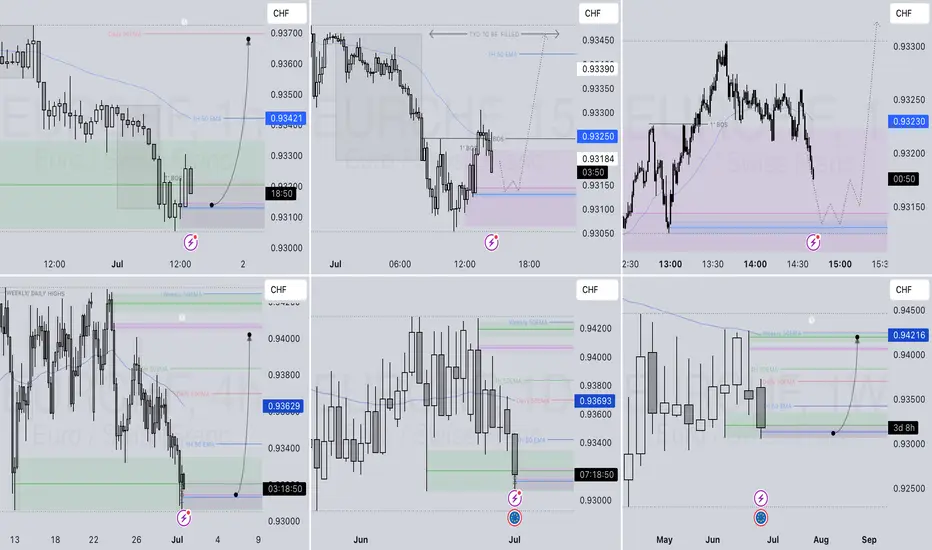
EURCHF LONG DAILY FORECAST Q3 D1 W27 Y25EURCHF LONG DAILY FORECAST Q3 D1 W27 Y25
Professional Risk Managers👋
Welcome back to another FRGNT chart update📈
Diving into some Forex setups using predominantly higher time frame order blocks alongside confirmation breaks of structure.
Let’s see what price action is telling us today! 👀
💡Here are some trade confluences📝
✅Daily Order block identified
✅4H Order Block identified
✅1H Order Block identified
🔑 Remember, to participate in trading comes always with a degree of risk, therefore as professional risk managers it remains vital that we stick to our risk management plan as well as our trading strategies.
📈The rest, we leave to the balance of probabilities.
💡Fail to plan. Plan to fail.
🏆It has always been that simple.
❤️Good luck with your trading journey, I shall see you at the very top.
🎯Trade consistent, FRGNT X
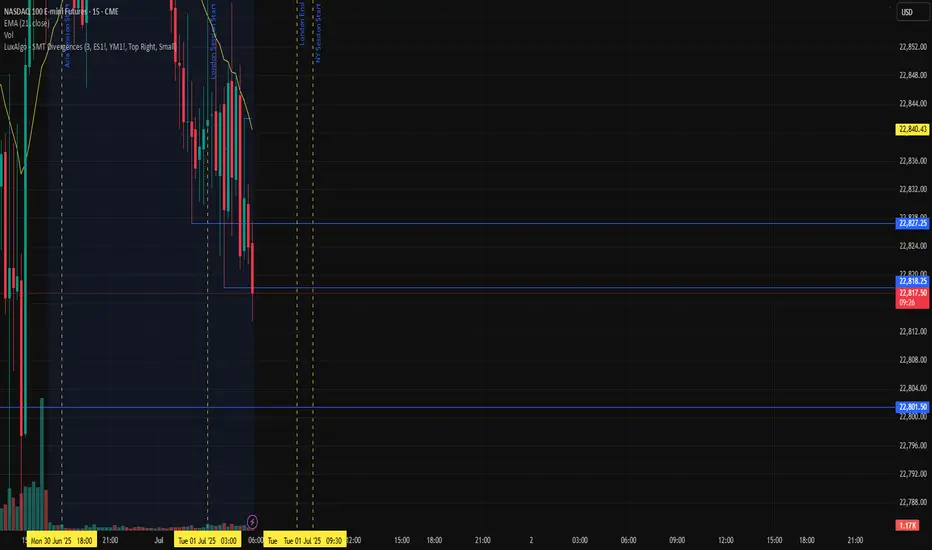
NQ NY Session longBy the looks of the London Session for NQ, it seems to be a Manipulation to prepare a reversal Long in the NY Session
Gold price recovers above 3300⭐️GOLDEN INFORMATION:
Gold (XAU/USD) trades at $3,292 after rebounding from an intraday low of $3,246 and looks set to close out June with a modest gain of over 0.18%. However, its upward momentum has been restrained by easing geopolitical tensions in the Middle East and growing optimism over forthcoming trade agreements. Meanwhile, analysts at Citi expect Gold to consolidate within the $3,100 to $3,500 range throughout the third quarter.
In Washington, US Treasury Secretary Scott Bessent expressed confidence that the “One Big Beautiful Bill” will make progress in the coming hours. The sweeping tax reform legislation, which narrowly passed the Senate over the weekend, includes major tax deductions funded by reductions in Medicaid spending and green energy incentives.
⭐️Personal comments NOVA:
Gold price recovers above 3300 , ahead of NF reports this week . Accumulates above 3300
⭐️SET UP GOLD PRICE:
🔥SELL GOLD zone: 3353- 3355 SL 3360
TP1: $3340
TP2: $3330
TP3: $3320
🔥BUY GOLD zone: $3272-$3270 SL $3265
TP1: $3283
TP2: $3295
TP3: $3310
⭐️Technical analysis:
Based on technical indicators EMA 34, EMA89 and support resistance areas to set up a reasonable BUY order.
⭐️NOTE:
Note: Nova wishes traders to manage their capital well
- take the number of lots that match your capital
- Takeprofit equal to 4-6% of capital account
- Stoplose equal to 2-3% of capital account
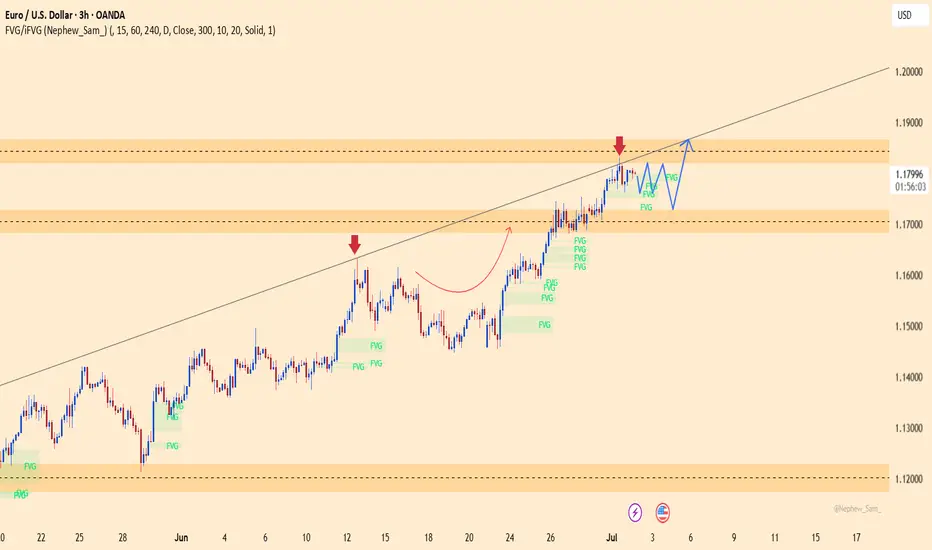
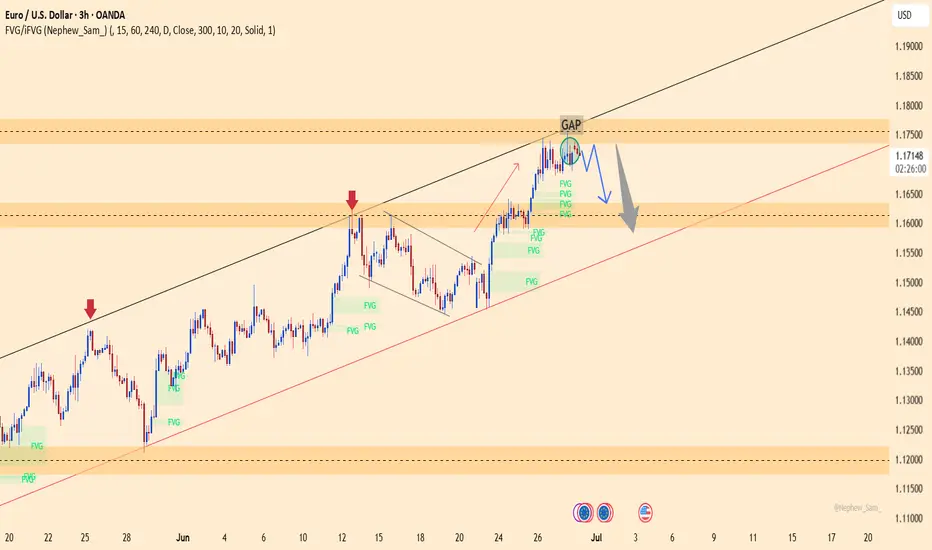
EURUSD – Bearish Pressure IntensifiesEURUSD is currently facing rejection at the GAP resistance area near 1.17350, combined with a lower high structure forming within the ascending channel. Price action shows clear signs of weakness after filling the GAP, and the aligned FVG zones below suggest a potential for deeper downside.
If the price remains capped below 1.17350, there is a high probability of a pullback toward the 1.16300 support area — which aligns with the long-term ascending trendline. A break below this level could extend the bearish move toward the deeper region near 1.14500.
Supporting Fundamentals:
Strong US Core PCE → reinforces expectations that the Fed will keep rates higher for longer.
Weak EU manufacturing PMI → puts pressure on the euro.
FOMC minutes and NFP — if hawkish — could strengthen the USD and weigh further on EURUSD.
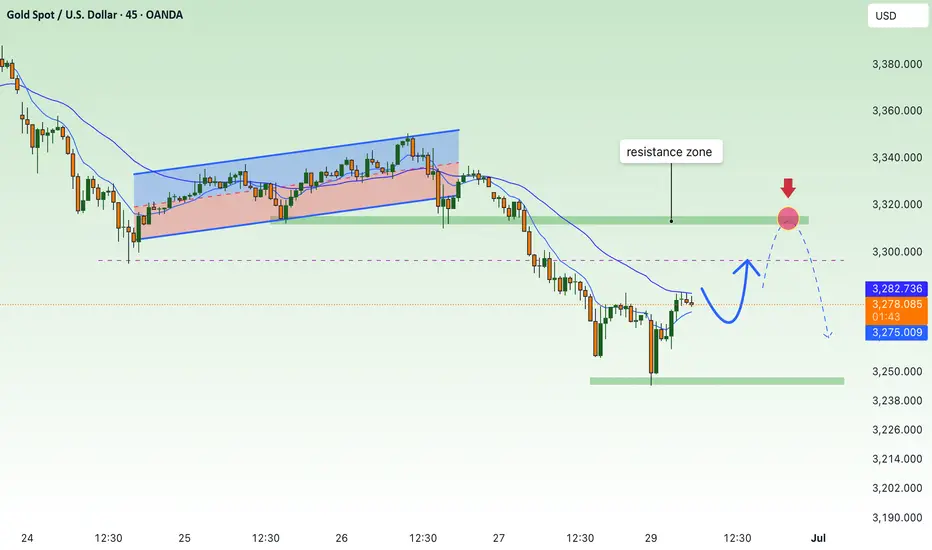
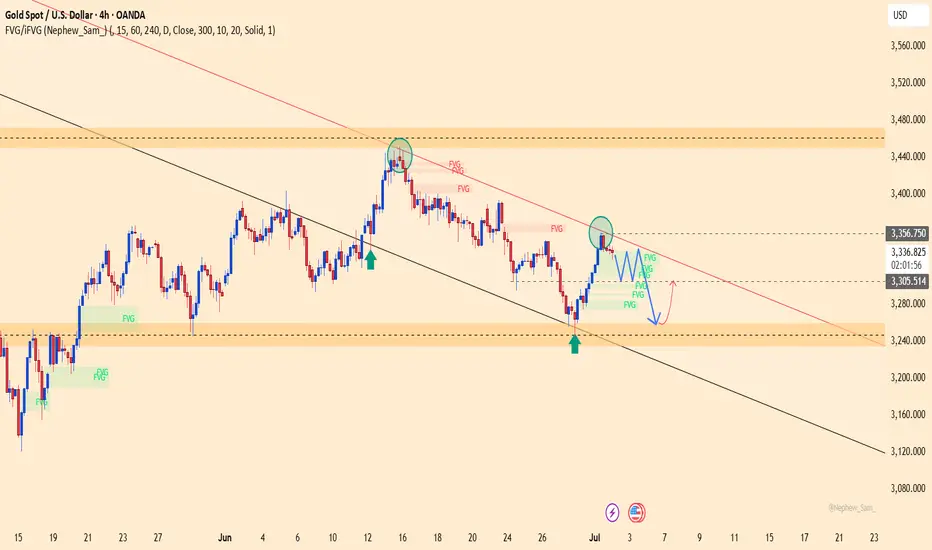
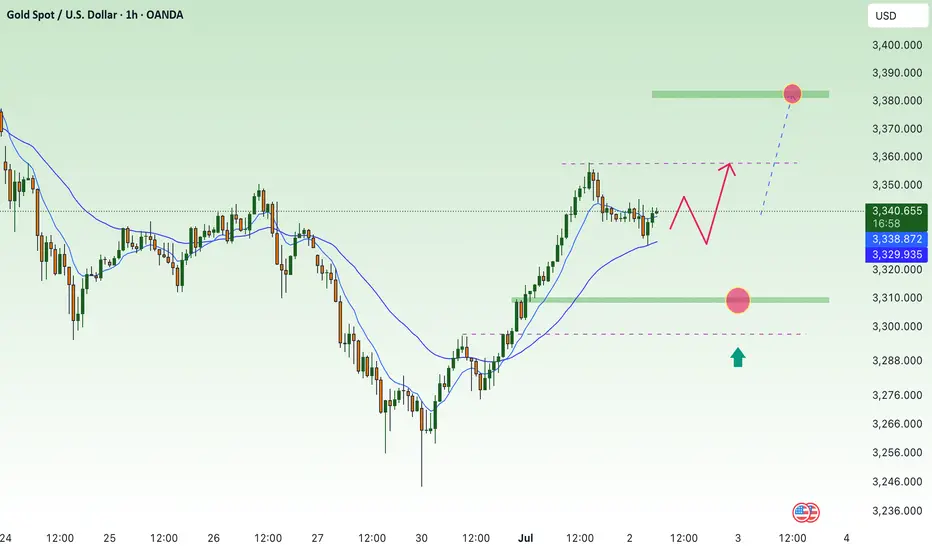
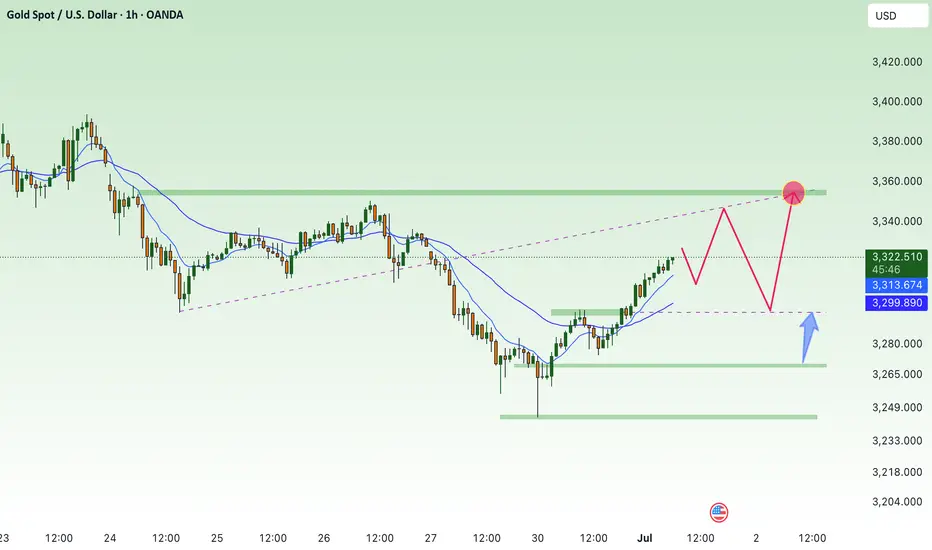
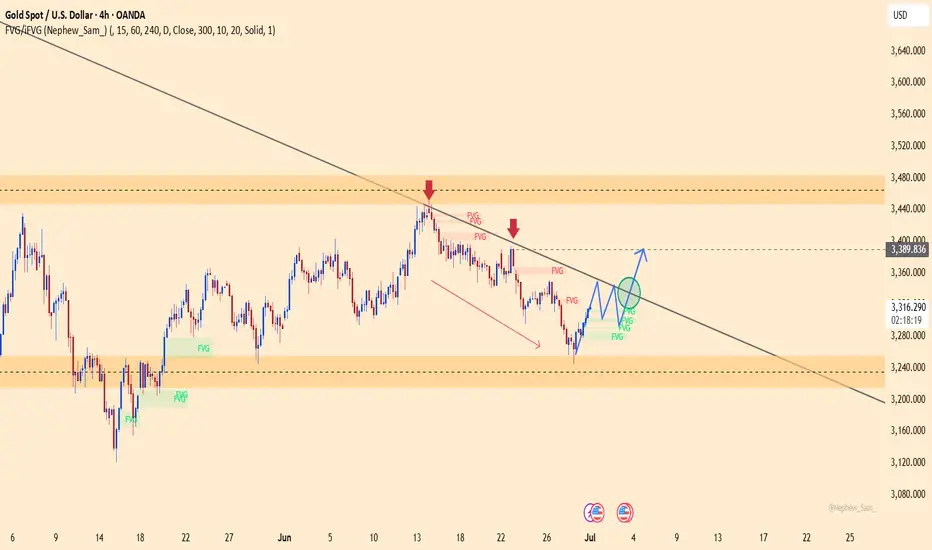
XAUUSD – Technical pullback before a breakout?On the 4H chart, gold is consolidating just below the descending trendline after a correction from $3,389 to the support zone at $3,252. The current price structure suggests continued range-bound movement between $3,252 and $3,318 before a potential breakout. If price breaks above the trendline, the next target could be the resistance zone at $3,389.
From a news perspective, the easing of Iran–Israel tensions has slightly reduced safe-haven demand, putting short-term pressure on gold. However, the US dollar remains at a 3-year low, and concerns over the US government’s $3.3–3.9 trillion tax reform package are fueling fears of a widening deficit—both of which support a bullish outlook for gold.
In summary, watch how price reacts to the trendline. A confirmed breakout could send gold surging toward the $3,389 zone.
USDCAD long trade setup for this week📈 USDCAD Long Setup Idea – Weekly Play 💯
Here’s a clean bullish setup on USDCAD (2H timeframe) I’m eyeing for this week:
🔹 Key Zones:
- Demand Zone: Strong reaction from the 1.35500–1.36000 area, with price respecting this grey support block multiple times.
- Supply Flip: Previous structure zone turned potential demand.
🔹 Entry:
- Long position placed after liquidity grab and bullish rejection within the demand zone.
- Market structure is beginning to shift bullish after consecutive lower highs and lows broke.
🔹 Risk Management:
- SL below the demand zone at ~1.35512
- TP set near previous high around 1.37960 (resistance zone)
🔹 RRR (Risk to Reward Ratio):
- Solid risk/reward potential on this play – targeting a 3R move if momentum holds.
🔹 Trade Bias:
- Looking for a deeper retracement continuation up, aligning with possible DXY pullback.
- Watching for confirmations like bullish engulfing or structure break for entry trigger.
📊 Stay patient, follow price action, and manage risk properly.

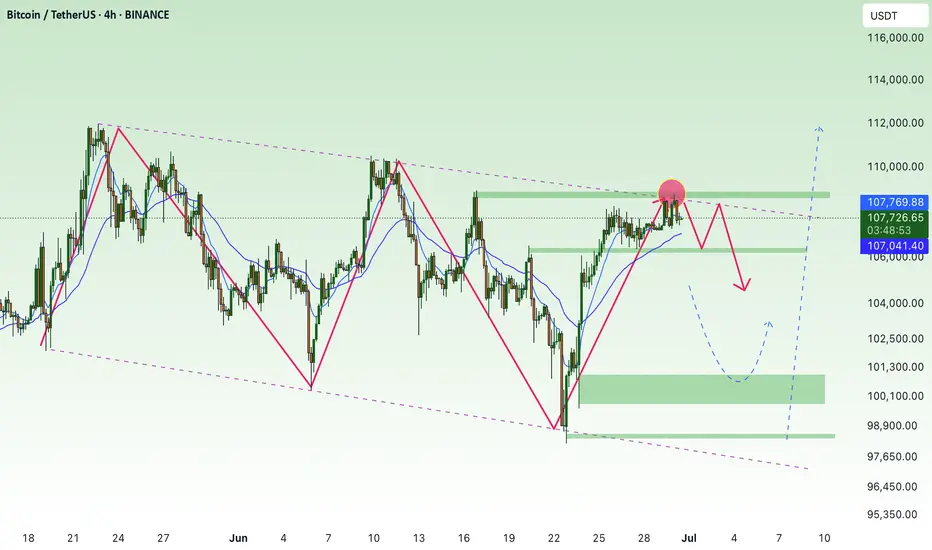
BTC buying power is gradually increasing💎 Update Plan BTC at the beginning of the week (June 30)
Notable news about BTC:
Anthony Pompliano has merged Procap BTC with Columbus Circle Capital I, established Procap Financial - a Bitcoin warehouse company up to $ 1 billion. The company will deploy lending activities, derivatives ... in order to create a collection line from BTC, according to the similar model
Bitcoin price is stable at about $ 107.4K on June 27, before the expiry date of options worth up to US $ 40 billion, capable of causing strong fluctuations. At the same time, on June 29, BTC exceeded $ 108k, up ~ 0.68% compared to the previous day
In the past 7 days, BTC maintained around $ 104–107K despite tensions in the Middle East and the US economic data is not heterogeneous. Reduce slightly but receive support from organized cash flow and global trade progress.
Technical analysis angle
Overview of trends - many signs of increasing
Looking at the candle is signaling "Strong Buy" on many time frames, especially healthy momentum, the ability to breakout $ 116k if surpassed the $ 110k resistance
ETF liquidity and organizational capital flows are supporting the trend of increasing, strengthening the possibility of breakthrough.
Moving Averages:
Frame 1H: 64% Bullish signal (MA20 reversed), but there is a neutral signal from short -term ghosts
Daily/Weekly: Golden Cross (Golden Cross) between 50‑ and 200‑ MA, is a long -term trend increase signal
Oscillators:
RSI frame Daily ~ 55, showing neutral momentum, not too much purchased but there is a rise. Double Rounded Top model on the chart Daily, the current trend is neutral - Bearish if the breakdown supports Neckline ~ $ 106k; In contrast, strong recovery above $ 114k will invalid this model
Long -term / Swing Trade: Keep the position if the price is maintained> $ 106k, use $ 103–104K as a spare hole stop.
Short -term / Scalp Trade: can be in order when the test price is $ 106k–107k, small latches around $ 110k.
==> Comments for trend reference. Wishing investors successfully trading
Bulls recover in new week, gold price returns to 3300⭐️GOLDEN INFORMATION:
Gold prices (XAU/USD) regained some lost ground during Monday’s Asian session, buoyed by growing expectations that the US Federal Reserve may implement more interest rate cuts this year—and potentially sooner than previously anticipated. Such prospects weigh on the US Dollar, making the dollar-denominated metal more attractive to overseas buyers.
However, the recent improvement in global risk sentiment—driven by the US-China trade accord and a ceasefire agreement between Israel and Iran—could reduce demand for Gold’s safe-haven appeal. Investors now turn their attention to upcoming comments from Federal Reserve officials, with speeches from Atlanta Fed President Raphael Bostic and Chicago Fed President Austan Goolsbee expected later in the day.
⭐️Personal comments NOVA:
Gold price recovered, accumulating at the beginning of the new week around the price range of 3300. Still in the main downtrend.
⭐️SET UP GOLD PRICE:
🔥SELL GOLD zone: 3316- 3318 SL 3323
TP1: $3305
TP2: $3290
TP3: $3277
🔥BUY GOLD zone: $3248-$3246 SL $3241
TP1: $3258
TP2: $3270
TP3: $3286
⭐️Technical analysis:
Based on technical indicators EMA 34, EMA89 and support resistance areas to set up a reasonable BUY order.
⭐️NOTE:
Note: Nova wishes traders to manage their capital well
- take the number of lots that match your capital
- Takeprofit equal to 4-6% of capital account
- Stoplose equal to 2-3% of capital account