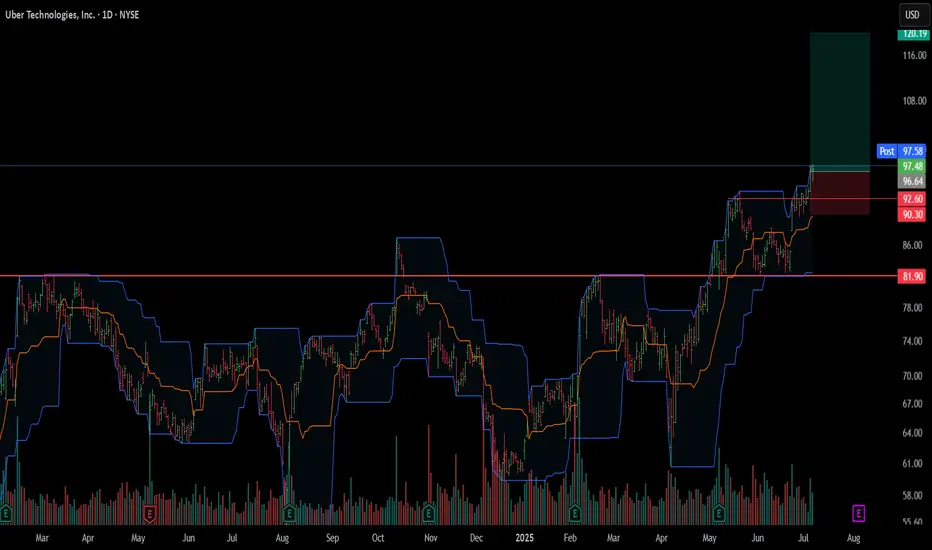
UBER longBroken long term resistance, retested, and once again pushed 20 day Donchian Channel.
Turtles are coming out of their shells taking UBER to the new ATHs.
Long term hold.
Longterm
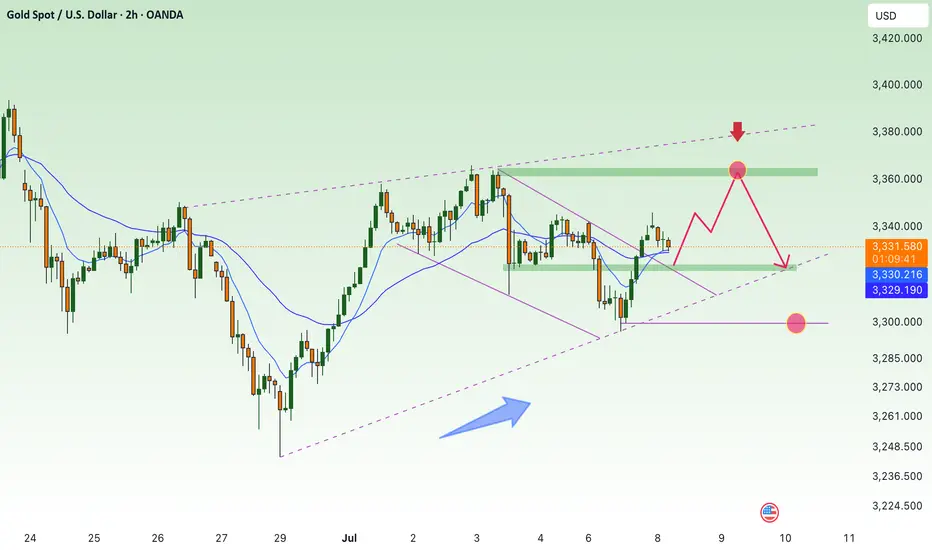
maintain bullish, break H1 trend⭐️GOLDEN INFORMATION:
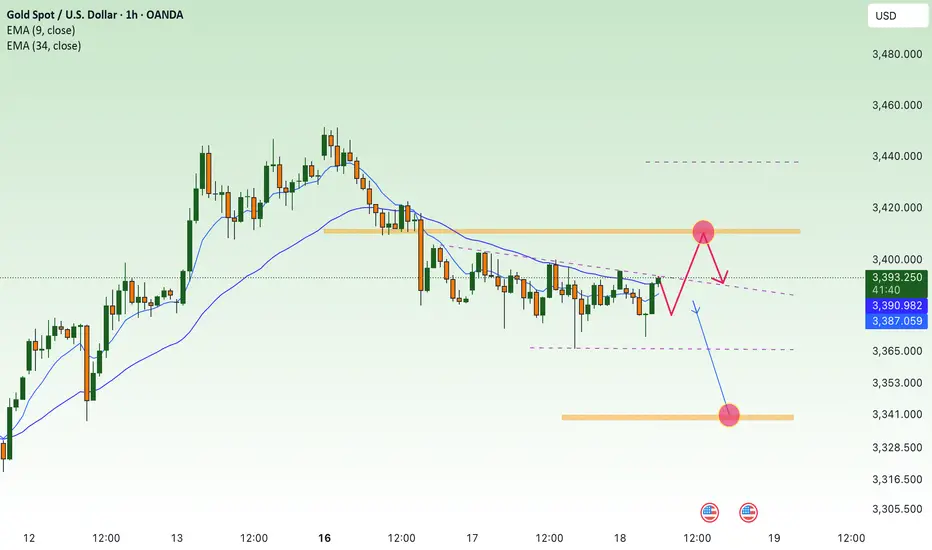
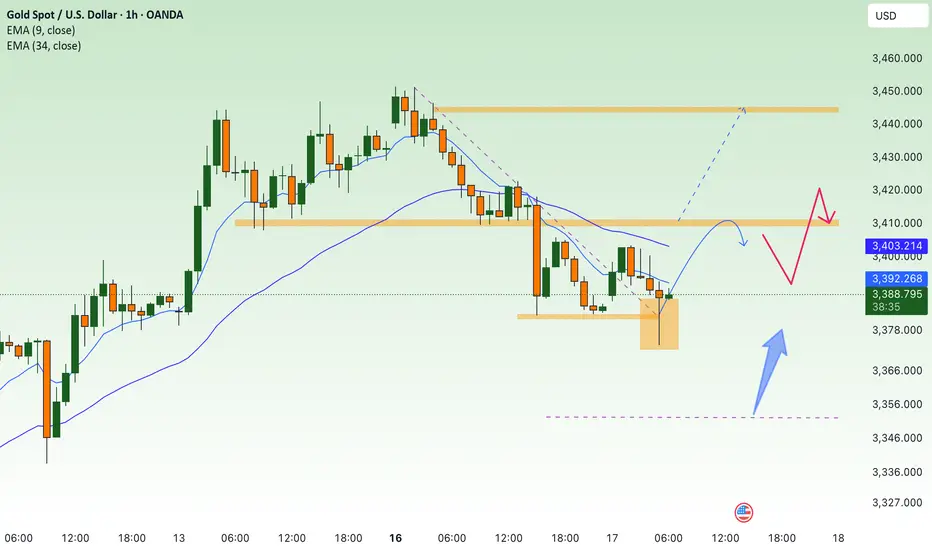
Gold prices (XAU/USD) trade in the red near $3,330 during Tuesday’s Asian session, weighed down by a stronger US Dollar (USD). The precious metal loses ground amid easing trade tensions, following US President Donald Trump’s announcement of a tariff deadline extension and his openness to further negotiations.
Market anxiety subsided after Trump signaled flexibility around the August 1 tariff deadline, describing it as “not 100% firm” and suggesting room for continued adjustments. This renewed optimism over trade policy has strengthened the Greenback, thereby pressuring USD-denominated assets like Gold, which becomes more expensive for holders of other currencies.
⭐️Personal comments NOVA:
Gold price accumulates waiting for news of new tariff information, breaking H1 trend. Good buying power
⭐️SET UP GOLD PRICE:
🔥SELL GOLD zone: 3364- 3366 SL 3371
TP1: $3350
TP2: $3340
TP3: $3330
🔥BUY GOLD zone: $3300-$3298 SL $3293
TP1: $3310
TP2: $3325
TP3: $3340
⭐️Technical analysis:
Based on technical indicators EMA 34, EMA89 and support resistance areas to set up a reasonable BUY order.
⭐️NOTE:
Note: Nova wishes traders to manage their capital well
- take the number of lots that match your capital
- Takeprofit equal to 4-6% of capital account
- Stoplose equal to 2-3% of capital account
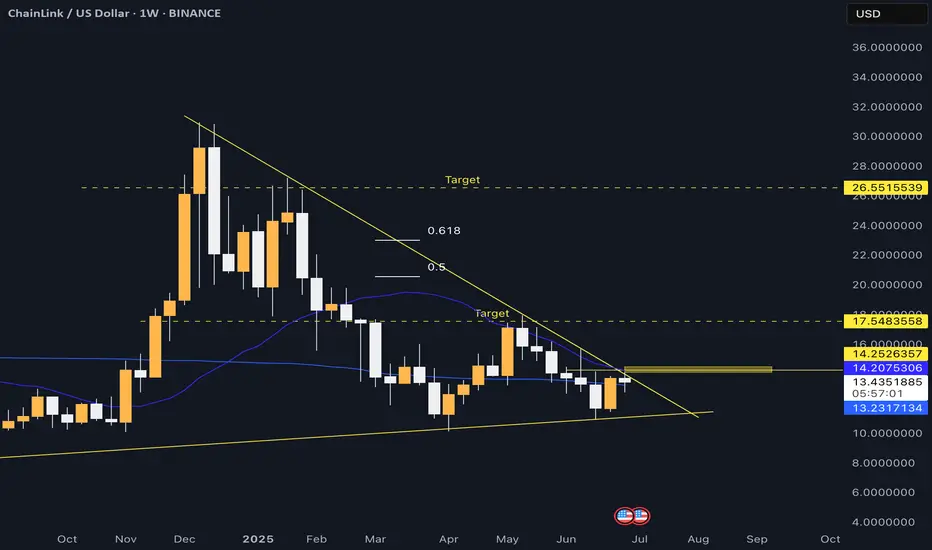
Link long - zoom in on weekly closeWe are approaching a breakout.
Maybe this week's close is the trigger that all the bulls (and altcoins) have been waiting for.
Generally speaking, I don't like trading Chainlink. Although if we see a weekly close just above 14.2, above the 20 MA, I think it could be a good investment entry.
I think Chainlink will be one of the utility coins that completely explodes before retail has time to react. A good weekly close is something that smart money probably would appreciate. If you think long-term, I think Chainlink is in a good position with good upside without any immediate big risk.
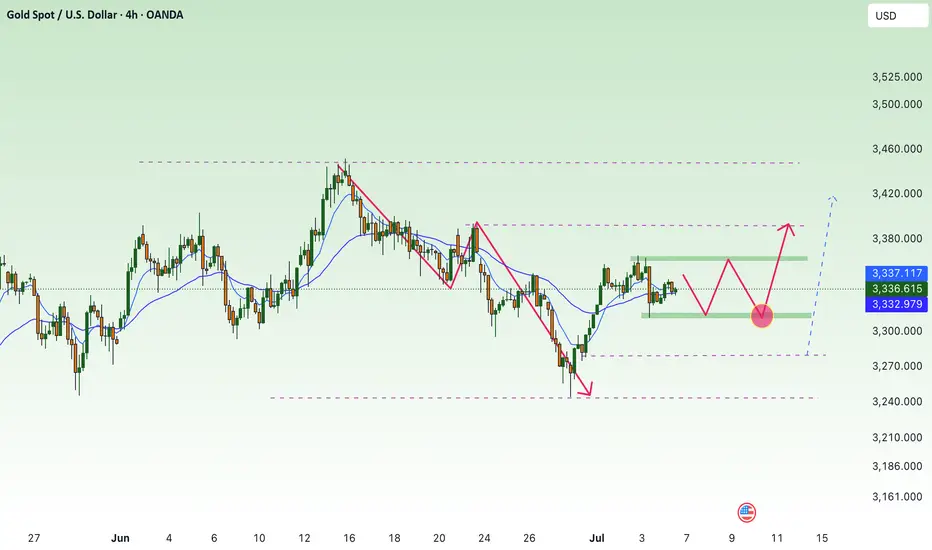
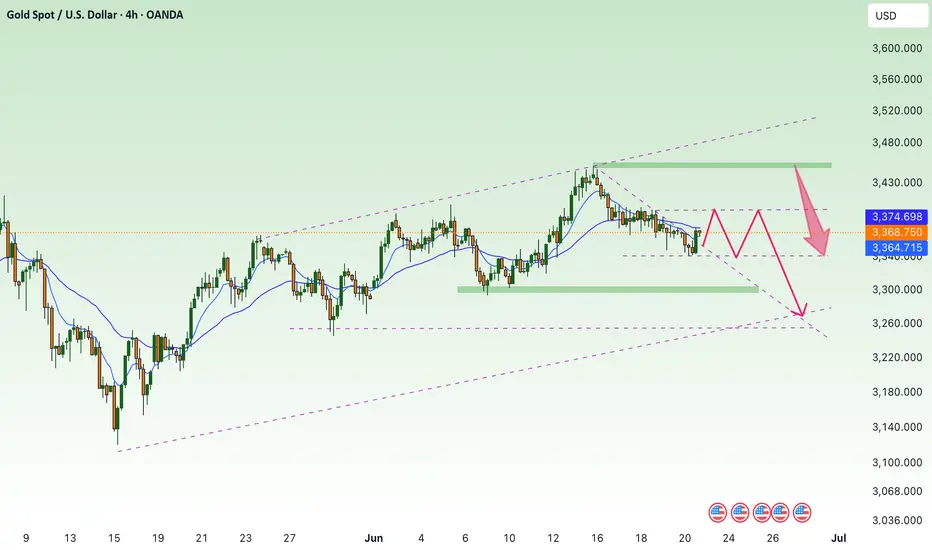
Gold price is moving sideways on H4 frame, above 3242✍️ NOVA hello everyone, Let's comment on gold price next week from 07/07/2025 - 07/11/2025
⭐️GOLDEN INFORMATION:
Gold prices resumed their upward momentum on Friday and are on track to close the week with gains exceeding 1.50%, supported by a weaker US Dollar amid subdued liquidity following the Independence Day holiday in the United States. A mild uptick in trade tensions also contributed to bullion's strength. At the time of writing, XAU/USD is trading at $3,333, up 0.26%.
President Donald Trump announced that the US would begin sending official letters to trading partners on Friday ahead of the July 9 deadline, outlining new tariff measures ranging between 10% and 70%, set to take effect on August 1. Treasury Secretary Scott Bessent added that a wave of trade agreements is expected before the deadline, estimating that around 100 countries will face a minimum 10% reciprocal tariff. He also hinted at upcoming deal announcements.
⭐️Personal comments NOVA:
Gold price continues to move sideways, accumulating in a large range: 3242 - 3450
🔥 Technically:
Based on the resistance and support areas of the gold price according to the H4 frame, NOVA identifies the important key areas as follows:
Resistance: $3362, $3393, $3446
Support: $3312, $3279, $3241
🔥 NOTE:
Note: Nova wishes traders to manage their capital well
- take the number of lots that match your capital
- Takeprofit equal to 4-6% of capital account
- Stoplose equal to 2-3% of capital account
- The winner is the one who sticks with the market the longest
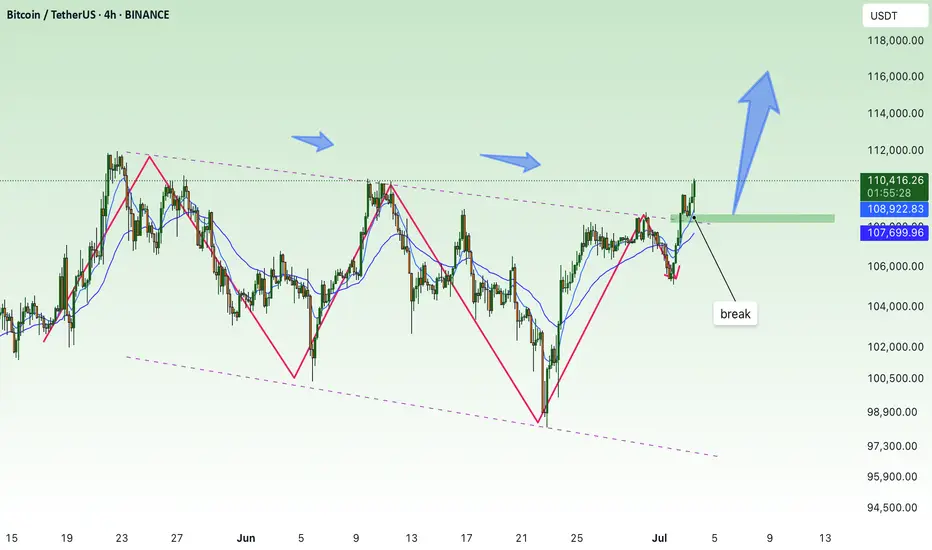
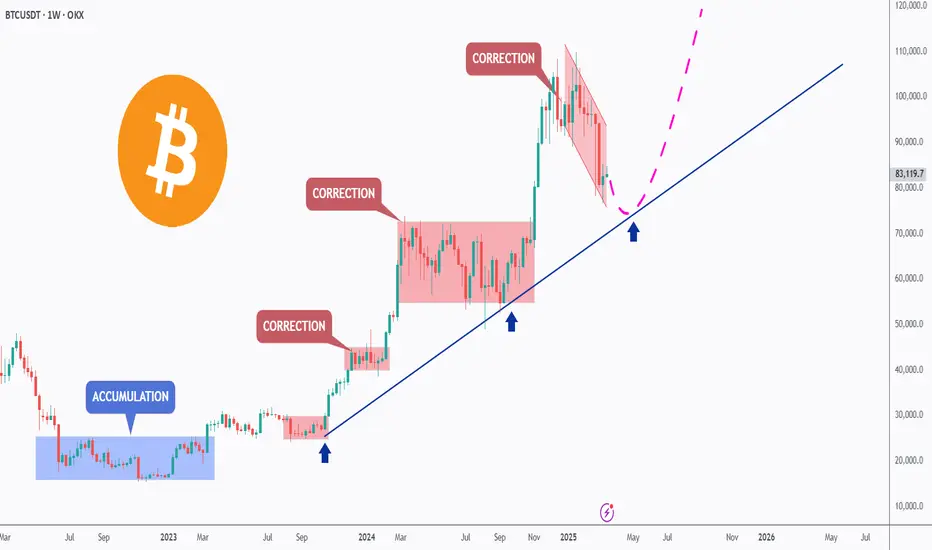
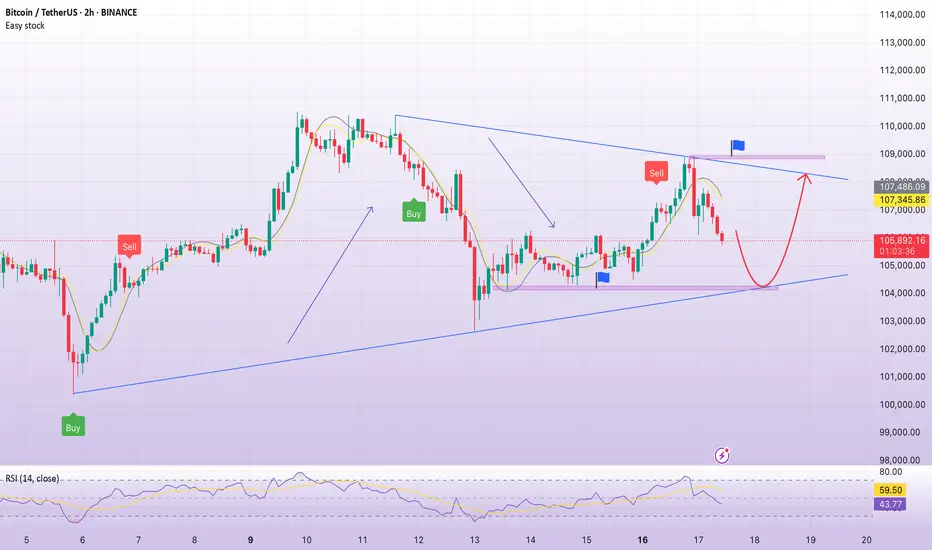
break, BTC soon reaches new ATH💎 Update Plan BTC after NFP (July 3)
Notable news about BTC:
Bitcoin (BTC) recovered to $ 109,000 on Wednesday when the US agreement with Vietnam and the increase in global M2 supply of M2 money has promoted an increase in open interest rates (OI), soaring to 689.78 thousand BTC worth about $ 75 billion. The cryptocurrency market in general has increased the price along with BTC, with leading altcoins, Ethereum (ETH), XRP and Solana (SOL) increased by 7%, 3%and 4%respectively.
Bitcoin, the market cryptocurrency market increased by the trade agreement with Vietnam and M2 money supply soared
The cryptocurrency market has recovered on Wednesday, an increase of 2% to regain the market capitalization of $ 3.5 trillion.
Technical analysis angle
First, congratulate the investors who follow the plan when we previously traded according to the model and had a short signal at 108k and took profit and then Long in the 106k area.
Currently, BTC is in wave 5 and is trapped in the Fibonanci area of 2,618 golden ratio around the price of 109k, this is also the threshold of the price of investors who are under pressure before the price area goes to 112k
The 112k region is a psychological area of profit and will appear on the 109k sales situation before the BTC price may rise further in the last 6 months of the year.
Please follow the channel to receive accurate scenarios about gold and BTC /-Teart /-heart
==> Comments for trend reference. Wishing investors successfully trading
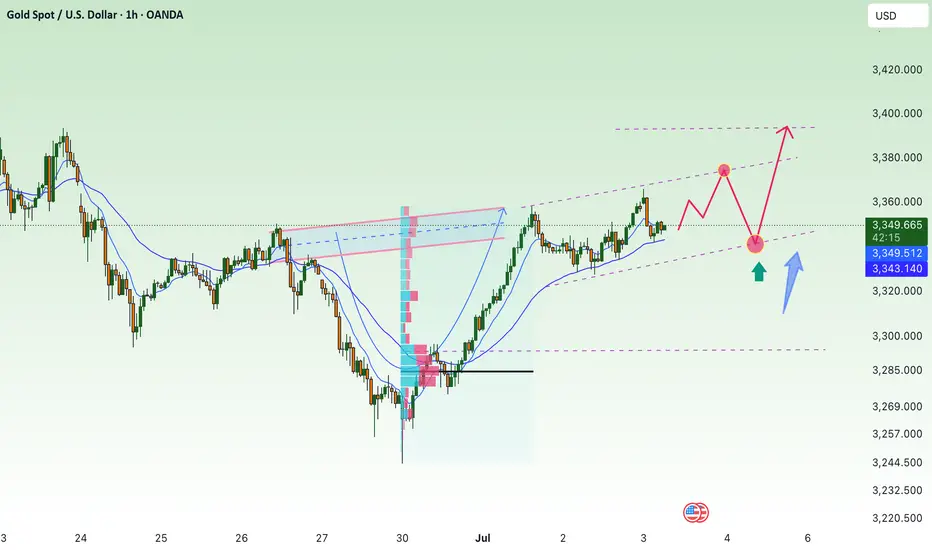
Gold growth, recovery 3393⭐️GOLDEN INFORMATION:
Gold prices edge higher during the North American session as investors turn their attention to the upcoming US Nonfarm Payrolls (NFP) report — a key indicator that could influence the Federal Reserve’s next policy move. At the time of writing, XAU/USD is trading at $3,348, up 0.29%.
Recent labor data from ADP revealed that companies are pausing hiring rather than resorting to layoffs, reflecting caution amid uncertain economic conditions. Meanwhile, Microsoft’s decision to cut 9,000 jobs has added to concerns about a softening labor market.
Traders now await Thursday’s official employment report from the Bureau of Labor Statistics, which is projected to show 110,000 new jobs added in June — a slowdown from May’s 139,000. The Unemployment Rate is expected to tick up slightly to 4.3%, still within the Fed’s projected range of 4.4% according to its latest Summary of Economic Projections.
⭐️Personal comments NOVA:
good buy, hold before NF news. Dollar continues to be under selling pressure from investors, worried about the Trump administration's unstable tariff policies.
⭐️SET UP GOLD PRICE:
🔥SELL GOLD zone: 3393- 3395 SL 3400
TP1: $3380
TP2: $3363
TP3: $3350
🔥BUY GOLD zone: $3296-$3294 SL $3289
TP1: $3308
TP2: $3318
TP3: $3330
⭐️Technical analysis:
Based on technical indicators EMA 34, EMA89 and support resistance areas to set up a reasonable BUY order.
⭐️NOTE:
Note: Nova wishes traders to manage their capital well
- take the number of lots that match your capital
- Takeprofit equal to 4-6% of capital account
- Stoplose equal to 2-3% of capital account
How I screen for long term investmentsIn this video, I’ll show you the exact stock screener I use to find long-term investment opportunities — the kind of stocks you can buy and hold for years.
I’ll walk you through the key metrics to look for, how to use free tools like TradingView screener, and what red flags to avoid. This strategy is perfect for beginner and experienced investors who want to build long-term wealth, not chase hype.
Whether you're looking for undervalued stocks, consistent compounders, or just trying to build your long-term portfolio, this screener can help.
Hope you enjoy!!

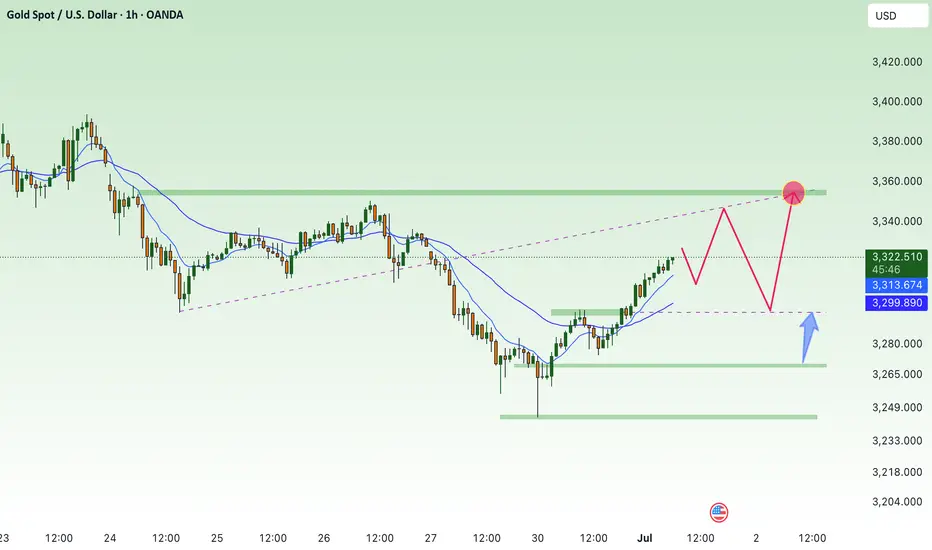
Gold price recovers above 3300⭐️GOLDEN INFORMATION:
Gold (XAU/USD) trades at $3,292 after rebounding from an intraday low of $3,246 and looks set to close out June with a modest gain of over 0.18%. However, its upward momentum has been restrained by easing geopolitical tensions in the Middle East and growing optimism over forthcoming trade agreements. Meanwhile, analysts at Citi expect Gold to consolidate within the $3,100 to $3,500 range throughout the third quarter.
In Washington, US Treasury Secretary Scott Bessent expressed confidence that the “One Big Beautiful Bill” will make progress in the coming hours. The sweeping tax reform legislation, which narrowly passed the Senate over the weekend, includes major tax deductions funded by reductions in Medicaid spending and green energy incentives.
⭐️Personal comments NOVA:
Gold price recovers above 3300 , ahead of NF reports this week . Accumulates above 3300
⭐️SET UP GOLD PRICE:
🔥SELL GOLD zone: 3353- 3355 SL 3360
TP1: $3340
TP2: $3330
TP3: $3320
🔥BUY GOLD zone: $3272-$3270 SL $3265
TP1: $3283
TP2: $3295
TP3: $3310
⭐️Technical analysis:
Based on technical indicators EMA 34, EMA89 and support resistance areas to set up a reasonable BUY order.
⭐️NOTE:
Note: Nova wishes traders to manage their capital well
- take the number of lots that match your capital
- Takeprofit equal to 4-6% of capital account
- Stoplose equal to 2-3% of capital account
BTC - Bullish SOON!Hello TradingView Family / Fellow Traders. This is Richard, also known as theSignalyst.
BTC has been in a correction phase, and it feels like it's taking forever! ⏳
As long as the blue trendline holds, the overall bias remains bullish. 📈
As BTC approaches the blue trendline—perfectly aligning with a demand zone and support—we'll be watching for trend-following longs to catch the next big impulse move upward. 🚀
For now, we wait! ⏳
📚 Always follow your trading plan regarding entry, risk management, and trade management.
Good luck!
All Strategies Are Good; If Managed Properly!
~Rich
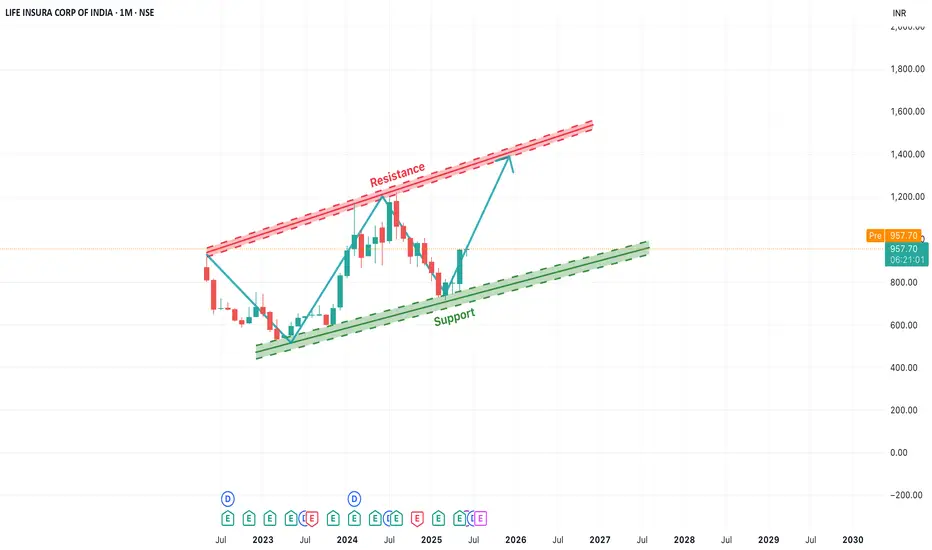
[Long-Term]LICI Rising Channel Pattern Indicates Bullish OutlookIn this monthly chart of LICI, we observe a clear ascending channel pattern forming over the past two years. The price has consistently respected both the support and resistance trendlines, creating a strong bullish structure.
Currently, the stock is bouncing off the lower support trendline, indicating a potential upward move towards the upper resistance zone. This offers a positive long-term outlook, especially if the momentum sustains. The key levels to watch are:
Support Zone: Around ₹850–₹900
Resistance Zone: ₹1250–₹1300
Traders and investors can monitor for a gradual rise toward the resistance level. A breakout beyond this channel may open up new highs, while a breakdown below the support trendline would invalidate the pattern.
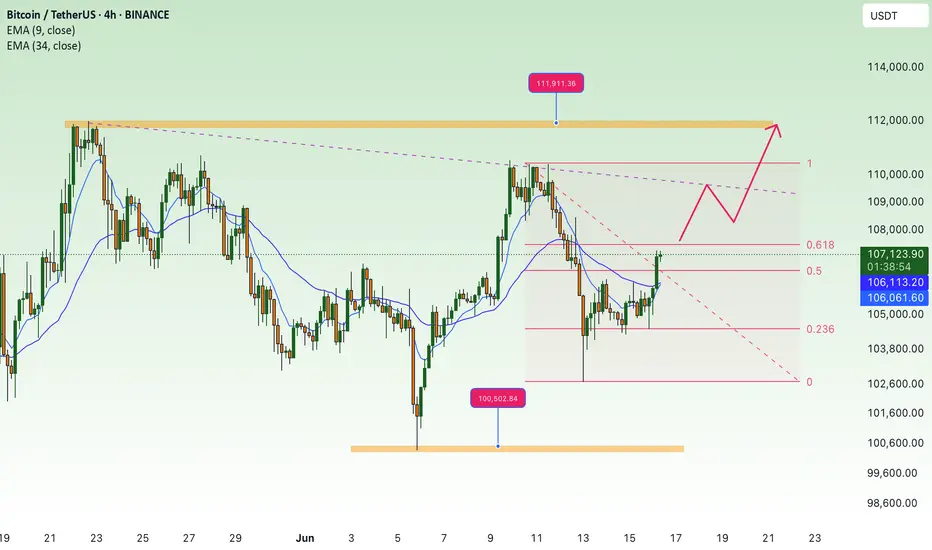
BTC recovers, price range sideways trend line💎 Update Plan BTC (June 25)
Notable news about BTC:
🌐 Growth stimulus factor
Reducing geopolitical tensions: The ceasefire agreement between Iran and Israel has helped improve investor psychology, promote capital inflows into risky assets like Bitcoin.
The dollar weakened: The USD index dropped to the lowest level in a year due to concerns about the economic impact from President Trump's tax policies, making Bitcoin a more attractive choice for investors to search for replacement assets.
Expectations for monetary policy: The decision of the US Federal Reserve (Fed) on keeping interest rates stable and interest rate cutting capacity in July has motivated the cryptocurrency market.
Technical analysis angle
Bitcoin may increase to the highest level of all time
Bitcoin price reached the lowest level of $ 98,200 on Sunday but has recovered strongly 5% in the next two days, closed on the dynamic average line according to the 50 -day exponential jaw at $ 103,352. At the time of writing on Monday, the price continued to trade higher at about $ 106,500.
If BTC continues to increase, the price can expand the momentum to the highest level of all time is $ 111,980 on May 22.
The relative power index (RSI) on the daily chart is 54, higher than the neutral level of 50, showing the motivation for price increase. The average divergent divergence (MACD) is referring to the price intersection (the MACD is about to cut on the signal line), if completed, the purchase signal will be made.
==> Comments for trend reference. Wishing investors successfully trading
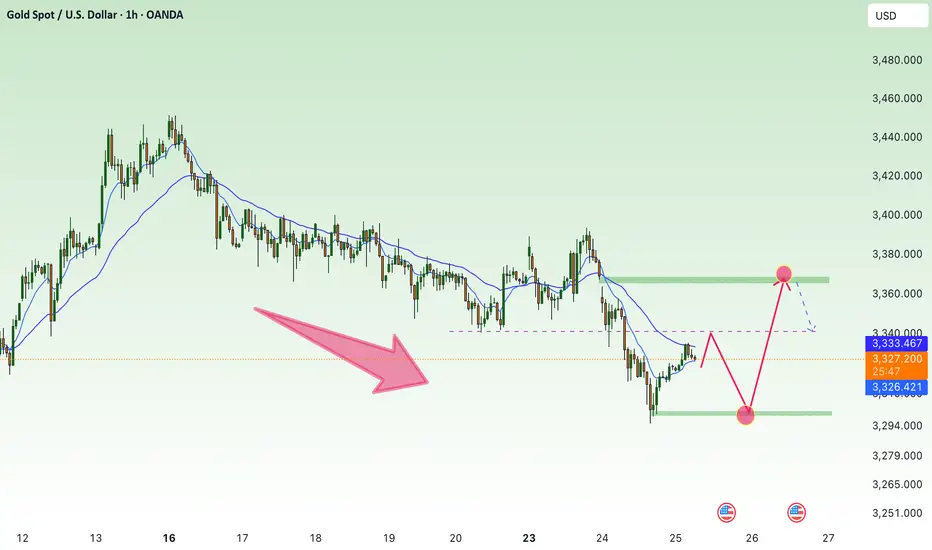
Gold price short term recovery 3366⭐️GOLDEN INFORMATION:
Kansas City Federal Reserve President Jeff Schmid stated on Wednesday that the central bank has sufficient time to assess the impact of tariffs on inflation before making any decisions regarding interest rates. His remarks suggest a cautious approach and align with Fed Chair Jerome Powell’s comments from the previous day.
Chair Powell reaffirmed the view that there is no urgency to alter monetary policy, emphasizing a patient, data-driven approach as the Fed monitors economic developments. This less dovish tone from Fed leadership may help cap downside pressure on gold in the near term.
Meanwhile, money markets are fully pricing in two rate cuts by the end of 2025, with a September move seen as more probable than one in July—although expectations for a July cut have slightly increased since last week.
⭐️Personal comments NOVA:
Gold price recovered and continued to accumulate, pay attention to the GAP 3366 area at the beginning of the week, selling pressure is still maintained.
⭐️SET UP GOLD PRICE:
🔥SELL GOLD zone: 3366- 3368 SL 3373
TP1: $3358
TP2: $3345
TP3: $3330
🔥BUY GOLD zone: $3303-$3301 SL $3296
TP1: $3315
TP2: $3328
TP3: $3340
⭐️Technical analysis:
Based on technical indicators EMA 34, EMA89 and support resistance areas to set up a reasonable BUY order.
⭐️NOTE:
Note: Nova wishes traders to manage their capital well
- take the number of lots that match your capital
- Takeprofit equal to 4-6% of capital account
- Stoplose equal to 2-3% of capital account
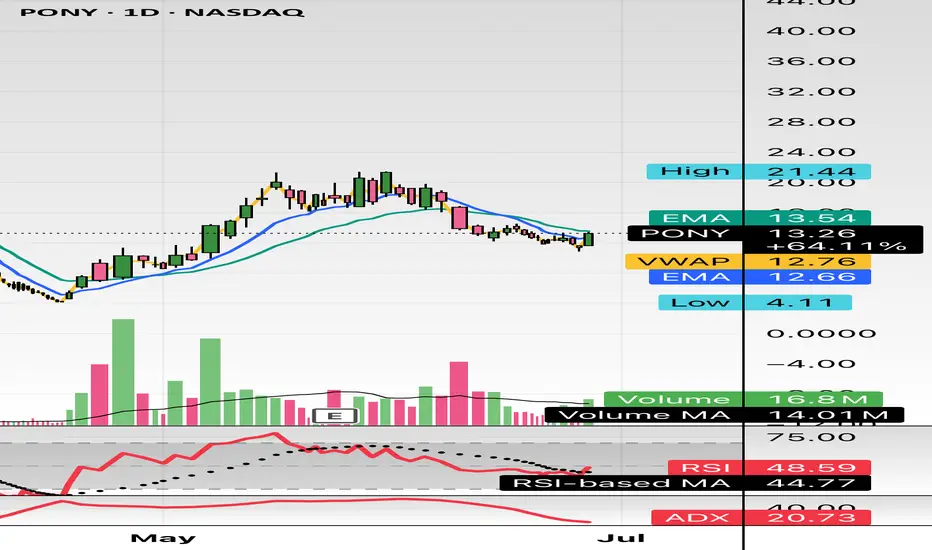
$PONY nothing technical, just pondering. Where does this go?Hello,
This name is interesting. I will be doing more research and due diligence along with asking some of my peers what they think. This name has seen increasing volume for a while now, daily moves of 5%, 10%, etc. Do you guys have any thoughts? Long term buy and hold? I randomly found this ticker a month ago just browsing.. talk to me in the comments and let me know.
WSL.
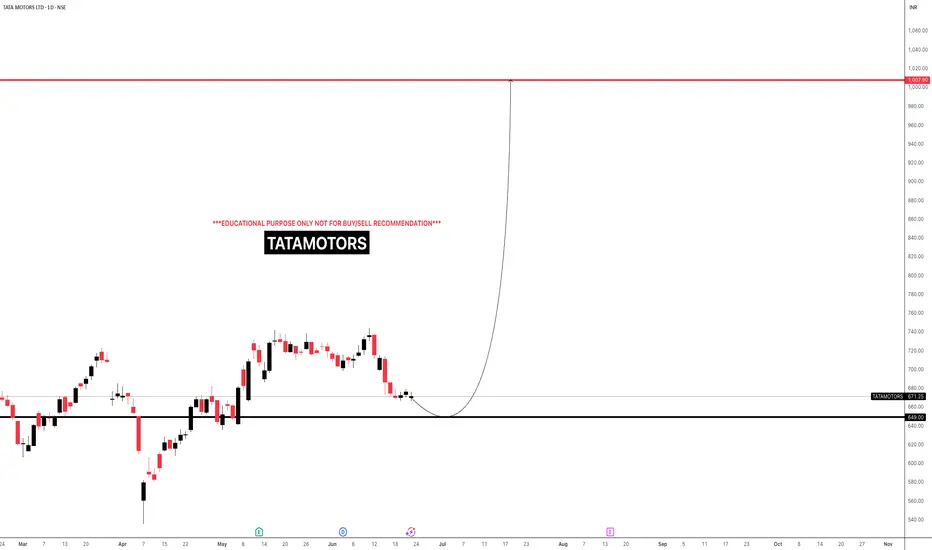
TATAMOTORSi Observed these Levels based on Price Action and Demand & Supply which is my own Concept "PENDAM CONCEPTS"... Please don't take any trades based on this chart/post... Because this chart is for educational purpose only not for Buy or Sell Recommendation... Thank Q
Middle East War - Gold Price Increases✍️ NOVA hello everyone, Let's comment on gold price next week from 06/23/2025 - 06/27/2025
⭐️GOLDEN INFORMATION:
Gold prices held steady on Friday, hovering near $3,369 and on track to post a weekly loss of nearly 1.90%, as markets digested US President Donald Trump’s decision to forgo immediate military action against Iran in favor of a diplomatic approach. At the time of writing, XAU/USD is down 0.11%.
While easing geopolitical tensions helped lift risk sentiment, additional pressure on gold emerged from concerns over potential US restrictions on allies operating semiconductor plants in China, as reported by Bloomberg. Trump's restraint on Iran encouraged a risk-on tone, weighing on the appeal of the safe-haven metal.
⭐️Personal comments NOVA:
Middle East tensions escalate, gold prices continue to recover above 3400, early next week
🔥 Technically:
Based on the resistance and support areas of the gold price according to the H4 frame, NOVA identifies the important key areas as follows:
Resistance: $3395, $3448
Support: $3302, $3256
🔥 NOTE:
Note: Nova wishes traders to manage their capital well
- take the number of lots that match your capital
- Takeprofit equal to 4-6% of capital account
- Stoplose equal to 2-3% of capital account
- The winner is the one who sticks with the market the longest
Detailed technical analysis of the ETH/USD chart🧭 General Context (1D, Long-Term):
The chart covers the period from approximately September 2023 to June 2025.
ETH/USD has gone through a complete cycle: growth → decline → correction → potential consolidation/accumulation.
🔹 Market Structure (Price Action)
🔸 Trends:
November 2023 – March 2024: strong uptrend, ETH reaches highs around $4,000+
March 2024 – February 2025: clear downtrend ending with a local low around $1,600
February 2025 – May 2025: dynamic rebound – probable trend change (new higher low + higher high)
May – June 2025: currently consolidating between ~$2,400–2,800
📉 Key Support and Resistance Levels
Type Level Notes
🔴 Resistance ~2,800 – 2,900 Local high, many candles with shadows rejected from above
🟡 Resistance ~3,200 – 3,400 Beginning of strong declines from 2024
🟢 Support ~2,300 – 2,400 Local lows in June 2025
🟢 Strong support ~1,600 – 1,800 Final market low of March 2025 (possible accumulation phase)
📊 Technical indicators
✅ Stochastic RSI (at the bottom of the chart):
Currently in the oversold zone (~0–20) → may signal a potential bottom / buying opportunity
Red-blue lines are starting to wrap upwards → possible rebound
Recent crossovers of the indicator corresponded to local price movements
🔍 Technical formations
⚠️ Possible formations:
Double Bottom: February–March 2025 → classic trend reversal formation
Rising Channel: from March 2025 to present – prices are moving in a slightly rising channel
Current consolidation may be a bull flag (continuation after the increase)
📌 Summary – scenarios
🟢 Bullish scenario:
Breakout of resistance ~2,800 → possible test of levels 3,200 – 3,400 USD
Confirmation of a higher low → continuation of the uptrend
Stochastic RSI in the oversold zone → potential for an uptrend
🔴 Bearish scenario:
Drop below 2,300 USD → possible return to the area of 1,800–1,600 USD
Breakout of the structure of higher lows
Confirmation that the increase was only a correction
🧠 Final conclusions
Currently, ETH/USD is in a key decision zone: after a strong rebound, the market is resting.
Stochastic RSI suggests a potential upside impulse, but requires confirmation by a breakout of resistance.
For traders: 2,800 (resistance) and 2,300 (support) are worth watching.
For investors: 1,600–1,800 could be considered a long-term accumulation zone.

BTC continues to accumulate above 103,500Plan BTC today: 19 June 2025
Related Information:!!!
Bitcoin (BTC) price edges slightly higher, trading near $104,700 at the time of writing on Thursday, after stabilizing above a key level — the 50-day Exponential Moving Average (EMA) at $103,100. A breach below this level could trigger a sharp fall in BTC. Risk aversion could intensify, as reports indicate that US officials are preparing for a strike on Iran in the coming days. Despite this risk-off sentiment in global markets, institutional demand remains strong, with US spot Bitcoin Exchange Traded Funds (ETFs) seeing positive inflows for eight consecutive days
personal opinion:!!!
btc continues to accumulate above 103,500, the market is no longer sensitive to interest rate information yesterday
Important price zone to consider :!!!
support zone : 103.500 \ 101.000
Sustainable trading to beat the market
Accumulate around 3400, Keep interest rate today⭐️GOLDEN INFORMATION:
Gold prices slipped below the $3,400 threshold on Tuesday, weighed down by renewed strength in the US Dollar (USD), despite a worsening global risk sentiment. The resilience of the greenback limited gains in the safe-haven asset, though mounting tensions between Israel and Iran continue to offer underlying support. At the time of writing, XAU/USD is trading at $3,380, down 0.05%.
Although risk appetite remains subdued, gold has struggled to rally, as the US Dollar regains ground. The US Dollar Index (DXY), which measures the currency against a basket of six major peers, climbed 0.46% to 98.58.
Meanwhile, geopolitical tensions intensified after US President Donald Trump abruptly departed the G7 summit in Canada on Monday in response to unfolding events in the Middle East. In a stark warning posted to his social platform, he urged, “Everyone should immediately evacuate Tehran,” signaling a sharp escalation in the conflict that began last Friday.
⭐️Personal comments NOVA:
Gold price is moving in accumulation zone below 3400 - 3365. Break and return above 3400, continue to accumulate.
⭐️SET UP GOLD PRICE:
🔥SELL GOLD zone: 3437- 3439 SL 3444
TP1: $3425
TP2: $3410
TP3: $3395
🔥BUY GOLD zone: $3338-$3340 SL $3333
TP1: $3346
TP2: $3355
TP3: $3370
⭐️Technical analysis:
Based on technical indicators EMA 34, EMA89 and support resistance areas to set up a reasonable BUY order.
⭐️NOTE:
Note: Nova wishes traders to manage their capital well
- take the number of lots that match your capital
- Takeprofit equal to 4-6% of capital account
- Stoplose equal to 2-3% of capital account
Continue the uptrend, gold price returns to 3444⭐️GOLDEN INFORMATION:
Gold prices (XAU/USD) slipped for the second consecutive session on Tuesday, retreating from an early uptick during the Asian session that briefly pushed prices above the $3,400 mark. A slight rebound in the US Dollar (USD) continues to weigh on the precious metal, acting as a key drag. However, the downside appears limited amid escalating geopolitical tensions in the Middle East and growing market expectations that the Federal Reserve (Fed) will initiate further rate cuts in 2025.
Meanwhile, the ongoing aerial conflict between Israel and Iran has entered its fifth day, heightening fears of a wider regional escalation. This persistent geopolitical uncertainty is keeping demand for safe-haven assets like gold supported. Investors are also exercising caution ahead of the Federal Open Market Committee’s (FOMC) two-day policy meeting, the outcome of which may shape the next directional move for non-yielding bullion.
⭐️Personal comments NOVA:
Gold price takes liquidity from lower supports: completed 3385, 3373. short term downtrend break. Gold price will soon return above 3400.
⭐️SET UP GOLD PRICE:
🔥SELL GOLD zone: 3443- 3445 SL 3450
TP1: $3435
TP2: $3422
TP3: $3407
🔥BUY GOLD zone: $3352-$3350 SL $3345
TP1: $3368
TP2: $3376
TP3: $3390
⭐️Technical analysis:
Based on technical indicators EMA 34, EMA89 and support resistance areas to set up a reasonable BUY order.
⭐️NOTE:
Note: Nova wishes traders to manage their capital well
- take the number of lots that match your capital
- Takeprofit equal to 4-6% of capital account
- Stoplose equal to 2-3% of capital account
BTC accumulates above 104,300 zonePlan BTC today: 17 June 2025
Related Information:!!!
Bitcoin (BTC) price falls to around $106,000 at the time of writing on Tuesday following a mild recovery the previous day. The decline comes as investors continue to digest the escalation of the Iran-Israel conflict and after US President Donald Trump highlighted concerns and asked his security advisors to meet in the Situation Room. While institutional interest in Bitcoin remains robust, any further escalation in the Middle East could impact global risk assets.
The US steps in to resolve the Iran-Israel war
Bitcoin price action remained broadly resilient on Monday despite escalating tensions in the Middle East. The four-day-old war between Israel and Iran, which began on Friday, has so far failed to trigger a sharp correction. The largest cryptocurrency by market capitalization held above its key psychological threshold of 100,000 despite the initial shock — a contrast to April last year, when BTC fell more than 8% amid similar Iran-Israel turmoil.
The New York Times reported on Monday that US President Donald Trump has encouraged Vice President JD Vance and his Middle East envoy, Steve Witkoff, to offer to meet with the Iranians this week.
personal opinion:!!!
Gold price continues sideways and accumulates in 2 trend lines, support 104,300
Important price zone to consider :!!!
support zone : 104.300 - 104.100
Sustainable trading to beat the market
Accumulate, BTC back above 110K💎 BTC PLAN UPDATE (June 16)
NOTABLE BITCOIN (BTC) NEWS:
Bitcoin (BTC), Ethereum (ETH), and Ripple (XRP) are showing signs of stabilization around key support levels following last week’s correction. BTC is attempting to regain momentum after closing below a critical support zone, while ETH and XRP are hovering near technical thresholds that could determine their next directional move.
TECHNICAL ANALYSIS OUTLOOK:
Bitcoin could decline further if it closes below the 50-day EMA
Bitcoin closed below its daily support at $106,406 on Thursday, then bounced back after retesting the 50-day Exponential Moving Average (EMA) at $102,893 on Friday. BTC has since stabilized around the $105,000 level over the weekend. As of Monday, it continues to consolidate, trading near $105,788.
If BTC fails to close above the $106,406 resistance level and heads lower, it may extend its decline toward the psychologically significant $100,000 level.
The Relative Strength Index (RSI) on the daily chart is hovering around the neutral 50 mark, signaling indecision among traders. Meanwhile, the Moving Average Convergence Divergence (MACD) indicator shows a bearish crossover on the daily chart, indicating selling pressure and a possible downtrend continuation.
At this stage, whether you're new or experienced, it's wise to spend more time practicing, deepening your technical analysis knowledge, and exploring educational content shared on the channel. Strengthening your foundation will help you protect your capital in this volatile environment.
==> This analysis is for trend reference only. Wishing all investors successful trades!
Time to leave marketIf you are an investor, it seems the risk-to-reward ratio is too high to stay in the market. The crypto market is giving us the last chance before it goes bearish!
Just look at the volume on this chart to find out that the last ATH was not supported by the bulls.

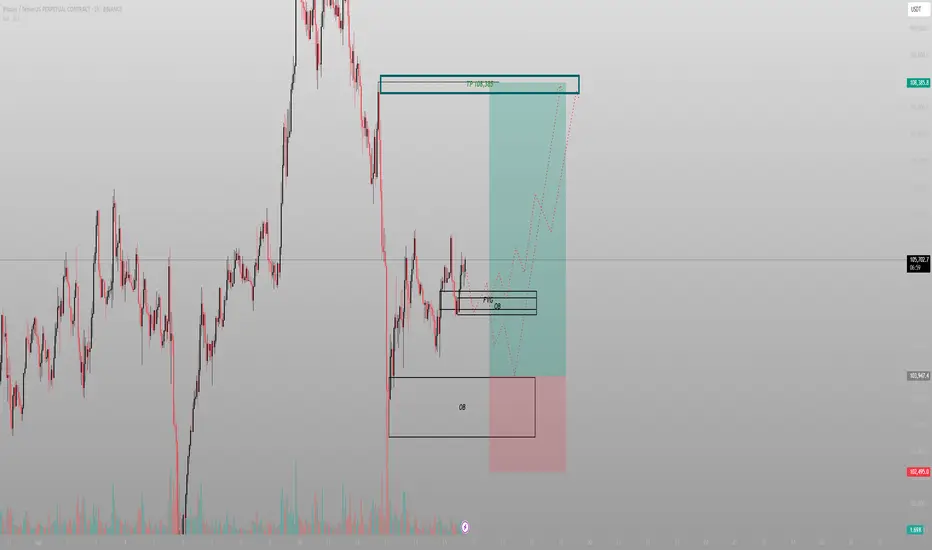
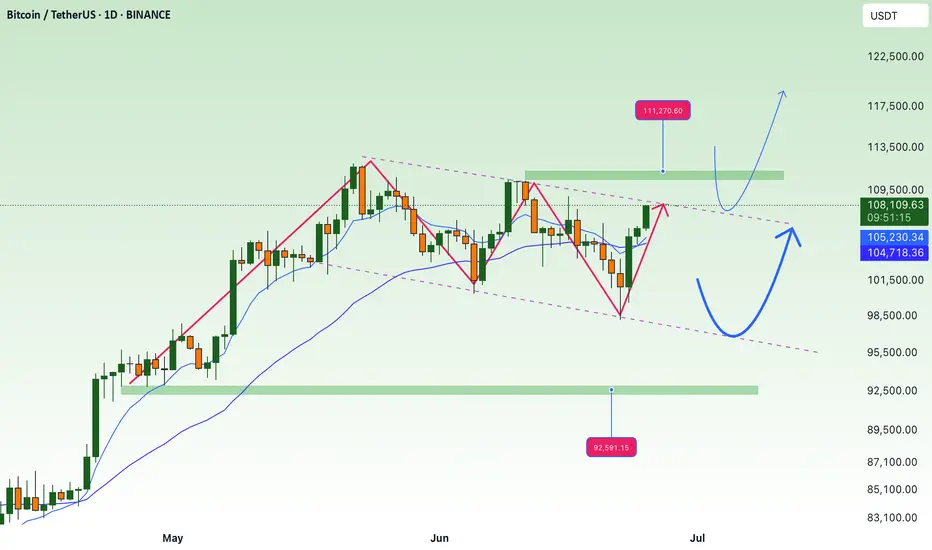
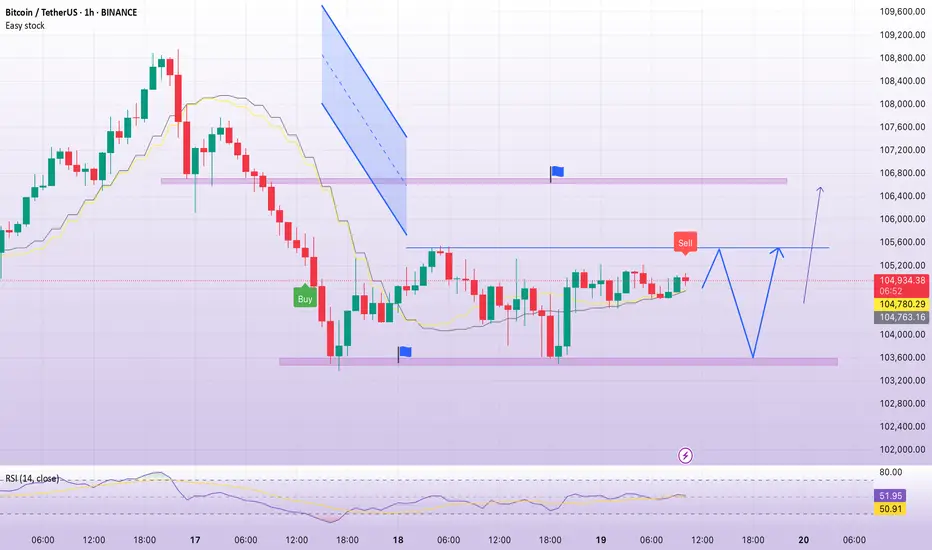
The FVG was the invitation. The OB was the entryBTC delivered exactly where it needed to. It didn’t break down. It rebalanced. The chart isn’t noisy — it’s speaking. And it’s pointing to 108.3k.
The logic:
Price printed clean displacement, returned to mitigate a 1H FVG stacked on top of a refined Order Block, then paused. That pause is structure — not indecision. Volume compression confirms it: absorption, not rejection.
A deeper OB sits below at 102.5k. If we tap it, it’s not invalidation — it’s refinement. But the primary play is already in motion.
The path:
Reclaim 105.7k range high
Break above intraday liquidity
Deliver to 108.3k inefficiency fill
Execution:
Entry: 104.8k–105.1k (current OB zone)
SL: Below 103.9k
TP: 108.3k
Don’t react to the candles. React to what they represent — engineered displacement followed by precision mitigation.
Final thought:
“This isn’t a trade setup. It’s a delivery route — and I’m already onboard.”