EUR/USD: Bullish Outlook with Key TargetsHey there, looking at the FOREXCOM:EURUSD chart on a 10-day timeframe, it’s clear that the price has been stuck in a range for almost two years. Right now, the price has broken through its 7-month high and is currently trading around 1.011. Personally, I have a bullish outlook for both the medium and long term.
⏩I anticipate that the price could rise toward mid-term targets of 1.11500 and 1.12800. After that, I expect the price to potentially continue its upward movement towards long-term targets of 1.14 and the Bearish Breaker Block at 1.15, especially if it breaks above the 1.12800 high.
To fully understand the ongoing trend, it will be important to observe how the price reacts to the mid-term targets.
💢 Please remember that this is just my personal viewpoint and should not be taken as investment advice. I’d love to hear your thoughts and share opinions!
Happy trading!✌😎
Sure, if you have any more questions or need further clarification, feel free to ask. I'm here to help!✌
Longterm

WELCORP - Welspun Corp Ltd - Uptrend - Long Term1. Consolidation
2. 50% retracement
3. Support taken at support level
4. Double Bottom at support level
5. Break-out and close previous All time high
6. ADX - shows strength of the trend

USDCAD - Massive Checkpoint!Hello TradingView Family / Fellow Traders. This is Richard, also known as theSignalyst.
📈 USDCAD has been overall bullish, trading within the rising channel marked in blue.
At present, USDCAD is undergoing a correction phase and it is hovering around the lower bound of the channel.
Moreover, it is retesting a massive demand and support zone marked in green.
🏹 Thus, the highlighted blue circle is a strong area to look for buy setups as it is the intersection of the green demand and lower blue trendline acting as a non-horizontal support.
📚 As per my trading style:
As #USDCAD is approaches the blue circle zone, I will be looking for bullish reversal setups (like a double bottom pattern, trendline break , and so on...)
📚 Always follow your trading plan regarding entry, risk management, and trade management.
Good luck!
All Strategies Are Good; If Managed Properly!
~Rich

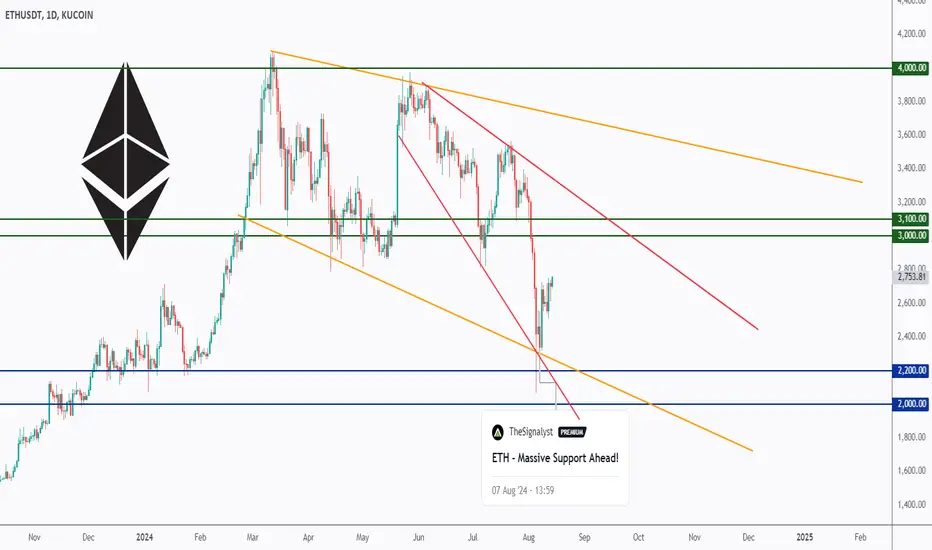
ETH - Bullish Unless...Hello TradingView Family / Fellow Traders. This is Richard, also known as theSignalyst.
📈 As per my last analysis, attached on the chart, ETH rejected the $2000 support zone and surged by over 25%.
What's next?
As long as the bulls hold, a movement towards the $3000 - $3100 resistance zone would be expected.
📉 In parallel, if the last 4H low at $2600 is broken downward, a bearish movement towards the $2100 would be possible where we will be looking for new short-term longs.
Which scenario do you think is more likely to happen and why?
📚 Always follow your trading plan regarding entry, risk management, and trade management.
Good luck!
All Strategies Are Good; If Managed Properly!
~Rich
Nordnet: The question is Breakout or Fakeout? OMXSTO:SAVE 's Position: Breakout or Fakeout?
OMXSTO:SAVE is currently at a critical juncture, having recently broken out of its long-term bullish channel. The key question now is whether this move represents a genuine breakout with a successful retest or just a fakeout.
Monthly Chart Analysis
On the monthly chart, we observe that since its IPO in 2020, Nordnet has been in a strong bullish uptrend, defined by two key trend lines. Recently, however, the stock broke through the upper boundary of this bullish channel, raising questions about its next move.
Weekly Chart Analysis
The weekly chart shows that after breaking through the upper trendline, the stock made a downward move, testing this line as a new support level. This was followed by a strong upward reaction, suggesting a potential retest and continuation of the bullish trend. However, the possibility of a fakeout remains, which could see the stock reverse back down to the long-term support level.
Daily Chart: Key Levels
On the daily timeframe, several key levels have emerged where the stock has shown significant reactions in the past. These levels—197 SEK, 217 SEK, and 230 SEK—are crucial for determining the stock's future direction. Recently, the stock bounced upward after touching one of these key levels and is currently testing another.
Support Line Identification
We can also identify a rising support line that the stock has respected, providing additional context for potential future movements.
Outlook: What's Next?
I anticipate that Nordnet may form a reversal pattern, such as a double bottom or an inverse head and shoulders, with the 217 SEK level serving as the neckline. If this scenario plays out, the stock is likely to resume its upward journey along the rising support line.
Trading Strategy
For those looking to trade this setup, consider entering a position near the long-term upper resistance line, provided there are confirmations on lower timeframes (e.g., reversal patterns, volume spikes, or indicator signals) that indicate upward momentum. If you suspect this is just a fakeout, it might be wise to wait for a clearer setup. Regardless, be sure to set a stop loss to minimize potential losses.

Tata Group stock- A generational wealth builder?IHCL is one of India’s leading hospitality companies. They are continuously increasing their portfolio of properties and diversifying their presence both across Bharat and the whole globe. The expansion is taking place at a rapid place.
The company has also reduced its debt successfully to pre Covid levels which is a positive sign. It has increased its operating profit margin from average 15% to a good 30%. The revenue is also at its high and it will definitely increase in the coming future with increasing portfolio of hotels.
Increase in price of land and increasing property prices will also be a key factor in increasing the book value of the company which will further increase the share price.
Thus it is a good opportunity to invest in this company. The stock may go down from 600 levels as the stock has given a good run up in the last year but for long term view small falls should not effect us. The company is looking healthy for parking money for 15-20 years.
Hope you like my analysis.
Please do your own analysis before investing.
Do like and follow and share among your friends and family.
Thank you.

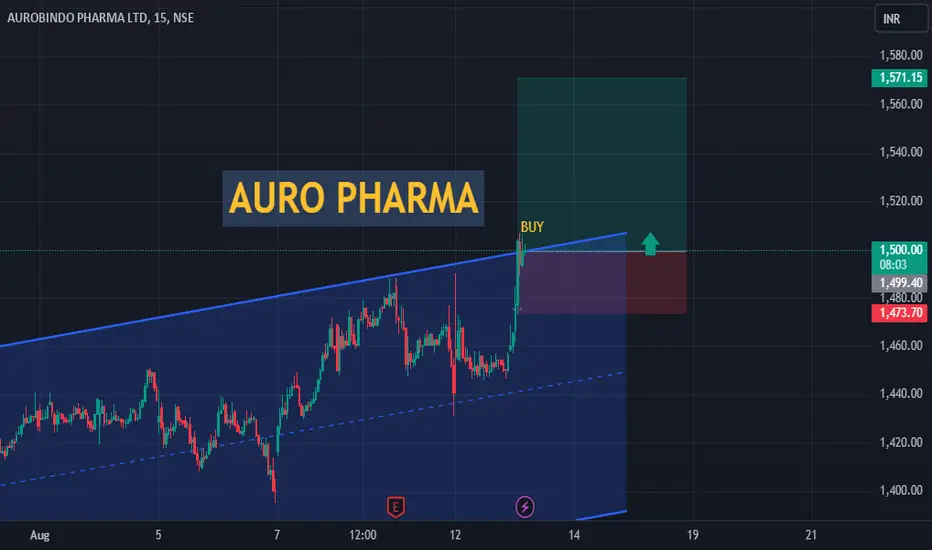
Auro Pharma - Bullish Harami - Daily Time Frame#AuroPharma
PCR : 0.78
Daily Volume : ++ 2.8x
Daily Fut OI change : +2.3
ATM IV : 27.6 (+1.5)
IVP : 16
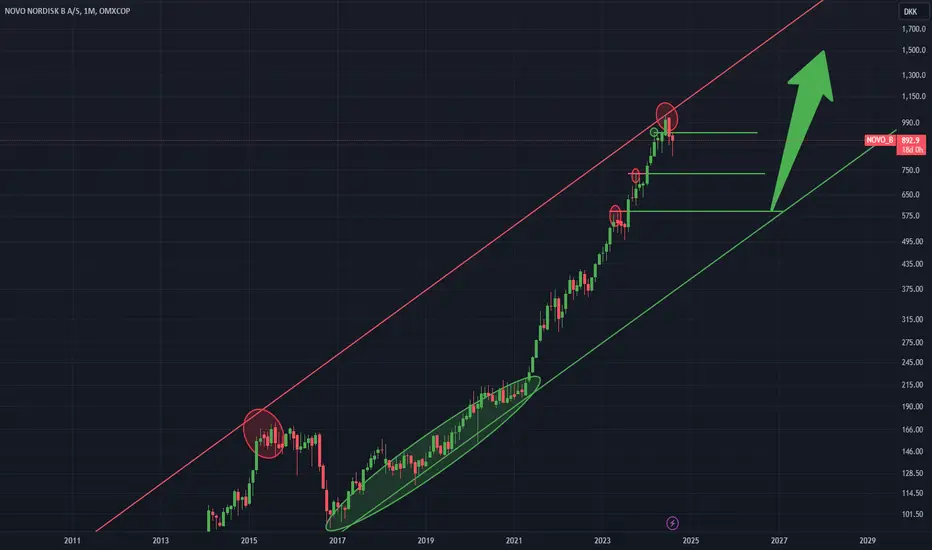
Novo Nordisk: Analyzing a Potential Pullback and Key levelsLong-Term Overview (3M Timeframe)
Looking at the 3-month timeframe, we can observe that OMXCOP:NOVO_B
has maintained a consistent bullish trend channel since 1990, characterized by higher highs and higher lows.
Medium-Term Analysis (1M Timeframe)
On the one-month timeframe, since the last significant pullback in 2016, OMXCOP:NOVO_B
has surged by approximately 1000%. Recently, the stock touched the upper resistance trend line and then experienced a sharp downward move, suggesting an impending pullback, which could be followed by another significant bullish run.
Key Levels (1W Timeframe)
Focusing on the one-week timeframe, we can identify crucial levels at 590 DKK, 735 DKK, and 930 DKK. Historically, these levels have acted as key resistance and support zones, making them critical areas to watch moving forward.
Fibonacci Analysis
Using Fibonacci retracement, the stock has respected the 0.236 level, reinforcing the validity of these levels as potential reversal points during the pullback. The relevant Fibonacci levels to monitor are 810 DKK, 670 DKK, and 560 DKK.
Outlook and Strategy
Given the recent price action, I anticipate that OMXCOP:NOVO_B
may form a reversal pattern, such as a double top or head and shoulders, leading to a more pronounced pullback. This pullback could have a reversal at one of the identified key levels or the lower support line within the long-term bullish trend channel.
How to Capitalize:
To capitalize on this potential move, consider monitoring smaller timeframes for signs that the pullback is concluding at the key levels. Once you identify such signals, a strategic entry could be made, with a stop loss placed just below the key support level to minimize risk.
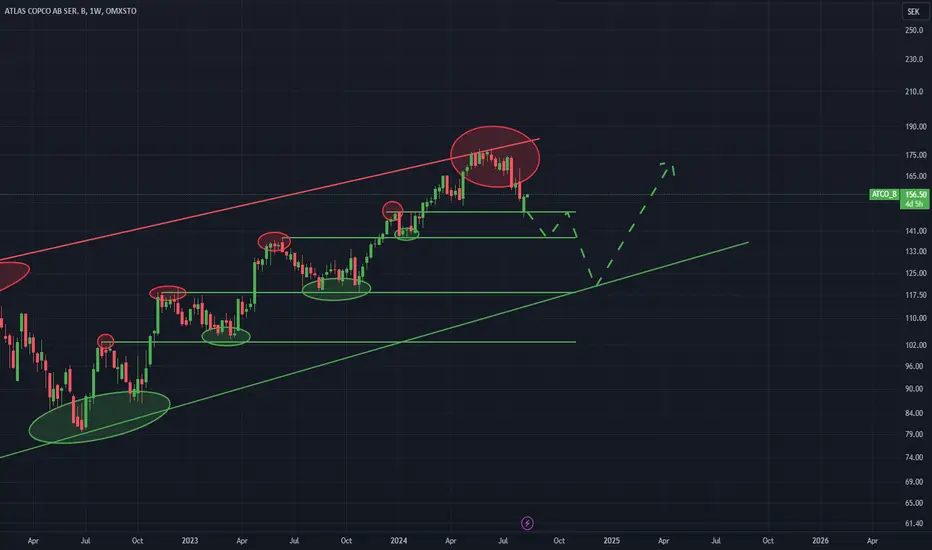
Atlas Copco AB: Potential Entry Points in a Long-term UptrendOMXSTO:ATCO_A has demonstrated a long-term uptrend throughout its history, marked by two strong channels, with higher highs and higher lows.
Since the Ukraine-Russian market crash, OMXSTO:ATCO_A has experienced a 100% increase. Currently, the stock is at the resistance channel, which has resulted in a notable downward reaction:
During the strong uptrend, previous resistance levels, where the price peaked, turned into support levels when the stock experienced pullbacks. Now, as the stock returns to these crucial levels, they may serve as key support, potentially causing the stock to struggle to break below them or to rebound and rise further.
I anticipate that the stock will gradually break through each of these key levels, eventually approaching the lower trendline before launching into a significant bull run. This scenario presents a promising opportunity for a long position, but we need additional bullish confirmation at these levels before making a move.
Important levels: 150 SEK, 140 SEk, 120 SEK, 100 SEK
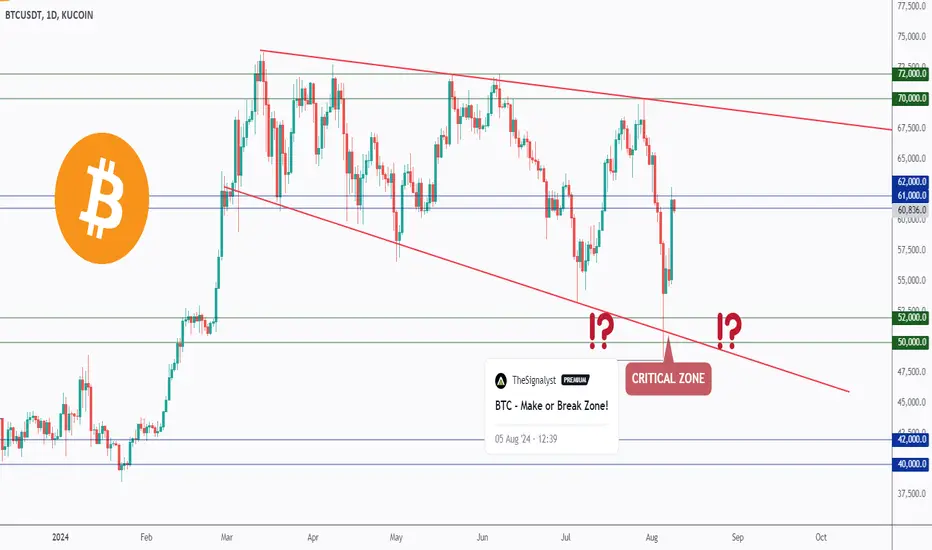
BTC - Key Checkpoint...Hello TradingView Family / Fellow Traders. This is Richard, also known as theSignalyst.
📈 As per my last analysis, attached on the chart, BTC rejected the $50,000 support zone and surged by over 25%.
What's next?
Currently, BTC is hovering around a key rejection level and round number $60,000.
For the bulls to maintain control and push towards $70,000, a break above the $60,000 level is needed.
📉 Meanwhile , the bears can still kick in for one more correction phase especially if the $59,000 support is broken downward.
Which scenario do you think is more likely to happen and why?
📚 Always follow your trading plan regarding entry, risk management, and trade management.
Good luck!
All Strategies Are Good; If Managed Properly!
~Rich
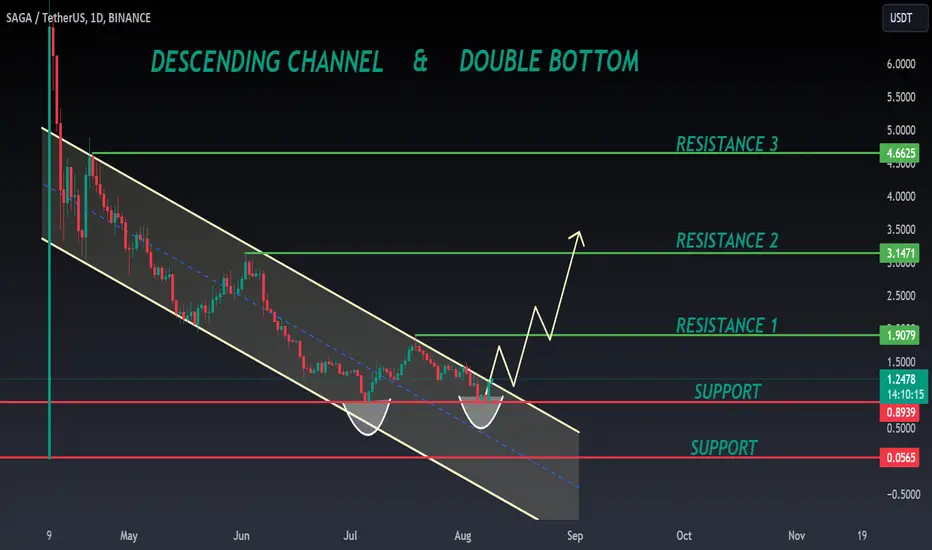
SAGA ANALYSIS🔮 #SAGA Analysis 🚀🚀
As we can see that #SAGA is trading in a Descending Channel Pattern in daily time frame. Also there is a formation of double bottom pattern which indicates a bullish momentum. A perfect breakout of both pattern will make a bullish movement in #SAGA 💸 💯🚀
💸Current Price -- $1.2490
📈Target Price -- $3.1470
⁉️ What to do?
- We have marked crucial levels in the chart . We can trade according to the chart and make some profits. 🚀💸
#SAGA #Cryptocurrency #DYOR
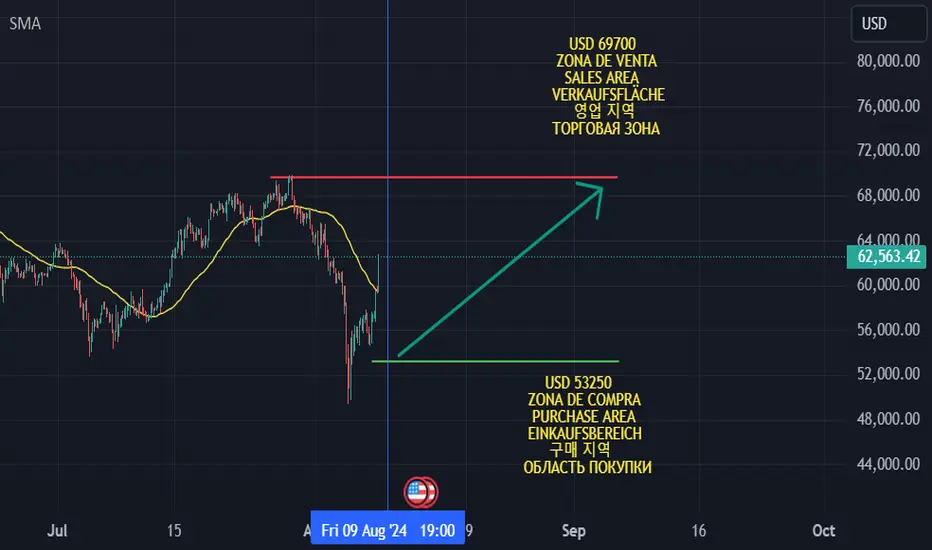
LONG X 50 HIGH PRECISION ODER FLOW TRADINGBTC futures leverage x 50 LONG
Entry Point : USD 53250
Target : USD 69700
Stop Loss : USD 52750
Stall Brake : ??? USD
Leverage is extremely risky and must be executed with money that we are willing to lose or hit the stop loss.
Trading is the only profession in which the only person responsible for our actions is ourselves, our worst enemy is ourselves, here there is no one to blame, this is not a collective work, the only one who presses the sell button buy and know how much you invest and where to put a stop to losses, it is you, and only you, so always remember that.
Important note: THE LEVEL OF LEVERAGE OR LEVERAGE, the alert for taking early profits, loss stop adjustment and forced operation closure are not made by this means.
And also remember to always have control over your losses, focus on this and you will last.
Comment: WARNING!!!!
I AM NOT A FUTUROLOGIST, I DO NOT MAKE PREDICTIONS, I DO NOT DO ANALYSIS,
I AM 100% A MARKET OPERATOR, I WORK BASED ON MY EXPERIENCE, CONSISTENCY AND MY PLANNING IN TRADING.
Leave a comment that is helpful or encouraging. Together we can dominate the markets.
STG Long Term Profits PlanHello traders!
Currently, we are experiencing a big drop in Crypto but other markets have also been dropping hard. So, now instead of going all panic mode let's switch gears and plan ahead to take advantage of the buying opportunities. So, here's my plan in the long term for StarGate.
1) Right now, we can see price hit the Demand Zone which is the zone marked in green. It got pierced though recently after a real long time. However, it's turning into a hammer candle and reversing altogether which means strong buying pressure stepping and it could totally be a fakeout, so we should stay alert to see how it plays out.
Possible confirmations for the demand zone to be safe are: Wait for the price breakout and take a position when it re-test the zone back again.
In the future if the bearish trendline gets broken, we can expect an important rise on the price. We still have to deal with a strong supply zone which is marked in red. If price manages to pierce through the supply then we fly to the moon ♥ meanwhile, I'll be monitoring weekly and informing STG movements over time.
2) TARGETS: The nearest one would be 0.53, which would act as a mean reversion zone. After that, we can expect ranging, and we'll have to wait for signs and clues to find out what could possibly happen next. Targets long term: the supply zone and the ATH +
This idea is to spot for the long term. This asset is still in ranging mode; there hasn't been a breakout of the range yet. However, it's worth noting that there's a triangle pattern playing out in the monthly timeframe, right now.
I hope you find it useful and are able to take advantage of this idea.
Kina Tip of the Day: Take profits partially even when they don't seem much because, in the long run, they will grow in a balanced way with the rest of the portfolio.
Keep it shiny ⭐
Kina, The Girly Trader

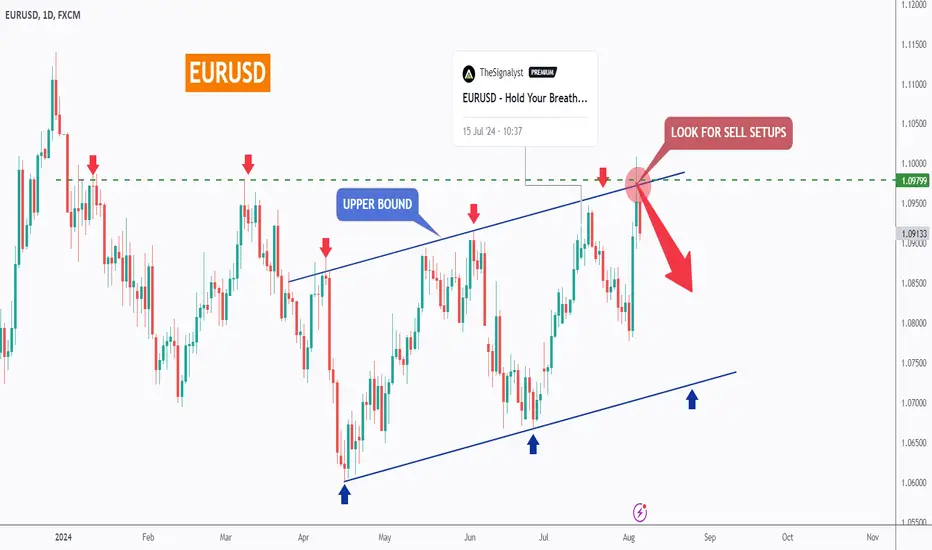
EURUSD - Shorting Again!Hello TradingView Family / Fellow Traders. This is Richard, also known as theSignalyst.
📈As per my last analysis, attached on the chart, EURUSD rejected the upper bound of the rising blue channel.
Currently, EURUSD is retesting that trendline again!
Moreover, the zone marked in green is a strong resistance zone.
🏹 Thus, the highlighted red circle is a strong area to look for sell setups as it is the intersection of the resistance zone in green and upper blue trendline acting as a non-horizontal resistance.
📚 As per my trading style:
As #EURUSD approaches the red circle zone, I will be looking for bearish reversal setups (like a double top pattern, trendline break , and so on...)
📚 Always follow your trading plan regarding entry, risk management, and trade management.
Good luck!
All Strategies Are Good; If Managed Properly!
~Rich
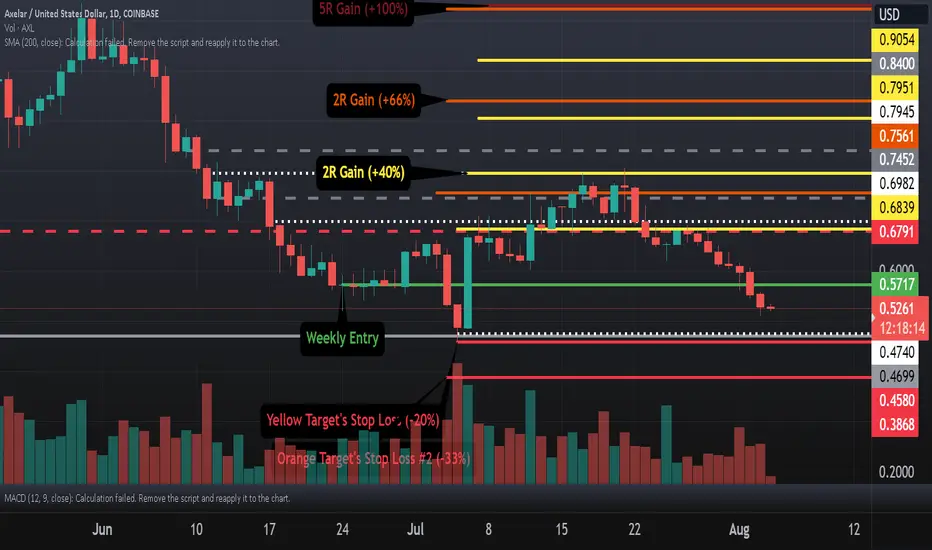
AXL 8R Trade Idea with Entry, Targets, and Stop LossAXL is down from entry and has tagged the previous weekly entry that sent price down 32% and then up 500% (47 cents entry to 32 cents low, and finally a rally to $2.7). Price has retraced this move back to the previous entry of 47 cents AND made another weekly entry at 57 cents.
Targets based on the risk from that entry have been drawn.
Yellow Stop loss of -20% is based on previous lows.
Orange stop loss of -33% is based on how low price went after the previous weekly entry of 48 cents before the rally (-32% from weekly entry)
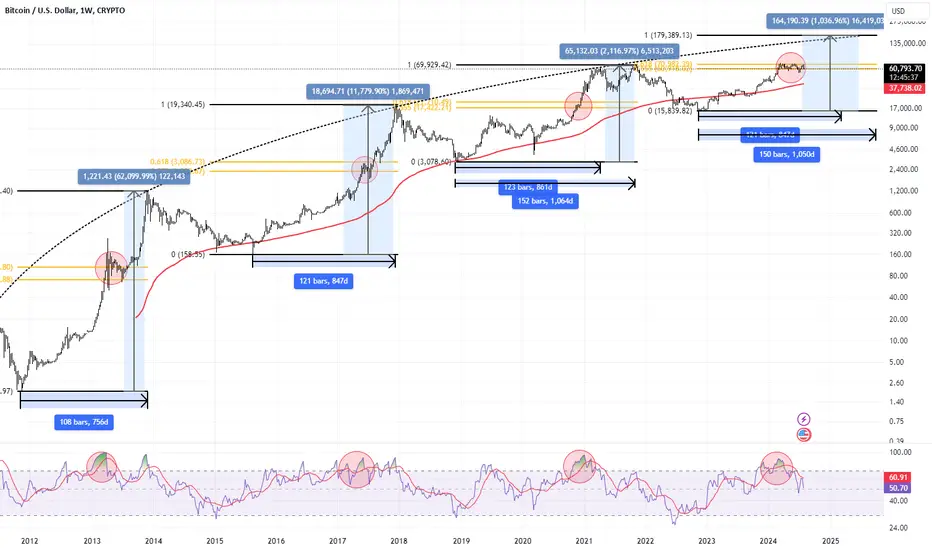
BTC | The Bigger Picture Today I am showing you the BTC Weekly chart as in previous cycle we went lower on the rsi but the price still went up. The Golden Zone showing the bottom for the next bear market except the one in 2013 for 2015 just a little bit off. My guess is that the btc top will be around 150-170k in Q1 of 2025.
Hope you like my analysis and and can give me some feedback, Thanks.
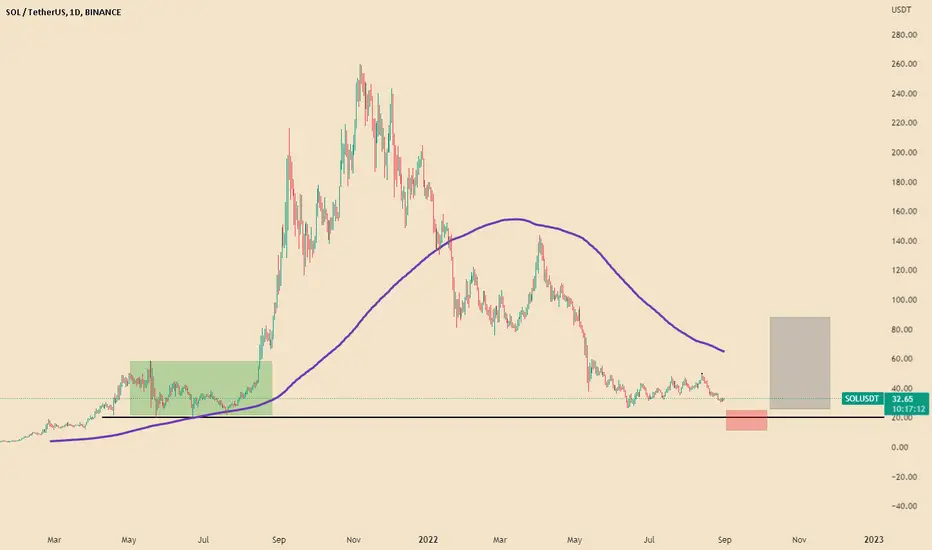
Solana Long Term Buy AreaSolana probably bottoms below 20 seeing how much interaction we had with that area in the past, im a buyer between 10-20. Those buys just before the big rally must puke. NFA, DYOR.
Deepak Nitrite: 18 months of sadness 😞This Analysis was requested by @anerishah269
The chart should tell you everything you need to know about NSE:DEEPAKNTR :
However, Below are some 'good to know' pointers:
- The Price action is completely sideways in nature with clearly marked support and resistance zones
- The price has been consolidating for over 18 months now
- Owing to the sideways nature, the breakout of the trendline did not have a huge impact on the price momentum. The price immediately took a rejection from the resistance zone and gunned for a retest.
- Bearish crossover of MACD on a weekly TF is a negative
- The PE ratio has worsened
- The Psy. levels of 2000 and 2500 are at play
- We can expect some good momentum once either of the zones is broken. Until then, it's hold the fight and sit tight situation for us.
What should we analyze next?
Have Requests, Questions, or Suggestions? DM us or comment below.👇
⚠️Disclaimer: We are not registered advisors. The views expressed here are merely personal opinions. Irrespective of the language used, Nothing mentioned here should be considered as advice or recommendation. Please consult with your financial advisors before making any investment decisions. Like everybody else, we too can be wrong at times ✌🏻

Perfect Time Buying Intel (INTC) - LONGINTC get dropped by bad news to 2013 prices.
Strong resistance at 19.47
To be updated

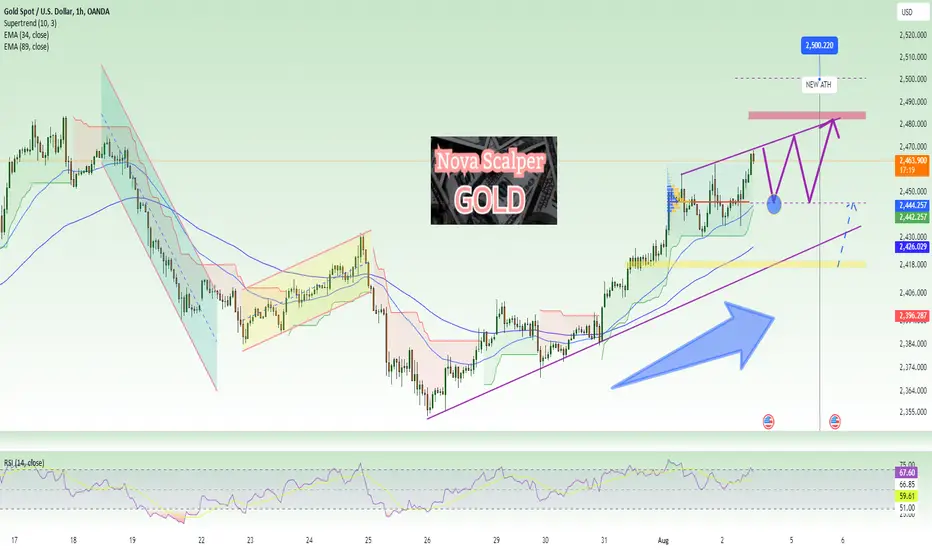
NF - NEW ATH XAU - market expectations⭐️ Smart investment, Strong finance
⭐️GOLDEN INFORMATION:
Gold price rises to around $2,450 per ounce in Asia on Friday. Traders are waiting for US labor market data for July. Recent data on manufacturing and employment in the US have raised concerns, boosting demand for safe-haven assets like Gold. US ISM Manufacturing PMI fell to 46.8 in July, lower than expected. Initial Jobless Claims for the week ended July 26 increased to 249K.
⭐️Personal comments NOVA:
Sentiment and the market are looking forward to a new ATH point today after the NF news was announced. The expected resistance zone is 2500
⭐️SET UP GOLD PRICE:
🔥BUY GOLD zone: $2442 - $2444 SL $2438( scalping / Only applicable for Asian and European sessions )
TP1: $2449
TP2: $2455
TP3: $2462
🔥BUY GOLD zone: $2415 - $2417 SL $2410
TP1: $2425
TP2: $2440
TP3: $2450
🔥SELL GOLD zone: $2502 - $2504 SL $2510
TP1: $2490
TP2: $2480
TP3: $2460
⭐️ Technical analysis:
Based on technical indicators EMA 34, EMA89 and support resistance areas to set up a reasonable BUY order.
⭐️ NOTE:
Note: Nova wishes traders to manage their capital well
- take the number of lots that match your capital
- Takeprofit equal to 4-6% of capital account
- Stoplose equal to 2-3% of capital account
- The winner is the one who sticks with the market the longest
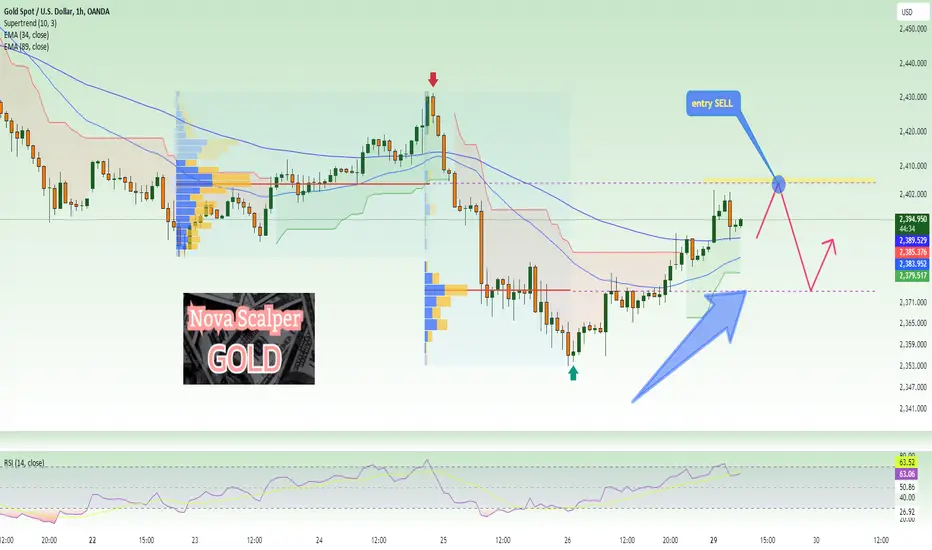
Gold price recovered to $2400, sideway Monday⭐️ Smart investment, Strong finance
⭐️ GOLDEN INFORMATION:
The price of gold (XAU/USD) demonstrated strength below the 50-day Simple Moving Average (SMA) on Friday and made a slight recovery from a low point reached over two weeks ago. This upward movement occurred after the US Personal Consumption Expenditures (PCE) Price Index was released, indicating a modest increase in inflation in June. This development raised expectations for the Federal Reserve (Fed) to begin reducing interest rates soon. Following the inflation data, US Treasury bond yields decreased, weakening the US Dollar (USD) and supporting the gold, which does not provide interest yields.
⭐️ Personal comments NOVA:
Gold price recovered at the beginning of the week - world military news continues to influence gold price to recover to 2400, sideways this area is expected to continue below $2400
⭐️ SET UP GOLD PRICE:
🔥BUY GOLD zone: $2374 - $2372 SL $2367
TP1: $2380
TP2: $2390
TP3: $2400
🔥SELL GOLD zone: $2406 - $2408 SL $2413
TP1: $2400
TP2: $2390
TP3: $2380
⭐️ Technical analysis:
Based on technical indicators EMA 34, EMA89 and support resistance areas to set up a reasonable BUY order.
⭐️ NOTE:
Note: Nova wishes traders to manage their capital well
- take the number of lots that match your capital
- Takeprofit equal to 4-6% of capital account
- Stoplose equal to 2-3% of capital account
- The winner is the one who sticks with the market the longest
ETH - Trading The Range, AGAIN!Hello TradingView Family / Fellow Traders. This is Richard, also known as theSignalyst.
As per our previous analysis, ETH rejected the $3000 support zone and traded higher.
📈 ETH is still trading within a big range in the shape of a symmetrical triangle.
🏹 Thus, as it approaches the $3000 again, we expect a bullish movement towards the $3,500 round number.
📚 Always follow your trading plan regarding entry, risk management, and trade management.
Good luck!
All Strategies Are Good; If Managed Properly!
~Rich

NZD/ CAD !! 7/26 trendline Uptrend✍️ NOVA hello everyone, Let's comment on NZD/CAD price long-term trend
🔥 Identify:
D1 - long-term time frame shows that the price is following the Uptrend line - touching the trendline. wave 5
🔥 Technically:
Based on the resistance and support areas of the NZD/CAD price according to the H4 frame, NOVA identifies the important key areas as follows:
Resistance: 0.82500 - 0.84000 - 0.85500
🔥 NOTE:
Note: Nova wishes traders to manage their capital well
- take the number of lots that match your capital
- Takeprofit equal to 4-6% of capital account
- Stoplose equal to 2-3% of capital account
- The winner is the one who sticks with the market the longest
