BTC Market Cycle | Repetitive and Predictable Market CycleThe Bitcoin market cycle can be easily predicted by studying historical data. Whenever you seek an idea of where the market is heading, you can always look at the past to gauge the future. However, this doesn't guarantee that the predictions stated here will unfold exactly as described; it's a PREDICTION, not a fact.
Let's examine the chart displayed here. The market cycle repeats itself every four years, with our chart divided into four cycles, the fourth being the current cycle we are in. Every four years, Bitcoin undergoes a major event known as Halving, where the number of blocks containing Bitcoins is halved every four years. We started with 50 Bitcoins released in a block every 10 minutes; in 2012, that amount was reduced to 25 BTC. In the following cycle, it was halved again, and this will continue to happen every four years until all Bitcoins are mined. Currently, we are heading towards the fourth halving event, which will see the number of blocks released reduced to 3.125 BTC.
Due to this event, the price of Bitcoin appreciates in value every four years. This is driven by supply and demand, as fewer Bitcoins are mined than in the previous four years (reduced supply), creating scarcity and increasing demand. The mining difficulty also increases, causing miners to be reluctant to sell the Bitcoins they've mined, contributing to the price increase.
On our chart, we have three completed cycles that look almost identical. The cycles consist of a bull market where the price experiences a significant increase, followed by a bear market where the price drops in the range of 80–85%. This is followed by the first expansion, where we see a slight price increase, followed by the first accumulation phase. Prices move up and down within a specified range during this phase, also known as the consolidation phase. We then move on to the second expansion and the second accumulation, usually forming just before or within the halving period.
This not only shows us that the market cycles are similar but also allows us to predict future events. At the time of writing this, we are three months away from the fourth halving, and it appears we have entered the second accumulation phase, as seen in the past three cycles. Prices should trade in a specified range for a few months after the halving. When you examine the halving events on the chart, you can observe that we usually enter the bull run somewhere between 6 to 8 months after the halving. Based on that, we can predict that the next bull run will start between October and December 2024, lasting until the fourth quarter of 2025.
In the past, the cycles have been accurate, and we can expect the same unless a global catastrophic event occurs, as seen in March 2020 during the COVID-19 pandemic. In that phase, there was no second expansion as all markets crashed. It is my opinion that this led to the bull run not reaching its full potential. Had we experienced the second expansion, the price would have moved slightly higher before the second accumulation phase, leading to an extended bull run pushing the price near or above $100k.
My price prediction at the end of the cycle, assuming world events stay normal, is to see Bitcoin in the range of $120–150K.
What do you think the price of Bitcoin at the end of 2025 will be? Like, share, and feel free to leave a comment. Let me know if you agree or disagree with this analysis.
Longterminvesting

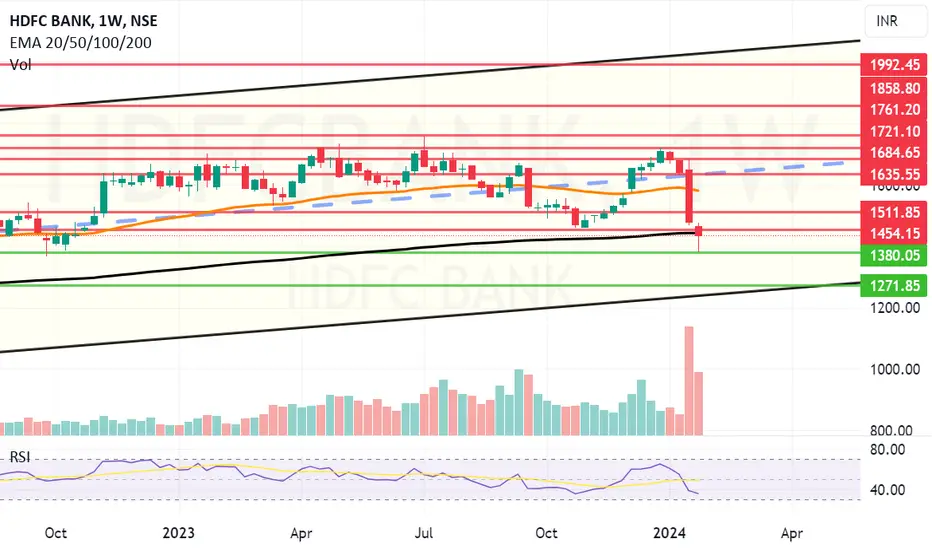
Partial entry (Paper Trading) possible in HDFC Bank. HDFC BANK: (Portfolio Stock) : SIP Buying can be started in HDFC Bank. It may go further lower so only partial entry or entry with / for tracking quantity to be initiated now.
We had mentioned earlier that 1369-80 or 1271 can act as a bottom/major support for HDFC Bank. The stock touched 1380 and has reversed. So X/3 or X/4 entry can be taken. If it falls further to 1271 (Which is also possible) You can add again on bounce around those levels. Next X/3 entry should be after closing above 1588. Stop loss Monthly closing below 1270. Targets long term: 1625, 1684, 1721 and 1761+.
The above information is provided for educational purpose, analysis and paper trading only. Please don't treat this as a buy or sell recommendation for the stock. We do not guarantee any success in highly volatile market or otherwise. Stock market investment is subject to market risks which include global and regional risks. We will not be responsible for any Profit or loss that may occur due to any financial decision taken based on any data provided in this message.
BRITANNIA FOR LONG TERM INVESTMENT IDEAAs we can see stock is on ATH and trades above all EMA on day week month TF and retrace with gravestone doji on day TF. looks strong on week & month.
it can go in a further upward direction.
TECHNICALS
—RSI ABOVE 60 ON ALL TF
—CUP & HANDLE BREAKOUT 5 JUNE WITH GOOD VOLUME
—OPEN MARUBOZU
—BULLISH CROSS OVER
ENTRY IS MENTIONED ON THE CHART
educational purpose only!✨
Do your research before making any investment🥂

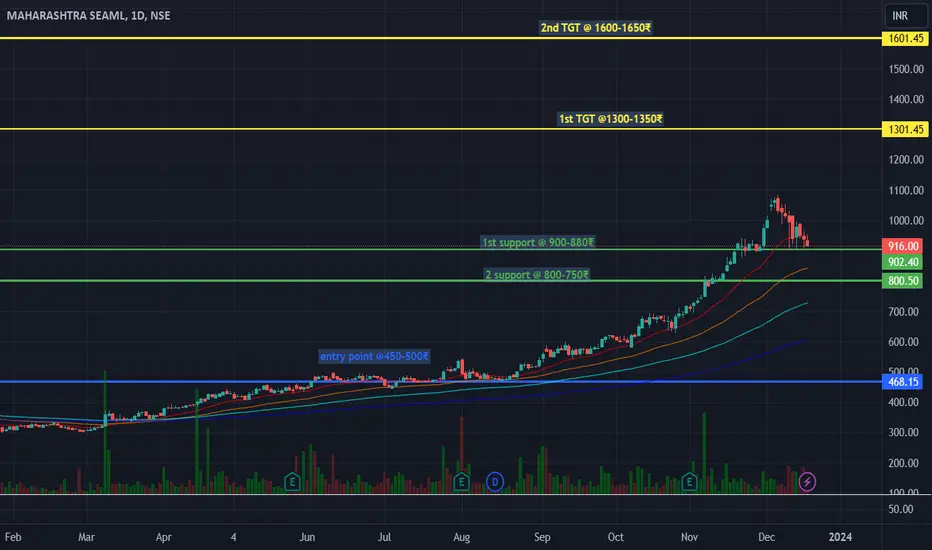
Maharashtra Seamless LimitedThe co. has a market share of 55% in the seamless pipes segment and a market share of 18% in the API-certified, high-frequency ERW pipes segment.
Revenue as FY22
Steel Pipes and Tubes: 95%
Clientele
Some esteemed clients of the Co include Indian Oil Corporation Ltd, BHEL, Reliance Industries Ltd, ISGEC, NTPC, Larsen & Toubro, and more, and Infrastructure clients are Adani, DLF, GAAR, IGL, Unitech etc.
On installation of finishing facilities at Telangana in FY24, existing capacity of 100,000 MTPA will be activated (seamless pipes segment)
Technical vs. Fundamental Analysis: Finding a BalanceLooking to make more holistic investment decisions, but not sure how? Understanding the difference between technical and fundamental analysis and how to incorporate both is an essential step to accomplishing holistic investing. Today we will explore how finding a balance between these pillars of trading can help you navigate the complex world of investing.
The Importance of Finding a Balance
Finding the right balance between technical and fundamental analysis can be the key to successful investing. By combining the two approaches, traders gain a comprehensive understanding of a stock's potential, taking into consideration both the short-term market trends and the long-term value.
When it comes to investing, it's important to have a complete view of the market. Relying solely on technical analysis may leave you susceptible to missing out on crucial information about a company's financial health and growth prospects. Similarly, relying purely on fundamental analysis may cause you to overlook short-term market trends that could impact the stock's price in the near future, potentially leading to poor entries and exits.
A balanced approach allows you to leverage the strengths of both technical and fundamental analysis, providing you with a more complete picture of the investment opportunity at hand. So, whether you're a short-term trader or a long-term investor, finding the sweet spot between technical and fundamental analysis can help maximize your chances of making a profitable investment.
Understanding Technical Analysis
Technical analysis focuses on analyzing historical price and volume data to predict future price movements. Traders using this approach often rely on chart patterns, indicators, and trendlines to identify buy and sell signals.
Chart patterns, such as triangles, head and shoulders, and double tops/bottoms, provide insights into potential price reversals or continuations. These patterns are formed as a result of the collective actions of market participants and can signal impending price movements. However, when using price patterns it is critical to understand the statistical odds of success for completion of the pattern. Price patterns can be subjective to the trader's skill and overall directional bias, so traders should combine price patterns with other forms of technical analysis.
Indicators, such as moving averages, Relative Strength Index (RSI), and Bollinger Bands, help traders identify overbought or oversold conditions, measure the strength of a trend, and spot potential entry or exit points. When indicators are combined to form a robust and complementary system traders gain a wealth of information about the near-term health of an underlying asset. It is critical to note that no indicator system is perfect and will not guarantee you a 100% success rate. However, when paired with proper risk mitigation, psychology, and supporting forms of technical analysis, using indicators can lead to long-term success.
Trendlines are used to analyze the direction and strength of a stock's price movement. Drawing trend lines connecting the highs or lows of a stock's price can help identify support and resistance levels, price channels, and potential trend reversal areas.
Support and resistance zones are price levels on a chart that indicates where trends are likely to pause or reverse. Support is a zone where a downtrend pauses due to demand, while resistance is a zone where an uptrend pauses due to supply. These zones are based on market sentiment and human psychology, shaped by emotions such as fear, greed, and herd instinct. Traders tend to congregate near these zones, strengthening them. Support levels indicate a surplus of buyers, while resistance levels indicate a surplus of sellers. It's important to note that these levels are not exact numbers but rather "zones" that can be tested by the market.
Understanding how these tools work and how to interpret their signals is crucial for technical analysis. It allows traders to make intuitive decisions based on historical price patterns and market dynamics. However, it's important to note that technical analysis has its limitations.
Limitations of Technical Analysis
While technical analysis can provide valuable insights into a stock's potential price movements, it's important to recognize its limitations. Technical analysis is primarily focused on historical data and patterns, which may not always accurately predict future price movements.
Market sentiment, news events, and other external factors can significantly impact a stock's price, often rendering technical analysis less effective. If you don't believe me, just look at the price charts for the last four years. Try to pinpoint major world or domestic events such as the start of the pandemic or the Fed's hawkish shift. Additionally, technical analysis does not take into account the intrinsic value of a company, which is a key consideration in fundamental analysis.
Therefore, relying solely on technical analysis to make investment decisions may leave you vulnerable to market uncertainties and potential pitfalls. This is where fundamental analysis comes into play.
Understanding Fundamental Analysis
Fundamental analysis involves examining a company's financials, industry trends, and market conditions to determine its intrinsic value. Investors who lean towards fundamental analysis believe that a company's true worth is reflected in its financial strength and growth potential.
Key factors considered in fundamental analysis include a company's revenue and earnings growth, profit margins, debt levels, competitive positioning, and management team. By analyzing these factors, investors can assess whether a company is undervalued or overvalued, and make investment decisions accordingly. Most, if not all of this information is readily available on the internet, but it can take some digging to find all the information one would need. There is also a wide range of financial-related indicators readily available on TradingView.
Fundamental analysis also takes into account macroeconomic factors, such as interest rates, inflation, and government policies, which can impact the overall market and the performance of individual stocks.
How to Conduct Fundamental Analysis
Conducting fundamental analysis involves a thorough examination of a company's financial statements, such as its income statement, balance sheet, and cash flow statement. These statements provide insights into a company's revenue, expenses, assets, liabilities, and cash flows.
Analyzing financial ratios, such as the price-to-earnings (P/E) ratio, return on equity (ROE), and debt-to-equity ratio, helps investors assess a company's financial health and profitability. Much of this information is available on TradingView under the financials tab. TradingView has done an excellent job of making a majority of the aforementioned financial data available, right at your fingertips.
Industry analysis is another important aspect of fundamental analysis. Understanding the industry dynamics, competitive landscape, and market trends can provide insights into a company's growth potential and its ability to outperform its peers. There is a plethora of this information online, and diligence in your research will make a world of difference.
By combining financial analysis with industry analysis, investors can gain a deeper understanding of a company's overall prospects and make more informed investment decisions.
Finding a Balance Between Technical and Fundamental Analysis
Finding the right balance between technical and fundamental analysis requires a thoughtful approach. Here are some strategies to help you integrate the two approaches:
Start with fundamental analysis: Begin by analyzing a company's financials and industry trends to assess its long-term growth potential. This will provide you with a solid foundation for your investment decisions.
Use technical analysis for timing: Once you've identified a promising investment opportunity based on fundamental analysis, use technical analysis to refine your entry and exit points. Technical indicators and chart patterns can help you identify optimal times to buy or sell a stock.
Consider the bigger picture: While technical analysis focuses on short-term market trends, it's important to consider the long-term value of a company. Evaluate the fundamental factors that can impact a company's growth potential and use technical analysis as a tool to validate your investment thesis.
Keep an eye on market sentiment: Market sentiment can influence stock prices in the short term. By staying informed about news events, economic indicators, and market trends, you can better understand the context in which technical and fundamental analysis are operating.
By finding a balance between technical and fundamental analysis, you can better manage your investment decisions that take into account both short-term market dynamics and long-term value. This balanced approach can help you navigate the complex world of investing and maximize your chances of success.
In conclusion, understanding the difference between technical and fundamental analysis is crucial for making theoretically sound investment decisions. By finding a balance between the two approaches, you can gain a comprehensive understanding of a stock's potential, considering both the short-term market trends and the long-term value. So, whether you're a short-term trader or a long-term investor, incorporating both technical and fundamental analysis can help provide a better view and maximize your chances of making profitable investment decisions.
Happy Trading!

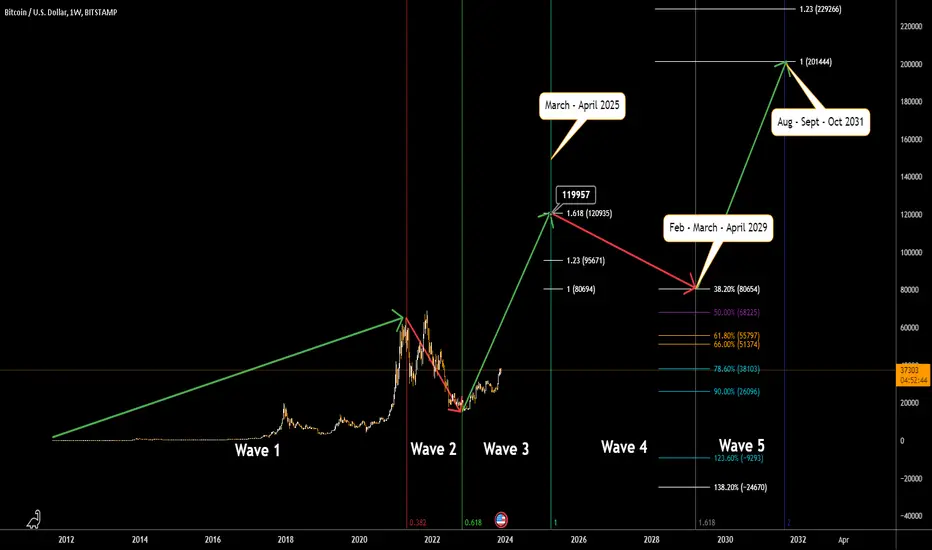
Bullish BTC count Elliott Wave - Time AnalysisThis is my bullish count for BTC !
Volume has to kick in very soon in this 3 wave!
After that a sideways 4th wave and a final shot to $200.000 in a 5th wave
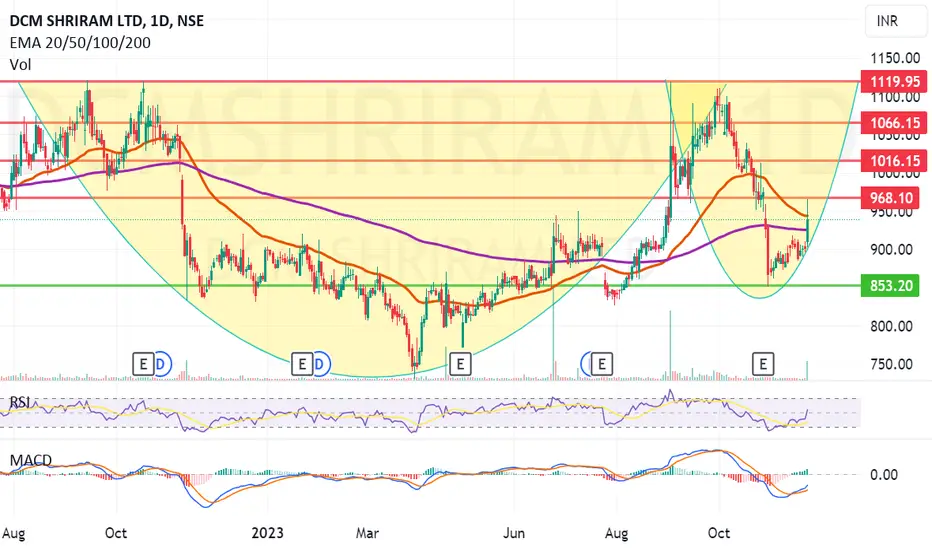
Weekend idea 2: DCM Shriram can rise, investing can be idea wiseDCM Shriram Ltd. is a diversified company with business in agriculture, chemicals, plastics, cement, textiles and energy services. DCM Shriram CMP is 938.55.
The Negative aspects of the company are MFs are decreasing stake. The positive aspects of the company are No debt, zero promoter pledge, FIIs increasing stake, improving annual net profit, and Improving cash from operations annually.
Entry can be taken after closing above 969. Targets in the stock will be 1016 and 1066. The long-term target in the stock will be 1119. Stop loss in the stock should be maintained at Closing below 853.
The above information is provided for educational purpose, analysis and paper trading only. Please don't treat this as a buy or sell recommendation for the stock. We do not guarantee any success in highly volatile market or otherwise. Stock market investment is subject to market risks which include global and regional risks. We will not be responsible for any Profit or loss that may occur due to any financial decision taken based on any data provided in this message.
Weekend Idea 1: HDFC Bank rising from the bottom, can blossom. HDFC Bank Ltd. is engaged in providing a range of banking and financial services including retail banking, wholesale banking and treasury operations. It is one of the top banks in the country. HDFC Bank Ltd CMP is 1532.10.
The Positive aspects of the company are Low debt, zero promoter pledge, FIIs increasing stake, MFs increasing stake, improving annual net profit, and Improving cash from operations annually.
Entry can be taken after closing above 1536. Targets in the stock will be 1605, 1641 and 1675. The long-term target in the stock will be 1719 and 1758. Stop loss in the stock should be maintained at Closing below 1400.
The above information is provided for educational purpose, analysis and paper trading only. Please don't treat this as a buy or sell recommendation for the stock. We do not guarantee any success in highly volatile market or otherwise. Stock market investment is subject to market risks which include global and regional risks. We will not be responsible for any Profit or loss that may occur due to any financial decision taken based on any data provided in this message.

Tata Motors on Weekly Chart Looking Good for Mid Term InvestmentAre you looking for a Breakout Stock? It's right here.
What - Tata Motors on Weekly Chart
Why - Just Broke Out of Resistance.
How - I used Fibonacci Retracement to spot Exact Levels.
What's your view on this? Please share.
Contact 8130724243 for Stock Market Courses from NSE Academy. We are affiliated with Empirical F&M Academy and NSE Academy.
Hope this post adds valuable insights to your trading/investment journey.
Don't forget to share with your friends. (*Bcz as your friends join you will have someone like-minded with whom you can share and discuss and bring clarity to your learning and life.*)
***
Disclaimer:
Please note that this is only for Study Purpose and not a recommendation.
So please do your own research before investing in market.
#BreakoutStock #TradingStrategies #StockMarket #Nifty #chartpatterns #indicators

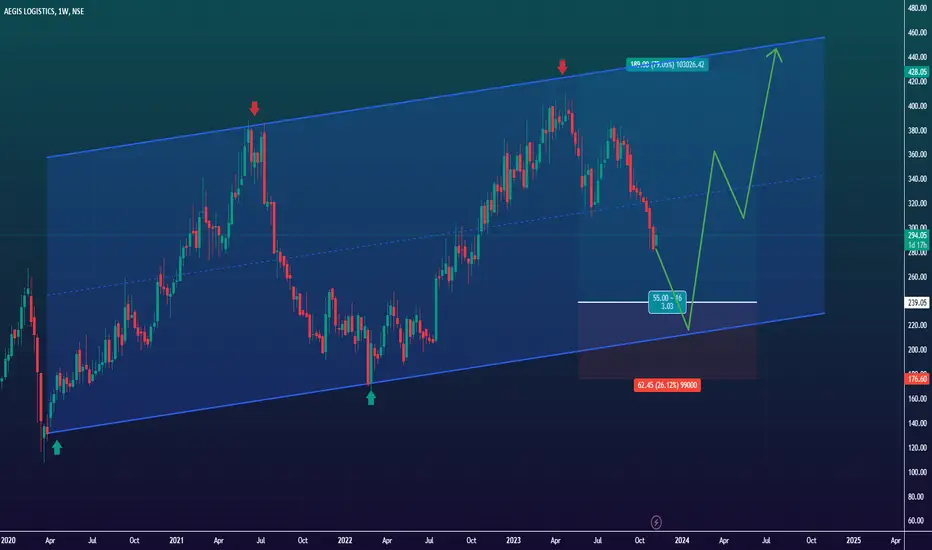
📈 AEGISCHEM: A Promising Investment OpportunityHello, traders!
Today, we're focusing on NSE:AEGISCHEM . Here's what's happening:
📈 Steady Upside Movement: AEGISCHEM is on a consistent upward trajectory, forming higher highs and showing signs of strength.
🔝 Breaking Previous Highs: It recently broke its previous high, which is a significant development.
🔍 Retest Opportunity: Currently, it's retracing and coming down to retest the support from the parallel channel, and I've marked a potential long position on the chart for your reference.
🚫 Not Guaranteed: However, keep in mind that trading is about high-probability entries, not guarantees. While this opportunity has great potential, always perform your due diligence.
🕰️ Investment Perspective: This isn't just a short-term trading play; it's an opportunity with investment potential. Take a closer look and consider your investment strategy.
📌 Important Note: This isn't a definitive investment recommendation. Make informed decisions and manage your risk appropriately.
🤔 Your Strategy: What's your take on AEGISCHEM? Are you considering it for your investment portfolio? Share your insights with us!
🚀 Stay Informed: Keep following for more trading and investment insights.
Best regards,
Alpha Trading Station 🌟
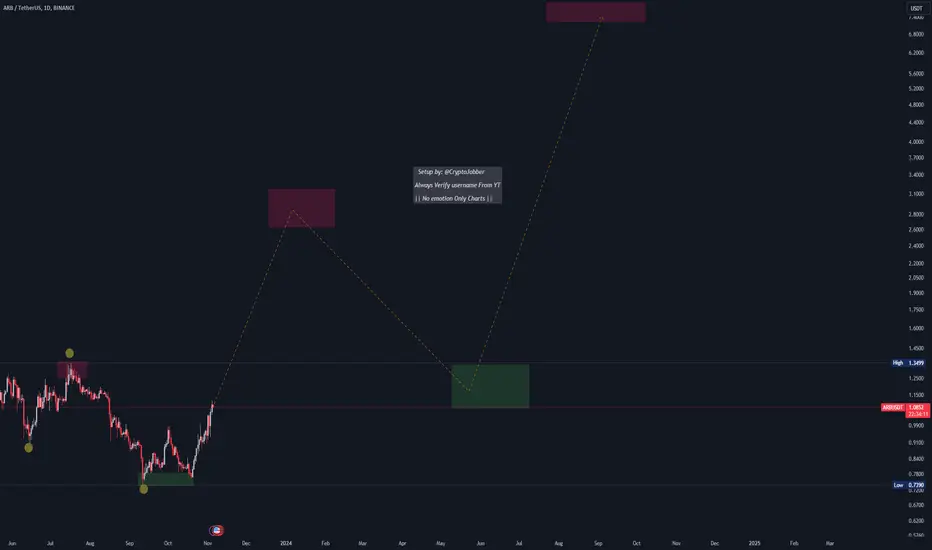
ARBITRUM Long term plan #NFAARB/USDT HTF or long TERM full plan based upon monthly & weekly time frame #NFA #DYOR
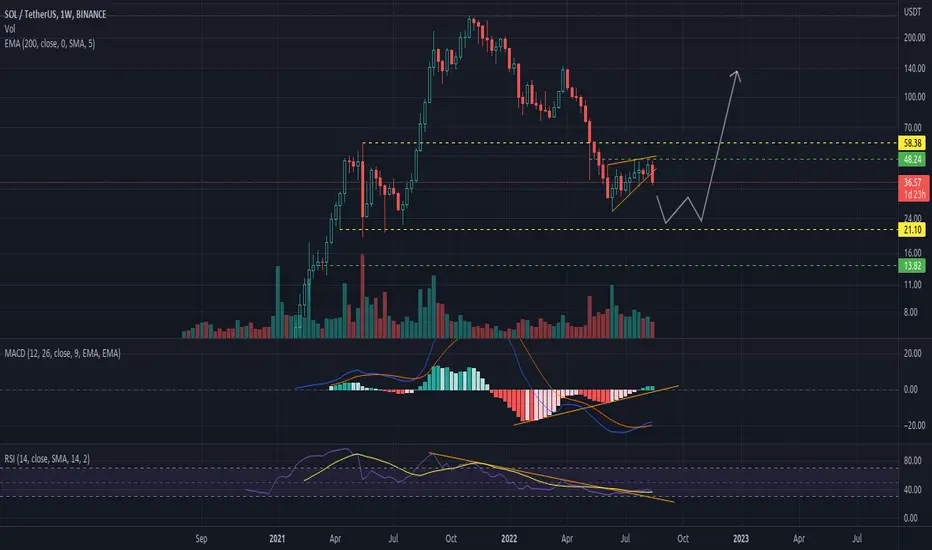
Ready to load some SOL on the coming monthsLooking for buying opportunities around $24 to $20. In case of a weekly close below $20 the price can drop to the next support at the $13,5 area. Very small chance to close below $12, in that case the bottom should be at $5 and i will go all in.
MACD shifting to the upside and RSI broke the diagonal resistance.
set alarms and DCA your way in.
HODL time: 3 to 12 months depending on where the bottom will form.
Why Bitcoin won't drop from hereHello Traders and Investors,
My name is Philip and I am a German swing-trader with over 4 years of trading experience.
I only trade the higher timeframes, preferably the monthly chart, because this allows me to capitalize on the major market swings.
I view trading as a long term game over the next 20 years which will help me to build massive wealth - it is not a get rich quick scheme.
-------------------------------------------------------------------
Today I want to share with you my outlook on Bitcoin:
In the beginning of 2023 Bitcoin perfectly retested the previous cycle high of 2018 and already perfectly rejected this key structure level towards the upside. Since we had a cross support at the $17.000 level, there is a very low chance of Bitcoin breaking below this level at all.
-------------------------------------------------------------------
Most of the people always follow the quick money. But the quick money is never the big money.
They think that making 5% a month consistently is reasonable, which is one of the reasons why so many traders fail.
The only think which you can control is your risk, everything else is unknown.
Keep your long term vision!

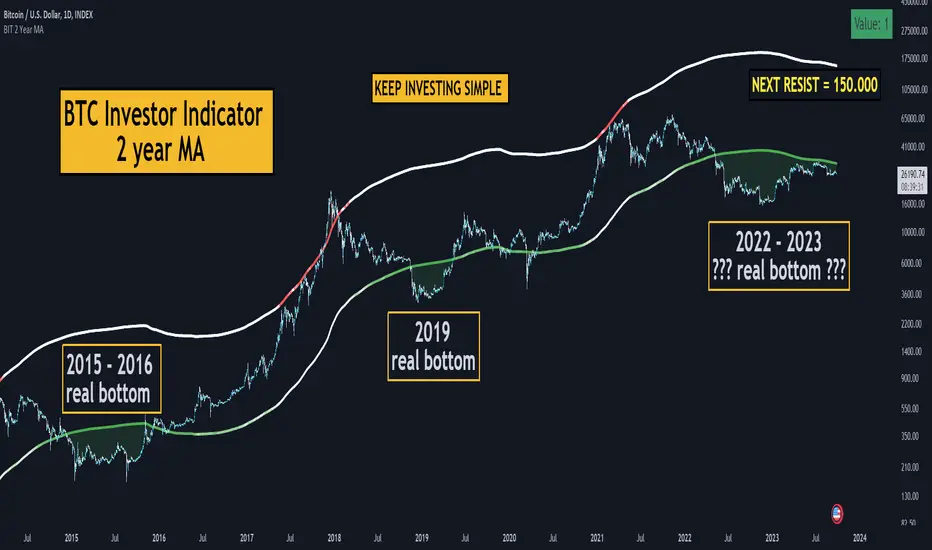
Nailing Market Bottoms with Precision! 🎯📉Cryptocurrency markets are notorious for their volatility, making it challenging to identify the perfect entry points, especially during bearish cycles. However, a game-changing tool has emerged, the Investor Tool BTC Indicator, renowned for its remarkable accuracy in pinpointing true market bottoms. In this post, we'll explore the incredible capabilities of this indicator and its astounding track record of never missing the mark. Its next target? A staggering $150,000 per Bitcoin!
Cracking the Code: Investor Tool BTC Indicator
The Investor Tool BTC Indicator is a cutting-edge tool designed to decipher market sentiment and identify optimal entry points.
What sets this indicator apart is its exceptional accuracy in recognizing the true bottom of a bearish cycle.
Unveiling the Power: How It Works
The Investor Tool BTC Indicator employs a complex algorithm that considers various market factors, sentiment analysis, and historical data.
Its unique methodology filters out market noise, providing crystal-clear signals during uncertain times.
The Unparalleled Track Record: Never Misses the Mark
Perhaps the most astonishing aspect of the Investor Tool BTC Indicator is its impeccable track record.
Historically, it has accurately identified market bottoms without fail, instilling confidence in traders and investors.
Setting Sights on the Future: $150,000 per Bitcoin!
With its uncanny ability to call market bottoms, the Investor Tool BTC Indicator has set its next target: a jaw-dropping $150,000 per Bitcoin.
Traders and investors are watching closely, eagerly anticipating this remarkable price milestone.
Leveraging the Indicator: A Game Plan
Timing: Keep a watchful eye on the indicator's signals and act swiftly when it identifies a market bottom.
Risk Management: Despite its accuracy, always employ sound risk management strategies to protect your investments.
Continuous Monitoring: Stay updated with the indicator's signals and be ready to adapt to changing market conditions.
In conclusion, the Investor Tool BTC Indicator has revolutionized the way we approach cryptocurrency trading by consistently identifying market bottoms with unparalleled precision. As it sets its sights on the ambitious target of $150,000 per Bitcoin, traders and investors are eager to capitalize on its next remarkable prediction. Remember to combine this tool with comprehensive analysis and prudent risk management for a well-rounded trading strategy. 🚀💰🚀
Apple #Apple stock is at 178.30-180.
In 2021 this price range - act as support
In my opinion it's a good deal to invest in #Apple right now, Christmas is coming, a lot of guys will buy new #iPhone15 and #iPhone15Pro
Pushing the price down from 197.07 to current price of 178 is a corrective action that will push the price higher as long as 171 -172 will act a serious support area
#stockmarkets #StocksToBuy #StocksInFocus #StockToWatch

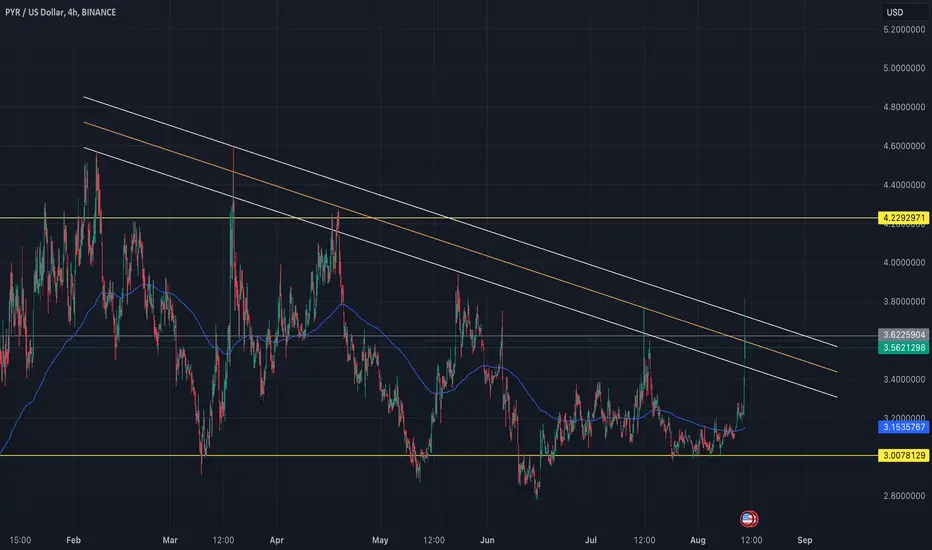
$PYR Range & ChannelBeen trading NASDAQ:PYR (Vulcan-Forged) around this channel and range for several months now. Just thought I'd share (hi poker)
As of right now, strictly looking at PA, looks like a deviation on the upper channel until proven otherwise.
I have been & will continue to accumulate a large spot bag over the next 4-6 months (avg. entry is around $3.05, looking to buy more <$3 later this year) with the goal of selling this above $50 sometime over the next 2 years.
As always, let's see.
SUBEX, 1DSubex has given good breakout on both long and short time frame.
Good base formation at 30-32 level. stock can move towards 39 and 40.
If it sustains can go further towards 50-60.
Volumes are building and something good can be announced soon.
Company has lot of sectors including AI, Blockchain, security, tele communiction.
One should visit company site to understand more about company dynamics
It is only for education purpose not a recommendation.

The EMA200 on BTC's Weekly TF: A Simple Yet Powerful IndicatorIn the fast-paced world of crypto trading, it's easy to get caught up in a web of complex charts and countless indicators. While there's value in detailed analysis, sometimes less is more. This is particularly true for long-term investors, who often benefit from a more streamlined approach. One such straightforward yet impactful tool is the EMA200 on Bitcoin's weekly chart.
Why Higher Timeframes Matter
For those who invest with a longer time horizon, higher timeframes offer a clearer, less noisy view of the market. While day traders dissect every minute movement, long-term investors are more interested in overarching trends. In this regard, the weekly chart serves as a reliable guide.
The Significance of EMA200
As of now, Bitcoin is nearing its EMA200 on the weekly chart for the first time since March. This is a key moment for a couple of reasons:
Bullish Outlook: If Bitcoin stays above the EMA200, we could be looking at another bullish rally, similar to what happened last June.
Bearish Outlook: On the flip side, if it falls below this line, we might be entering a bearish phase, much like the period from June 2022 to early 2023.
The Power of Simplicity
The EMA200 simplifies complex market dynamics into a single, easily understandable metric. While lower timeframes can be influenced by short-term volatility, indicators on higher timeframes like the weekly chart have a greater impact on long-term price trends.
Risk Management & Disclaimer
Navigating the volatile crypto market requires a disciplined approach to risk management. It's not just about capitalizing on opportunities, but also about preserving your investment during uncertain times.
Please note that these are my personal observations and not financial advice. Always do your own research and consult a financial advisor before making investment decisions. However, you might want to consider following me for more of my observations
Happy trading, and may the trend be with you!

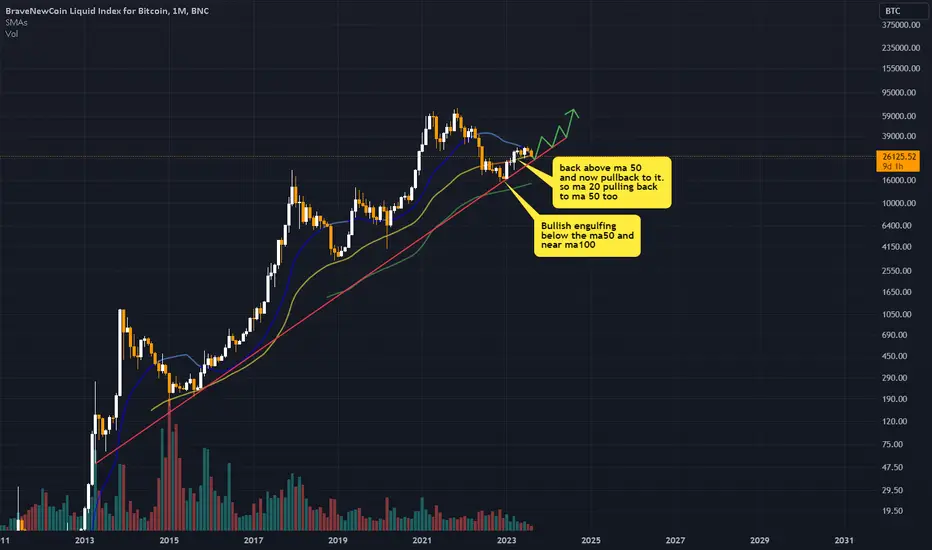
Bitcoin:Monthly chart ViewHi guys.
Hope you have had perfect trades.
In this idea i will share you some TA perspectives about
Bitcoin Longterm reactions according to historical datas.
As you can see each time the price reached the MA50 , made a
trough below it and then come back above.
Now we can se in Monthly chart that after price shaped
a Bottom under MA50 , it tries to come back above with a
Bullish Engulfing pattern.
after that we surpass MA50 with another white candle and now ,
Unfortunately we have some frauds in market.
(China Evergrande Group bankruptcy and Tesla sold
millions of BTC).
So in my opinion after a few weeks , Bitcoin start to continue
its smoothed run and go towards 36000.
its the level we will see at the end of 2023.
after that...
Lets see what will happen and dont predict far futures :)
If you like my opinion please tell me yours in comment.
Thank you all my friends
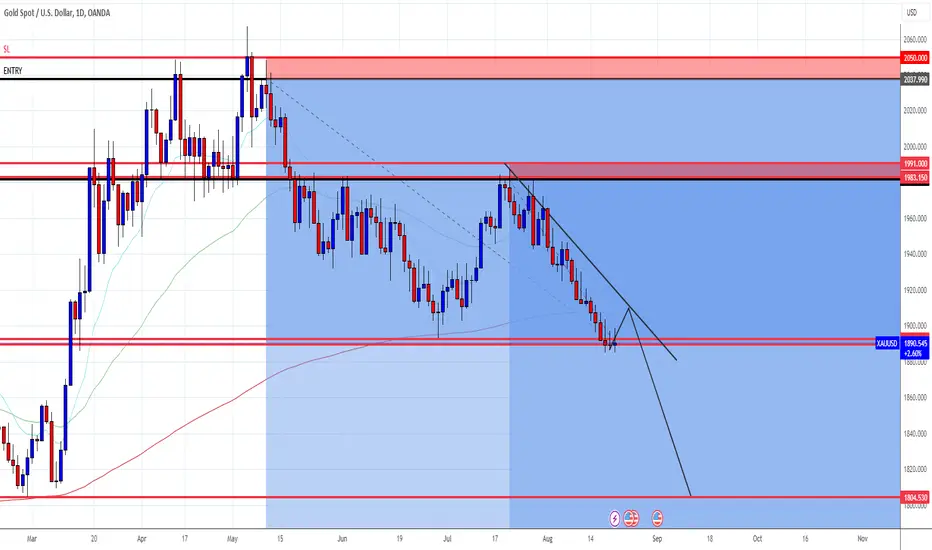
XAUUSD SHORTXAUUSD The Big Short is on the way expecting more down trend on gold thıs comıng week after a pullpack
INDIACEM buy for long term
NSE:INDIACEM for Long Term Buy above 193 , average till 188
Technical :
Entry Candle close above 193, average till 188
SL 180
T1 205
T2 223
T3 241
Trendline Breakout
RSI Bullish Divergence
Consolidated and created strong base

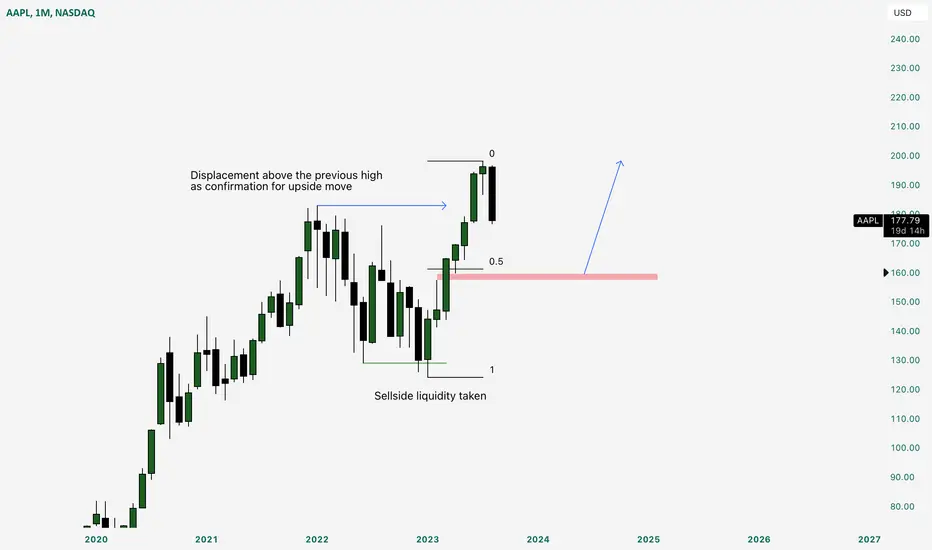
AAPL Longterm viewI’m looking for buying some shares at 160$,
as you can see, sellside liquidity was taken, which is my first confirmation, my second confirmation is displacement above the previous, i would like to see it retrace to 160$ or lower, which sits below 0.5 fib AKA discount zone, anything there is buying zone for me.
This is purely technical analysis, since i believe in this stock.
Indian Railway Finance CorporationCompany is a funding arm of the Indian Railways for mobilizing funds from domestic and overseas Capital Markets. IRFC is a Mini
Ratna I and Schedule A Public Sector Enterprise under the admin control of Ministry of Railways, Govt. of India.
Clientele: Company extends loans to other entities of MoR, viz., Rail Vikas Nigam Ltd and IRCON International Limited.
We should take a little quantity at very decent dip. But RSI indicating stock trading in over bought zone so we should wait to take fresh entry till cool of the stock. It is my point of view according my analysis it is not any recommendation so be safe and do your study before the investing.
#longterm #Fundamental #technical #Penny stock #PSU
