Loom

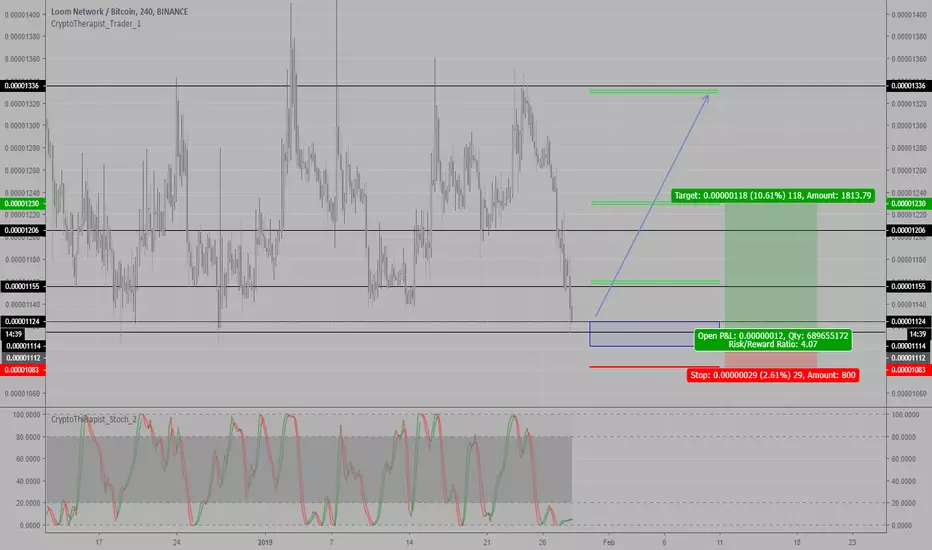
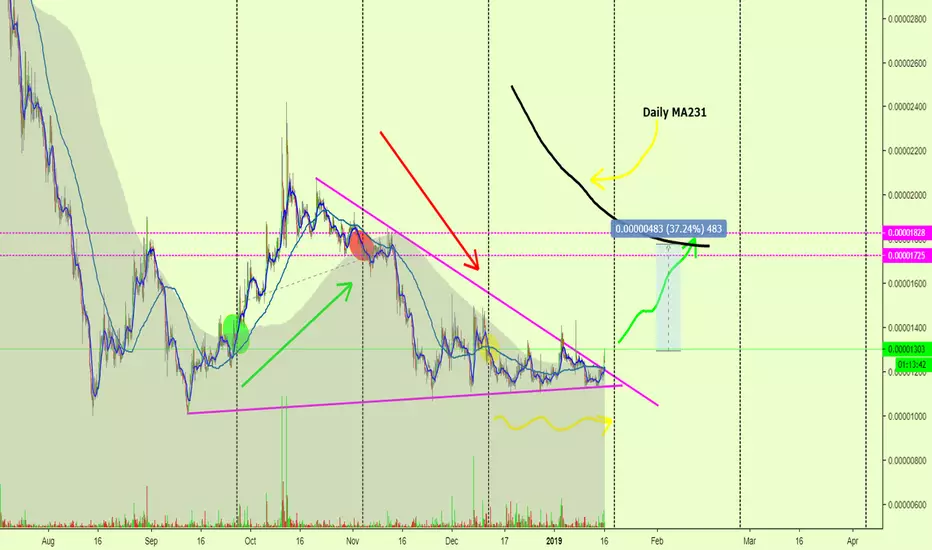
LOOM potential bounce off support zonePretty big range for LOOM on the daily, I will sell a decent amount in the first profit target if it goes there.
Stop and PT are in the chart


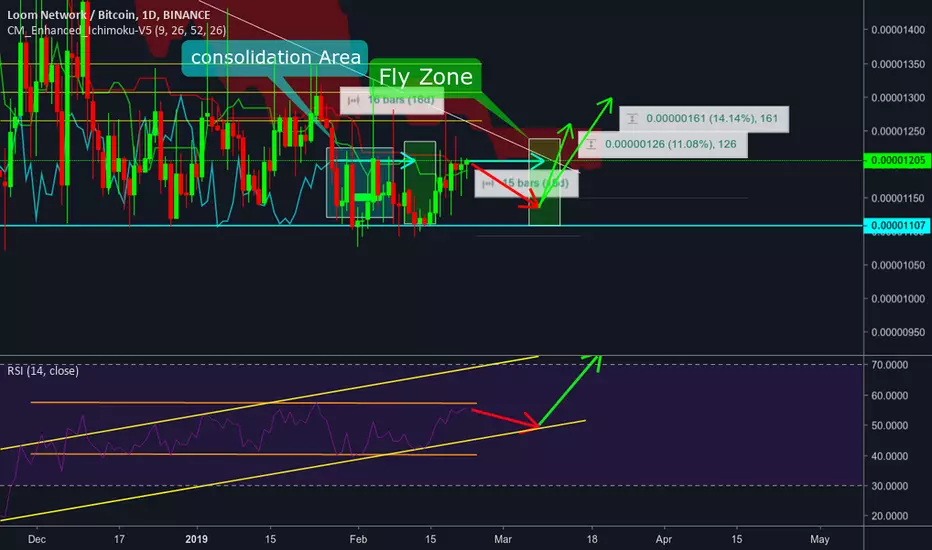
LOOM Network BreaksUp with a Full Green CandleLOOM Network (LOOMBTC) has generated good profits for us several times and it is showing signals of more.
- We have a full green bullish candle.
- And a bullish RSI.
- It has been creating higher lows since its low point on Mid August 2018.
- Expect additional bullish action from this altcoin.
Recent LOOMBTC trade:
Namaste.

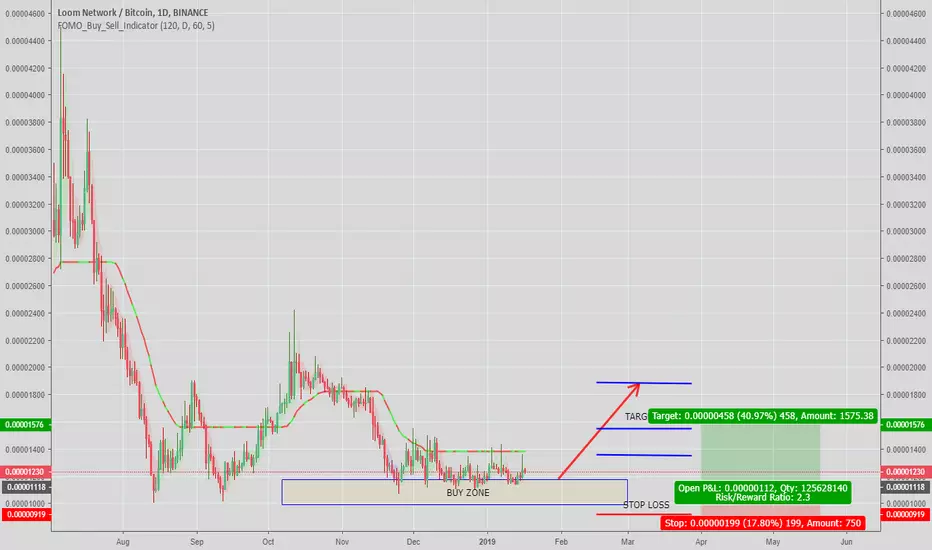
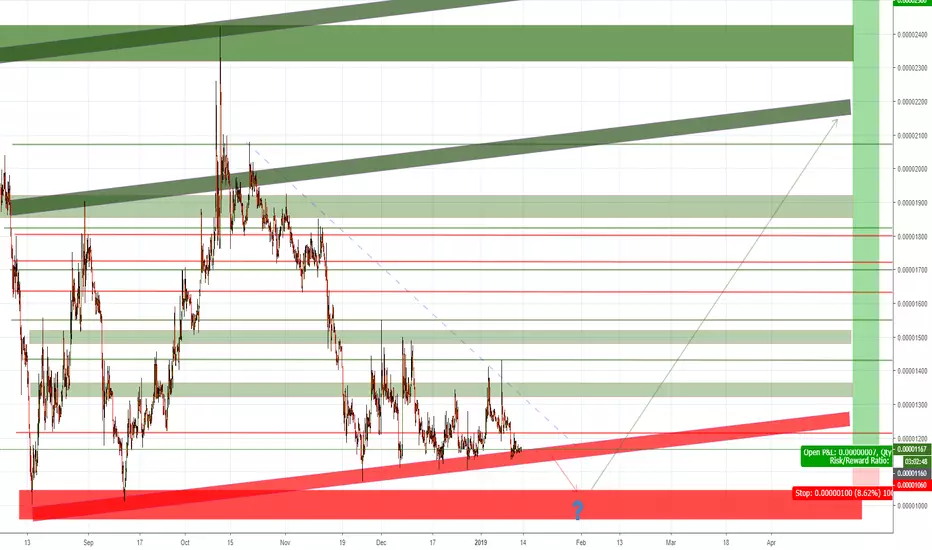
LOOM-BTC Long Trade Plan[bLOOM NETWORK LONG TRADE
Chart is self-explanatory, I think.
Greens - Targets
Blue - Buy Zone
Red - Stop Loss
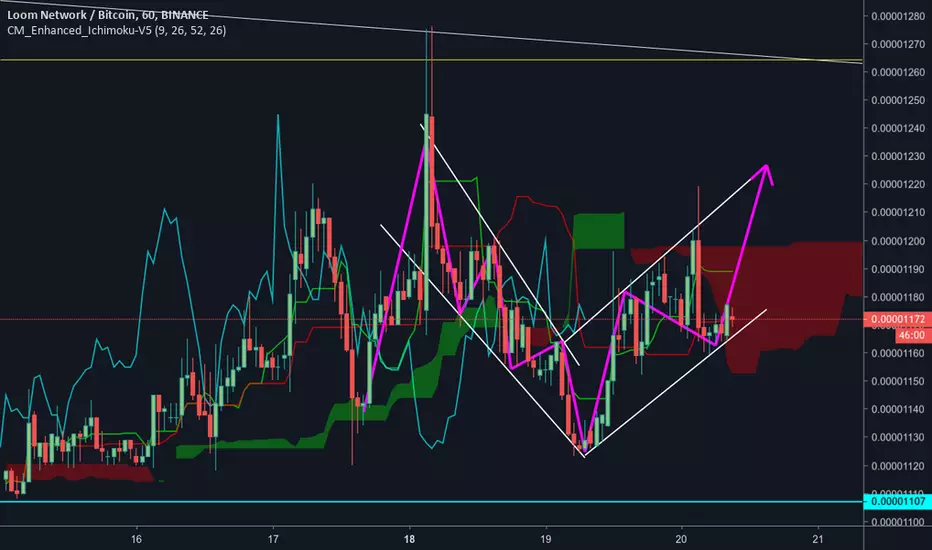
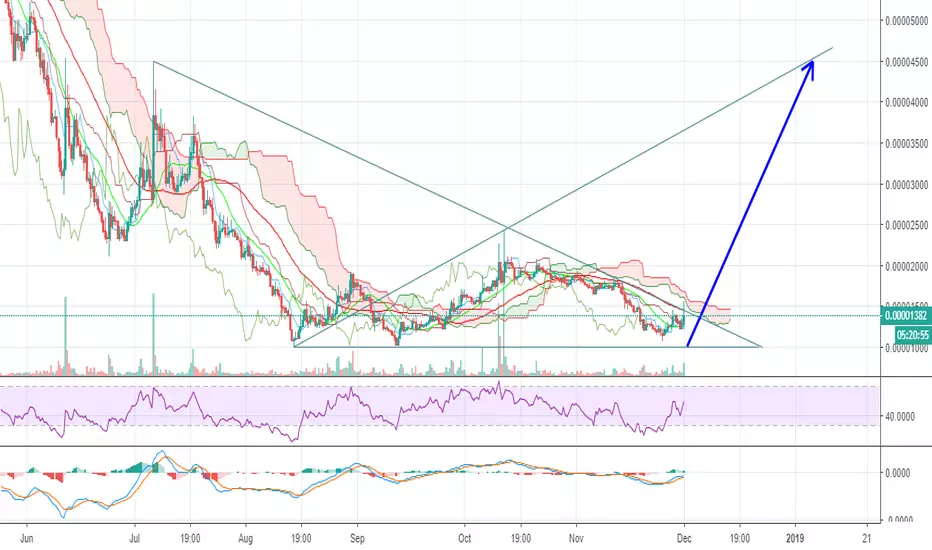
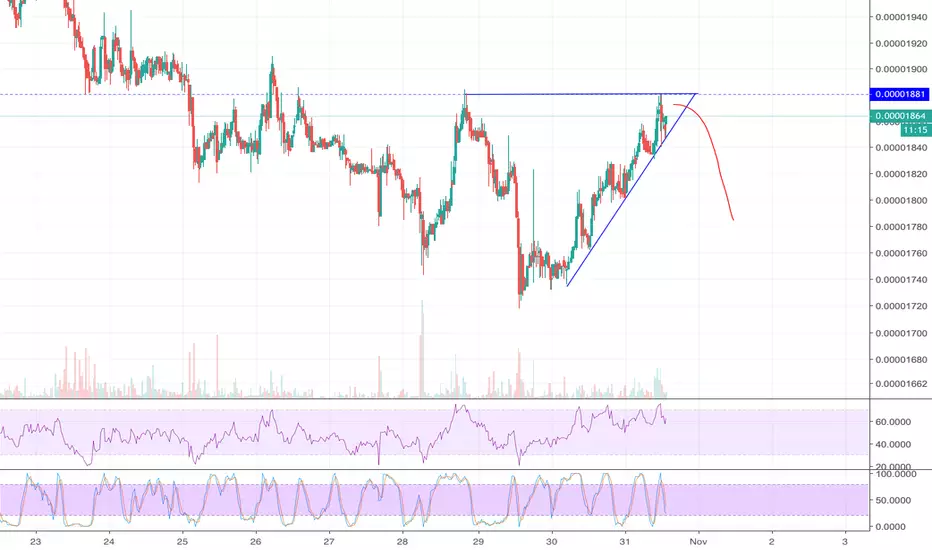
Setup Moon.. Ops, Loom*That seems quite interesting to me.
Loom is forming an upward triangle, has already broken the ichimoku cloud H4, RSI is indicating high and the volume is increasing in recent days. There may still be a new twist on the hypotenuse of the triangle, but it depends on the BTC.
I would say that these are strong signals that a high pump is coming. The first target is the top of the ascending triangle. Remember to take partial take profits on each target!
See ya

LOOMBTC ENTRY AND EXITENTRY AT GREEN REGION
1ST TARGET AND EXIT POSITION AT ORANGE REGION
STOP LOSS BELOW GREEN REGION
BIG POTENTIAL FOR LOOMBTC

LOOM-BTC Trade SetupMid-Long Term Trade
-> Accumulate in the given Buy Zone
-> TPs at the Blue Lines
-> SL at the red line
LOOMBTC TRADE EXPERTS CHANNEL LOOM BINANCE
BUY : 1030 - 1170
TARGET 1 : 1325
TARGET 2 : 1490
TARGET 3 : 1850
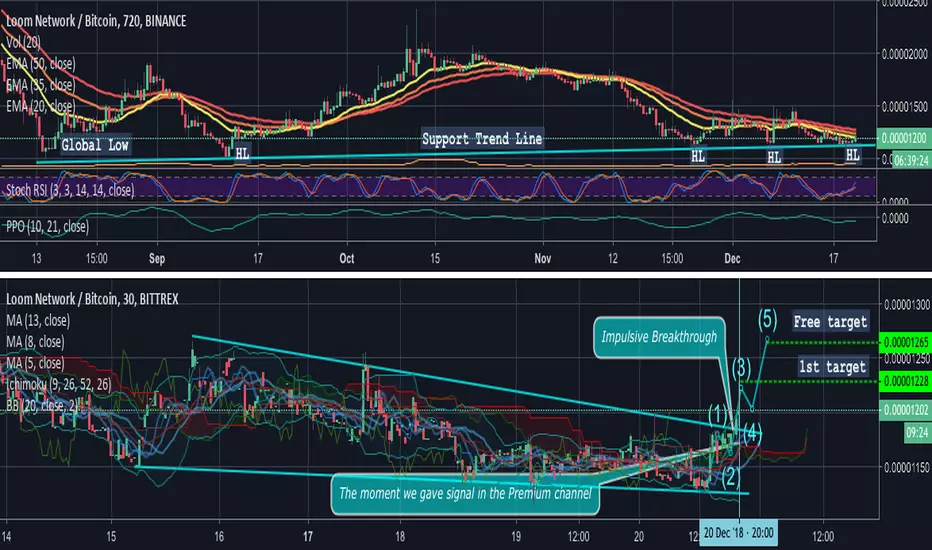
LOOMBTC Impulsive breakthroughThere are two charts in the analysis. Upper graph represents long term support trend line. We can see that the price crawled to it again and accurately touched. It bounced from it 4 times before and did it again.
At the lower chart the current situation is described. Indicators are neutral-bullish, while the price made an impulsive breakthrough.
We made this signal and published it in the premium just a 5-10 minutes before the price reached 1st target from the mentioned buy zone. It is a pretty accurate and quick hit. Enjoy free target and always follow the risk aversion strategy. Stay tuned
Sincerely,
SkyRock Signals team

Daily Bullish Signal $LOOM #LOOM LOOM/BTC (01 Dec)BLUE ARROW indicates the EXPECTED Time and Targets
Level Stoploss point up gradually to maximize profit and reduce risk
Loom - 158 sats targetLooks like a brief bounce before we see a sharp and possibly final scary drop to 158 sats zone.

[31% PP][LOOMBTC] Loom Network Trade Signal by @alanmastersLoom Network is moving now, we have several signals that points to a possible move up.
Here is a quick trade to profit from these move...
LOOMBTC Trade Signal by Alan Masters
BUY: 0.0000133
TARGET:
(2) 0.0000145
(3) 0.0000175
STOP: Close daily candle below 0.000012.
If you enjoyed this trade, hit the LIKE icon to show your support.
Namaste.

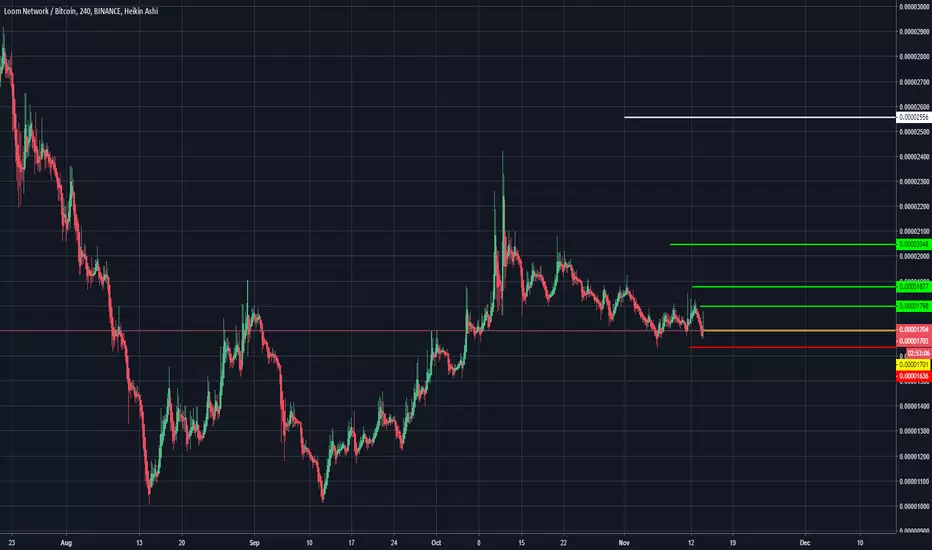
LOOM Trading AdviceBuy Price: Yellow Line
TP: Green Lines
Moon: White Line
Support: Blue Line
SL: Red Line
Invest Suggestion: 5-10 Percent
Profit Expectations: 5, 10 or >20 Percent
Just hold and watch. Sell while you get some profit. Good Luck!
Looks Good? Leave a like, share and tell me in comments if my trading advices are working for you.
Thanks for visiting.
[LOOMBTC] Rising wedge - shortForming a rising wedge = bearish in short term = will break down a bit

[LOOMBTC] Rising wedge - short on 15 minForming a rising wedge = bearish in short term = will break down a bit

$LOOM Experiencing a Steady Gains. My Idea on It's Chart:It feels good that Loom already touch my first target, you can check it here:
Right now we have a strong support t 1758 level, it will be good if you guys can scoop at that level. By the way, we need to be careful because loom probably will entering an overbought zone soon. We need to chill down a bit to lowering RSI. chill down can happen in two ways:
1. Price on a stable range but need more days
2. Price down and we need less days.
With this fundamental that loom have that I already explain on my charts before, i think the possibility of number one is bigger than two so i think we will soon moon again.
My closest target is 2210 again as it already touched two times and now will about to re-test again. Let's see if we break then i will re-assess and having to look at my second target @ 2785.
