COTI 1D Chart - 30%+ drop possibleCOTI on a 1D chart is looking like it is moving within an upward channel and we may be ready to see the price drop to get to the bottom of the channel. The price may have a 30%+ drop (assuming it gets to the 0.382 fib level) before moving upwards in the channel. Keep an eye on the RSI as well.
What are your opinions on this? Comment below, hit the like and follow me. Thank you!
Check out more below for recent Altcoin, Bitcoin and Stock Ideas.
Disclosure: This is just my opinion and not any type of financial advice. I enjoy charting and discussing technical analysis . Don't trade based on my advice. Do your own research! #cryptopickk #bitcoin #altcoins
Lowerhigh

ELON/USDT. Update 11.24.21 From my previous post, you can see we how had a breakthrough; however, is not what we expected, we wanted a bullish breakthrough but did not happen. INSTEAD, Dogelon created a Higher Low, we had a Low already created back on Nov 4th 2021. If you look at my chart on the daily you can clearly see the High and Low of Dogelon, we have extended our triangle. I'm taking advantage of all the lows to add more to my position and stack a nice amount for the break and take profit partially and let the rest run once the breakthrough happens. At this point we just need to wait and see how the market behaves for the remaining of the days. IF everything goes according to how we see (although never happens and our job is to adapt to the market) the chart, the next possible breakthrough might be around "December 2nd" Like I stated earlier, market is unpredictable therefore all we have to do is adapt when it happens, all we can do is follow and execute the opportunities given to us. -NOT A FINANCIAL ADVISOR, THIS IS ONLY FOR ENTERTAINMENT PURPOSE. TRADE AT YOUR OWN RISK.

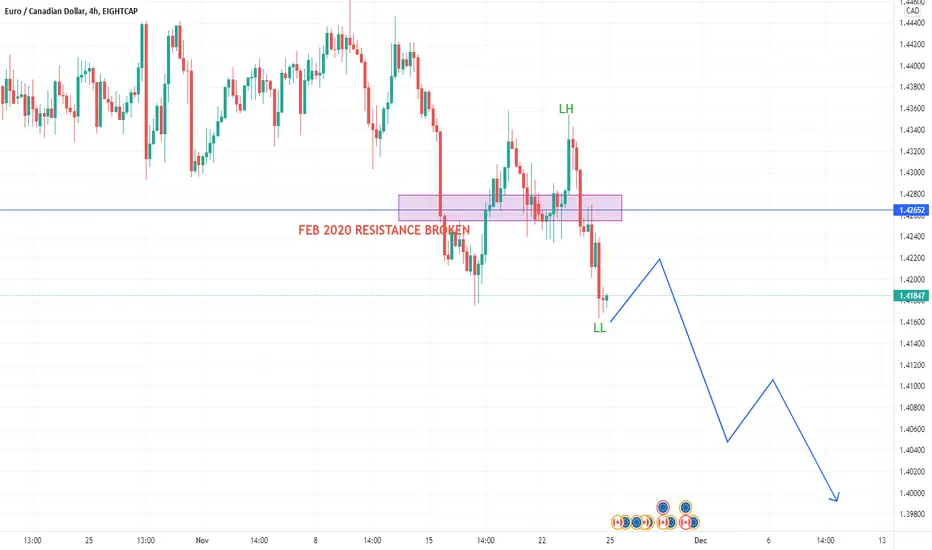
EURCAD LOOKING FOR DOWN TRENDSEUR/CAD has recently broken historical (2020) resistance and is showing uncertainty in price movement. If a downtrend can be established with further LH/LL, this may provide opportunity for a number of short positions in the coming weeks. Weekly chart shows an established downtrend.
I am looking for another wave to show some certainty in price direction and then looking for short positions after pullbacks.
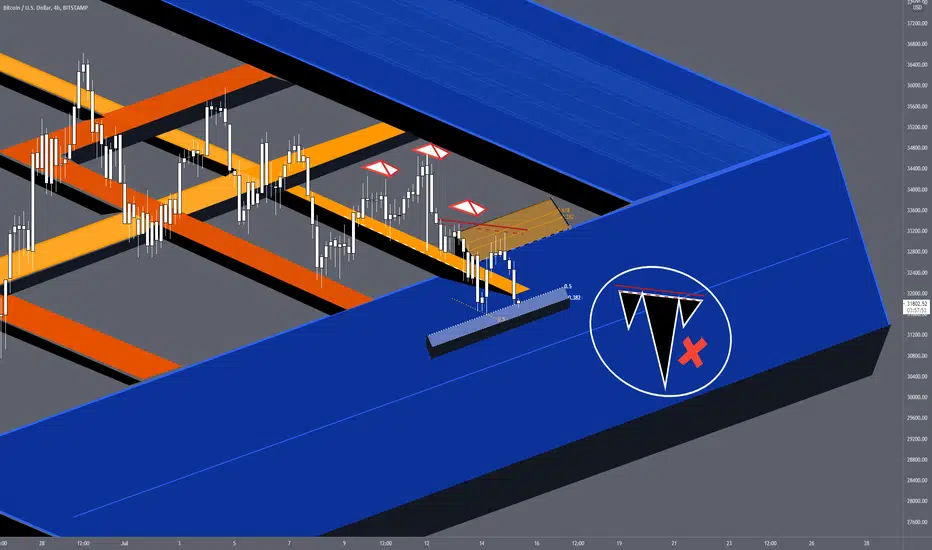
BTC - Lower High in 3DThe 8h weekend wick off the back-test of the Diamond Reversal Pattern 100% Break Target has resulted in a 8h Lower High. The next test is the low of the move; watching for a 8h Higher Low Pattern to emerge. In the wake of the Diamond patience is important, as the downtrend is forming.
How To Trade The Symmetrical Triangle (Higher Lows, Lower Highs)Lower Highs are represented by the diagonal trend line. These lower highs are the resistance line.
Higher Lows are represented by the diagonal trend line. These higher lows are the support line.
Breakout Candlestick
Retest Candlestick
How To Trade The Triangle Chart Pattern
First, Look For An Up Trend
Second, Draw Diagonal Support Line and then draw Diagonal Resistance Line. These lines are your levels.
Third, Wait For The Breakout Candle. Enter after the candle closes.
Fourth, Wait For A Candlestick To Retest Diagonal Trend Line. Enter after the retest candlestick closes.
Fifth, Set Target Using Height of Pattern
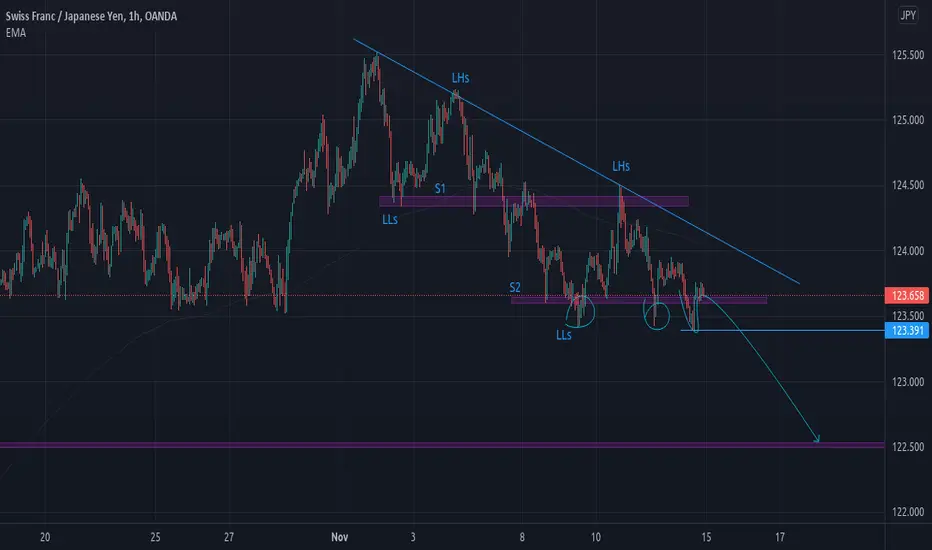
LLs and LHs identified on CHFJPY, chart looks BEARISH.Overall move on the daily seems to be approaching SUPPORT AREA, it's no doubt we are looking at LLs and LHs, price has retested S2 and currently a consolidation happening on S2, a successful break below 123.391 gives a potential SELL OFF. move is 89 Pips.
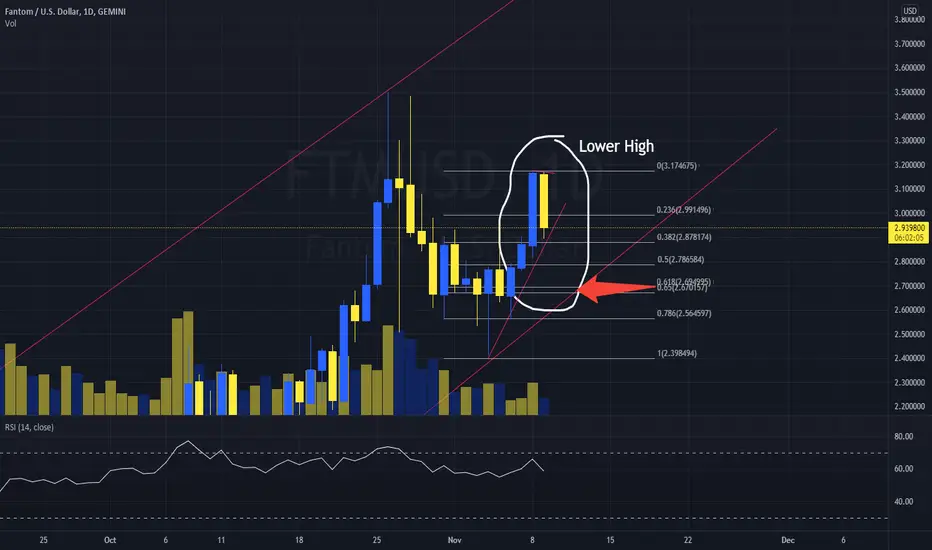
#FTM Fantom Lower High on DailyFantom (FTM) on the 1D chart shows a lower high. I charted a few trendlines to consider keeping an eye on along with a fib retracement.
What are your thoughts? Comment below, hit the like and follow me. Thank you!
Disclosure: This is just my opinion and not any type of financial advice. I enjoy charting and discussing technical analysis . Don't trade based on my advice. Do your own research! #cryptopickk #bitcoin #altcoins
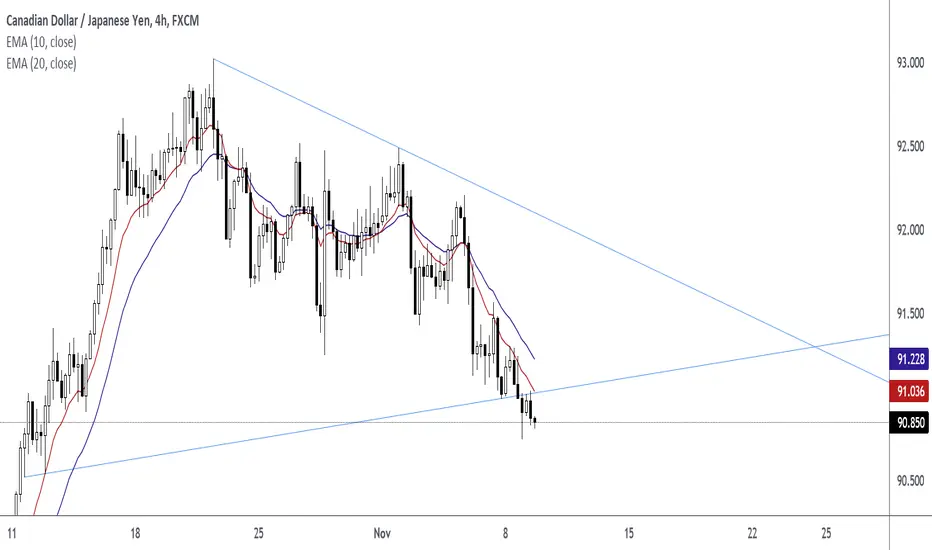
Right Now, Yen Pairs Are BearishSee the charts below in how I entered on a retest of the diagonal trend line. In this process, I am trailing my stop loss.
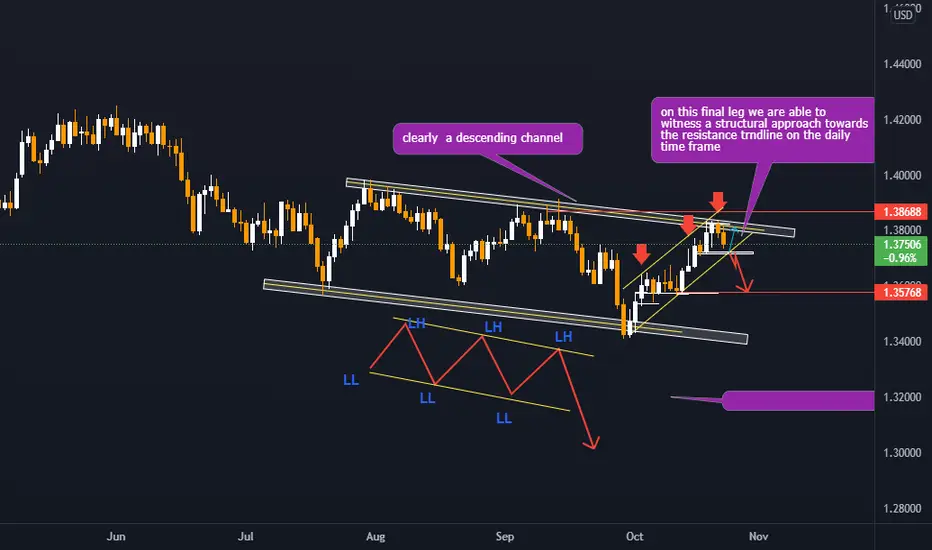
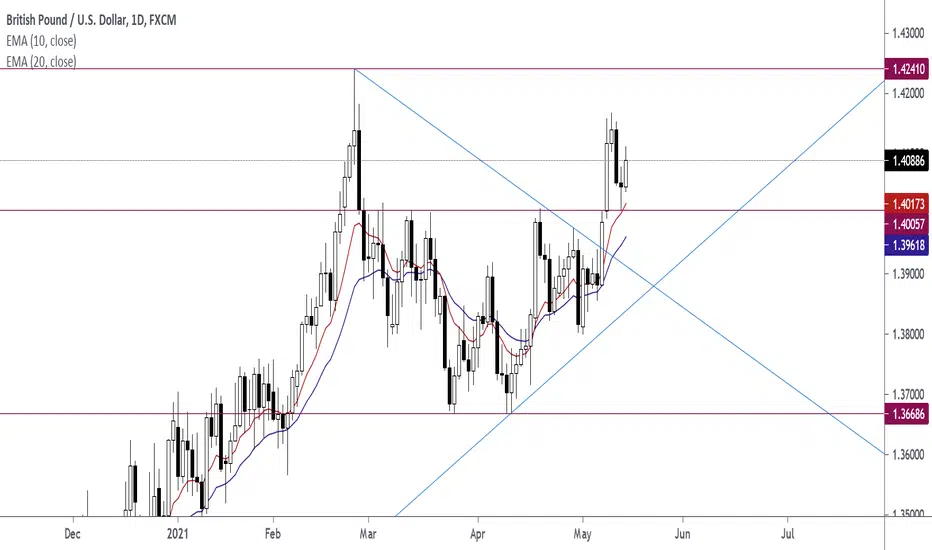
GBPUSD ... CRYSTAL CLEAR Clearly we can see the market is offering a descending pattern , as guided by the resistance trendline and the support trendline .
we can depict the sentiment of lower low and lower highs as offered by the price action .
be keen to check my into details (lower time frame 4hrs on my thread )
S and P (SPX) : lower lows formingLooking to get over bearish momentum since early September. sell lower highs.

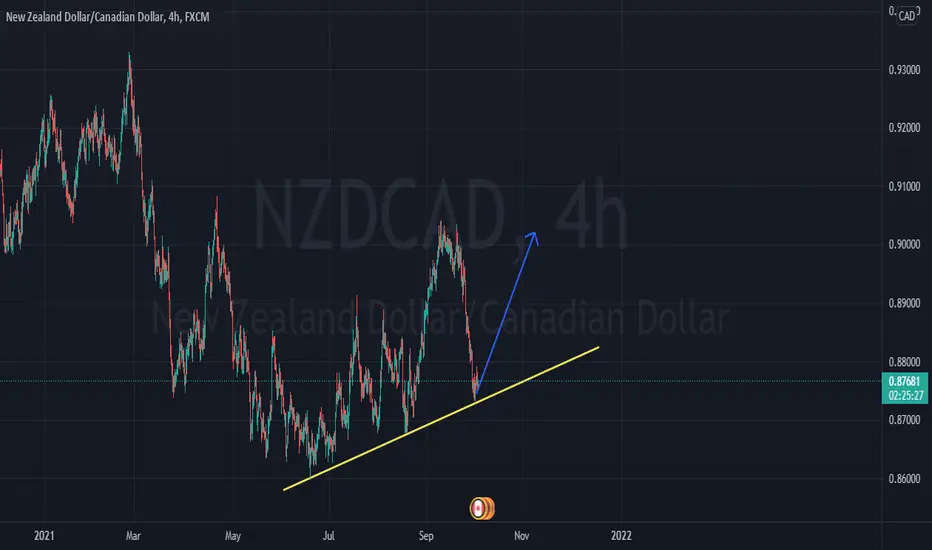
NZDCAD LONG IDEAHey guys, This pair previously formed a double top and was bearish till it got to that lower trendline which shows lower highs forming.
I'm bullish on this pair. Incase it breaks that lower trendline, my bias will change.
Happy trading
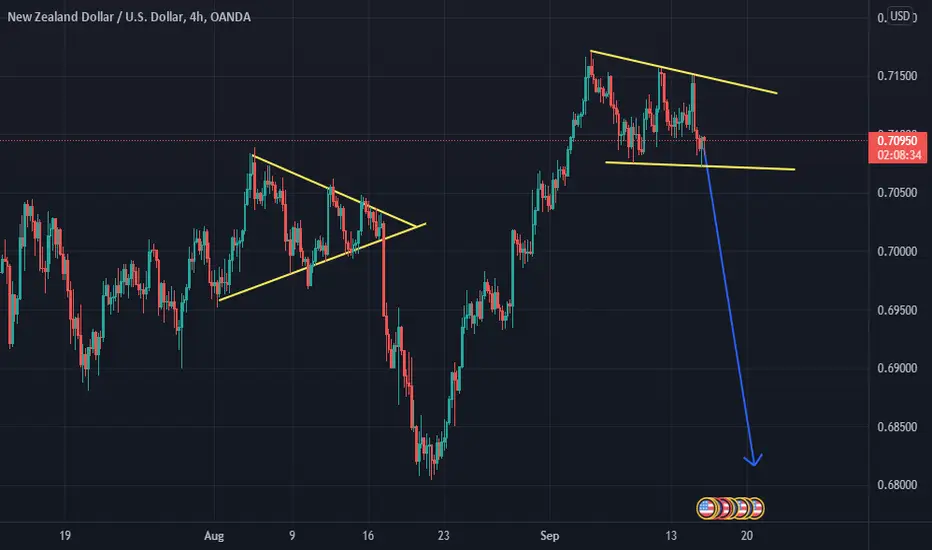
NZDUSD BEARISH IDEANzdusd seems to be on a bearish move. On the h4 time frame, it failed to break that resistance and it has been forming lower highs. i'm shorting this pair my target being the previous low around the 0.68324 zone
Bearishly Breaking Below The Neckline of A Lower High Double TopADA is Bearishly breaking below some serious support right now and looks as if it could make some major Fibonacci retraces.
The RSI and MACD are also both bearishly diverging.
It may reverse at the 50 percent retrace but if you want to take this trade to the extreme you could try to hold short until it reaches the .786-886 fib zones to take profit.

AUDUSD SHORTAfter moving from consecutive higher highs and higher lowers, we have a lower low and a lower high. The lower high flipped just about the 61.8% fib level, and then we see the formation of a Head and Shoulder pattern, While waiting for price to break and retest the neckline, we also expect it to gross below the 52 period SMA for us to enter into the short.
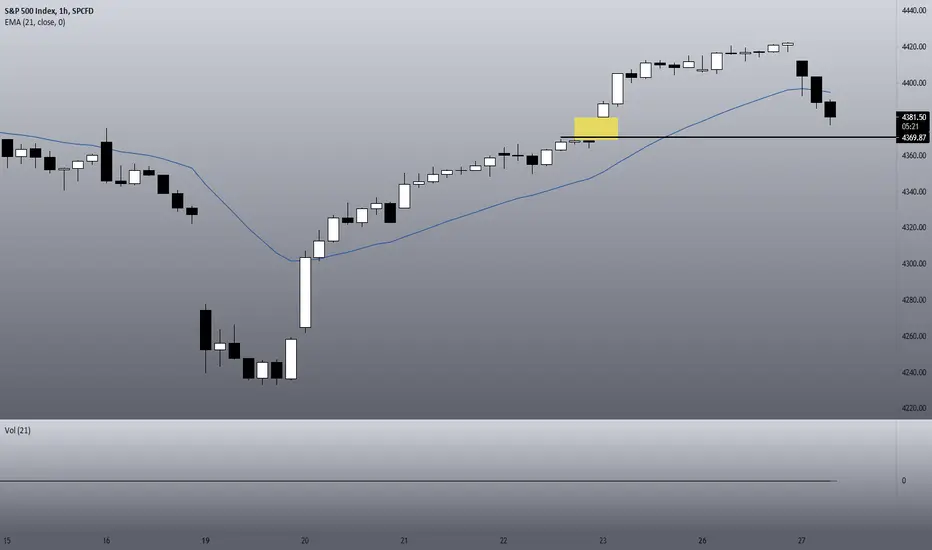
SPX: We are crashing! Time to panic?Hello traders and investors! Let’s see how the SPX is doing today!
Yes, we have a systemic crash in the US, but we’ve seen worse. This crash seems to be related to US tech stocks and China only, as European markets are still quite resilient, especially FTSE (UK) and DAX (GER), which are leaving huge shadows under today’s candlesticks.
As we discussed in my recent video, the SPX has no reversal signs , and even now, we lack bearish structure. We must see lower highs/lows in the 1h chart before assuming we’ll correct more.
We have a support at the gap (black line, 4,369), and the index is seeking this point, for now. Remember: A crash is just a pullback, and it doesn't mean we are in a bear trend.
However, I agree that the daily chart looks bearish already.
The market might understand today’s movement as a false breakout from the previous top level, and we are heading to the next support at the 21 ema. If the crash is strong enough, we can retest the support around the 4,289 again.
I find it hard to believe we would retest the purple trendline in the daily chart without a stronger bearish structure in the 1h chart. We can hit there, but we must see a clear reversal in smaller time-frames.
Only time will tell if this is just a crash or the beginning of a bearish reversal. If it is a crash, then fine, it’ll be just an opportunity to buy, like it has been since April 2020. If it is the beginning of a reversal, then we must wait for more patterns to confirm our theory.
If you liked this analysis, remember to follow me to keep in touch with my daily updates, and support this idea if it helped you!
Thank you very much!
BTC - Rejected iH&S necklineVolume pushed priced down setting a Lower High as the inverse failed to break. Support at the X-axis wedge Channel .5. A break to a Lower Low on watch.

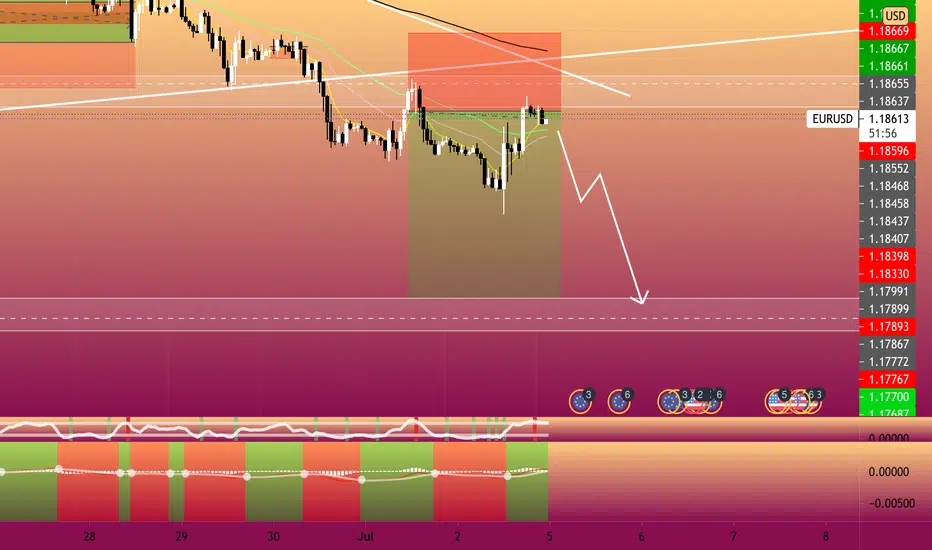
Eurusd sellThis is the second best time to enter for the sell. We had a second beautiful retest of structure. Everything is indicating there will be momentum downwards. It made a lower high and we are on course to go down. It is overbought in most timelines and we should see it hit support before it moves elsewhere.
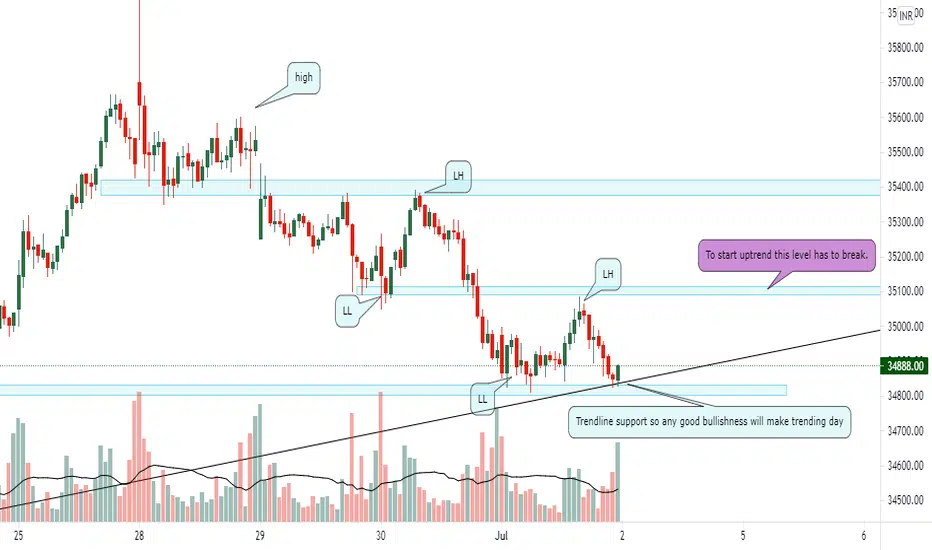
Bank Nifty at trendline supportBank nifty is in downtrend but there is really good support of trendline which can lead to good bullish movement in market tomorrow. But we should not go long until the previous lower high is broken.
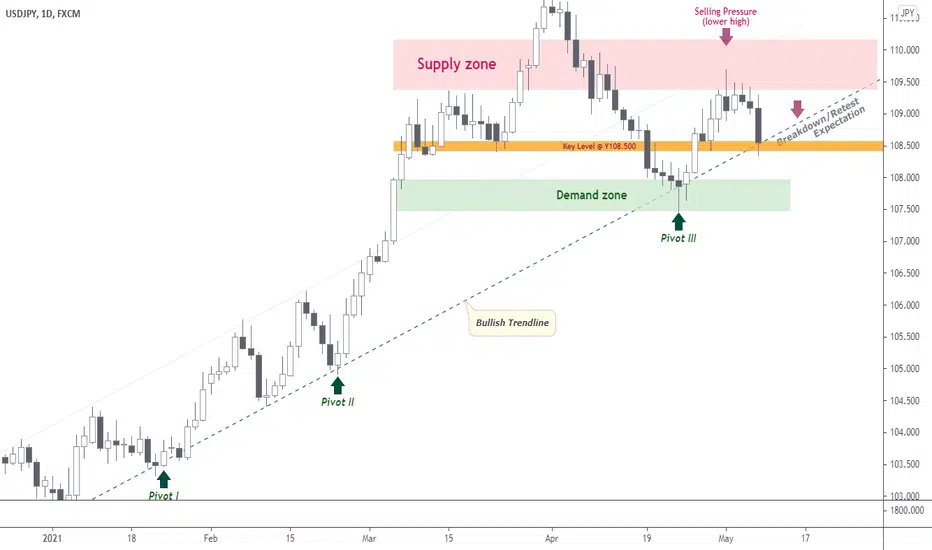
USDJPY | Perspective for the new week | Follow-upWith an astronomical 500pips run in our direction since my last speculation (see link here below for reference purposes); It appears the character displayed by price action lately has found a safe haven for Supplication @ Y109.500 area thereby welcoming a Selling bias for me in the coming week(s).
At this point in a very Bullish trend, the market is looking as if it is trying to figure out where to go next as the thrust from Pivot III did not have enough momentum to find a new high and considering the sharp rejection of the Y109.500 area during last week trading session; it appears that the Greenback risk a further decline. Can inflation rescue the dollar? Let's see!
Tendency: Downtrend ( Bearish )
Structure: Supply & Demand | Trendline | Reversal pattern
Observation: i. The Bullish run that began late January 2021 which is characterized by series of higher swing highs and higher lows appears to have found a peak @ Y111.000 after what looks like a setup transitioning into a downtrend after hitting a brick @ Y109.500 level.
ii. The present structure has a high tendency of changing to a series of lower highs and lower lows in the coming week(s) as I anticipate a Breakdown of the Bullish trendline in the nearest future.
iii. I will like to call our attention to the Supply zone @ Y109.300/110.000 area; This level was a very strong Sell window before the Breakout on the 30th of Mar 2021 followed by a Breakdown on the 7th of April 2021 and since this day we have witnessed price trading under this level throughout the month of April 2021.
iv. With my Key level holding @ Y108.500, I shall be looking forward to taking advantage of a decline below the key level this week.
v.This been said, there is an opportunity to add a position to your existing trade when price does a further breakdown/retest of Demand level @ Y107.500.
vi. CAUTION: On the contrary; it could be a rally (bullish) continuation when price breaks above Supply zone and retest to find new demand level at this juncture... Trade consciously!:)
Trading plan: SELL confirmation with a minimum potential profit of 300 pips.
Risk/Reward : 1:5
Potential Duration: 10 to 20days
NB: This speculation might be considered to make individual decisions on the lower timeframe.
Watch this space for updates as price action is been monitored.
Risk Disclaimer:
Margin trading in the foreign exchange market (including foreign exchange trading, CFDs, etc.) has a high risk and is not suitable for all investors. The content of this speculation (including all data) is organized and published by me for the sole purpose of education and assistance in making independent investment decisions. All information herein is for your reference only and I take no responsibility.
You are hereby advised to carefully consider your investment experience, financial situation, investment objective, risk tolerance level, and consult your independent financial adviser as to the suitability of your situation prior to making any investment.
I do not guarantee its accuracy and is not liable for any loss or damage which may result directly or indirectly from such content or the receipt of any instruction or notification therewith.
Past performance is not necessarily indicative of future results.
BTCUSD Lower Highs and Exponential Moving AverageWatch how price pull backs to the exponential moving averages. If price pulls back and forms a pin bar with a long-tail wick, then enter a short position.

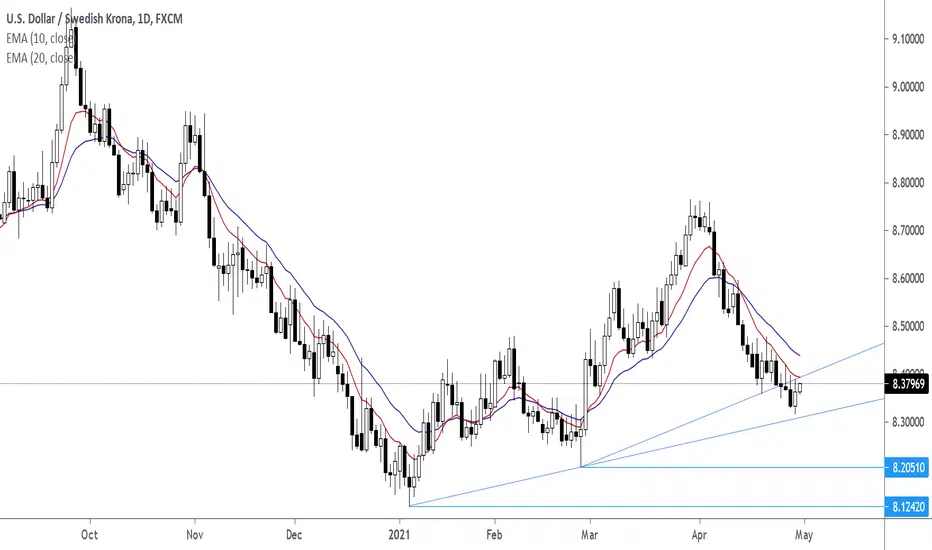
USDSEK Lower Highs On The Daily Chart, Weekly Chart, H4 ChartLower Highs are pushing into trend line support. Wait for confirming price action signal like a pin bar for an entry. Lower Highs are present on the Daily, Weekly Chart, and H4 Chart.
EMA 10 EMA 20 are pointing downwards on the time frames mentioned.