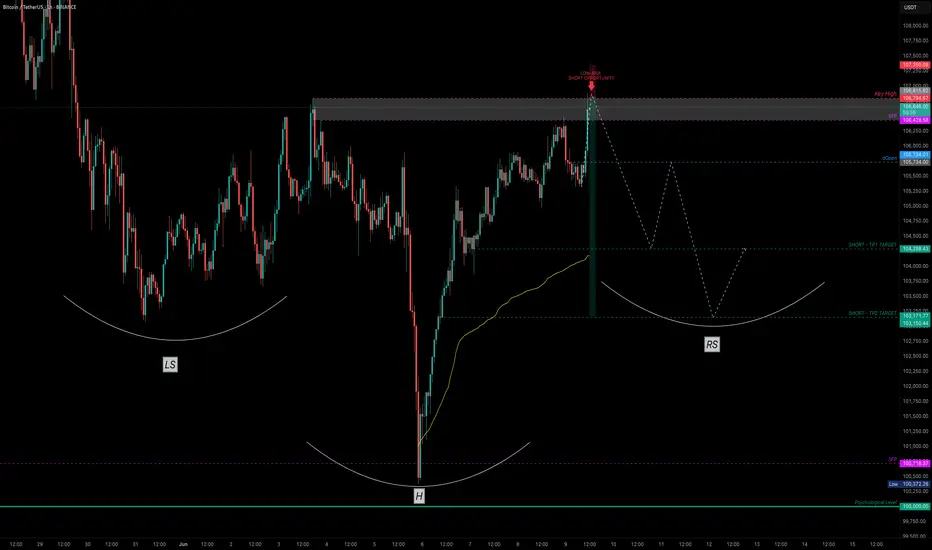
Bitcoin — Breakout or Bull Trap? SFP Setup ExplainedAfter a clean drop that nearly tagged the psychological $100K level, Bitcoin printed a Swing Failure Pattern (SFP) — sweeping the lows and snapping back with strength. That bounce wasn’t just a reaction — it was a liquidity reclaim.
Now, price structure is shaping into a potential Inverted Head & Shoulders — a classic reversal pattern often forming before a bullish continuation.
🔍 Key Level to Watch:
$106,694.63 — This recent key high was just taken out. If we see rejection here (SFP), it could set up a high-probability low-risk short opportunity.
🎯 Short Trade Idea (Only on SFP confirmation):
Entry: After price sweeps $106,694.63 and shows rejection
Stop-Loss: Above wick high (e.g., ~$107.4K)
TP Zones: $103.5K and $101.7K
R:R: ~1:7
✅ Cleaner setup with confluence from structure and liquidity — high probability if confirmed.
📚 Educational Insight: Why SFPs Work So Well
SFPs (Swing Failure Patterns) are some of the most powerful setups in trading because they:
Trap breakout traders
Sweep liquidity and reverse quickly
Offer clear invalidation (wick high/low)
Allow for tight stop-loss and high R:R setups
Using SFPs in conjunction with key highs/lows, volume, and structure dramatically increases your edge.
📈 Why Order Flow Is Crucial for SFPs
1. See the Trap Form in Real Time
SFPs are essentially traps — price sweeps a key level, sucks in breakout traders, and then reverses. Order flow tools let you see this happen:
A spike in market buys above resistance
Followed by a lack of follow-through (no new buyers)
And then an aggressive absorption or reversal (selling pressure hits)
Without order flow, this is all hidden in the candles.
2. Confirm Liquidity Sweeps with Delta & CVD
Watch for a delta spike or Cumulative Volume Delta (CVD) divergence — a clear sign that aggressive buyers are getting absorbed.
This gives you confirmation that the sweep failed, not just a random wick.
3. Tight Entries with Confidence
When you see actual trapped volume or liquidation clusters at the SFP level, you can enter tighter with conviction — because you're not guessing, you’re reacting to actual intent and failure in the market.
4. Early Warning System for Reversal or Continuation
If the SFP fails to trigger a reversal (e.g. buyers step back in with strength), you’ll see it early in the flow — and can quickly reassess.
🧠 Bottom Line:
Order flow lets you stop guessing and start seeing the actual fight between buyers and sellers. Combine it with SFPs, and you're not just trading price — you're trading intent. That edge is huge.
_________________________________
💬 If you found this helpful, drop a like and comment!
Want breakdowns of other charts? Leave your requests below.
Lowrisksetup
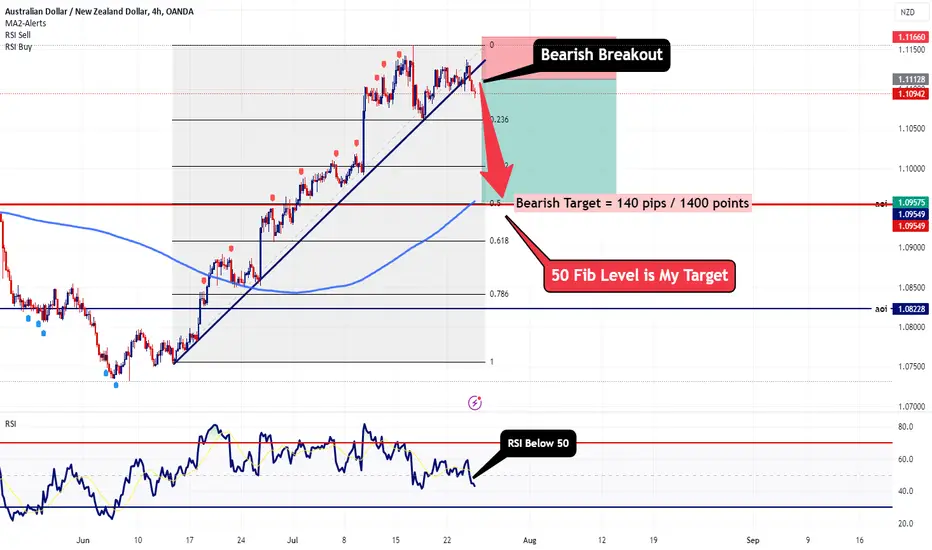
AUDNZD - Bearish Breakout with 1:3 Setup on 4HrTaking a look at the 4h timeframe, we can see price action broke and held below the ascending trendline.
For me this indicates potential topping action. This pair is also heavily overbought on the daily timeframe so a correction at this point shouldn't be too much of a surprise.
Cooper prices also continue to get slammed which may contribute to some Aussie weakness.
Further more, we don't have any further major economic reports on the docket this week for either NZD or AUD which may cause this pair to correct. The Australian dollar does tend to have a correlation as a Risk-On currency with US equities. Today in the US session we saw both the Dow and SPX lose some of it's bullish momentum.
Trade Safe!
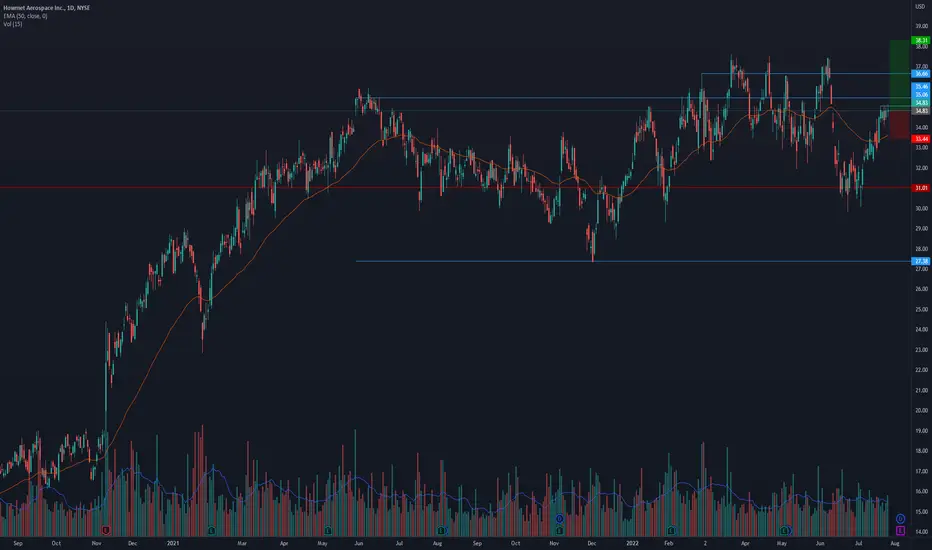
$HWM is forming a nice pivot. Can it move higher from here?Notes:
* Strong up trend since 2020
* Great earnings in the recent quarters
* Basing for the past ~14 months
* Recently bounced off historical highs around $31
* Forming a nice and tight pivot area around $35
* Offering a very low risk entry
* Showing signs of strength and accumulation
Technicals:
Sector: Industrials - Specialty Industrial Machinery
Relative Strength vs. Sector: 1.33
Relative Strength vs. SP500: 1.31
U/D Ratio: 1.74
Base Depth: 33.89%
Distance from breakout buy point: -4.99%
Volume 8.49% above its 15 day avg.
Trade Idea:
* You can enter now as it's trying to break above the $35 resistance level
* Or you can wait for a clear break above it before entering
* If you're looking for a lower entry you may find one around the $34.3 area as that's the bottom of the tight range
* This stock usually has local tops when the price closes around 10.23% above its 50 EMA
* Consider selling into strength if the price closes 10.03% to 10.43% (or higher) above its 50 EMA
* The last closing price is 3.69% away from its 50 EMA
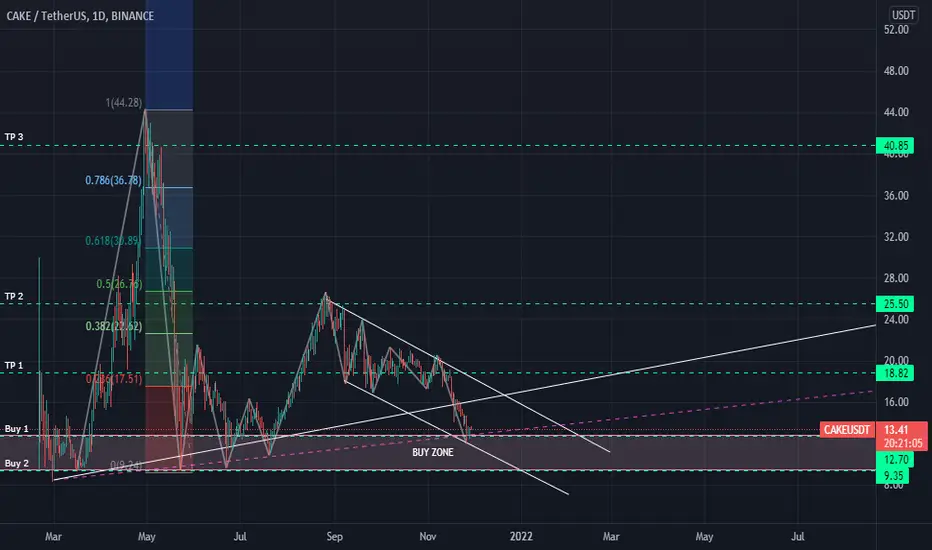
CAKEUSDT in Buy Zone Area! [Low-risk Setup]Good day, TradingView fellows!
I believe $CAKE is testing its support recently. The good buy zone is at $9 to $13. I am anticipating it will hit $18 in the short-term, $24 in the medium-term and $39 in the long-term. This analysis is suitable for swing traders and long-term traders.
Entry: $9 - $13
TP 1: $18
TP 2: $24
TP 3: $39
The idea published is not a financial advice. The content of this idea is solely the opinion of me who is not a licensed financial advisor or registered investment advisor. Trading cryptocurrencies poses considerable risk of loss. This does not guarantee any particular outcome. Always DYOR (Do Your Own Research) and trade at your own risk.
Let me know your insights in the comment section. Give this work a thumbs up if you appreciated my analysis. Smash that follow button for more upcoming low-risk setups! Thank you so much in advance.
Good luck,
Alexis