LQTYUSDT to bounce from weekly support around 0.85#LQTY #LQTYUSD #LQTYUSDT $lqty
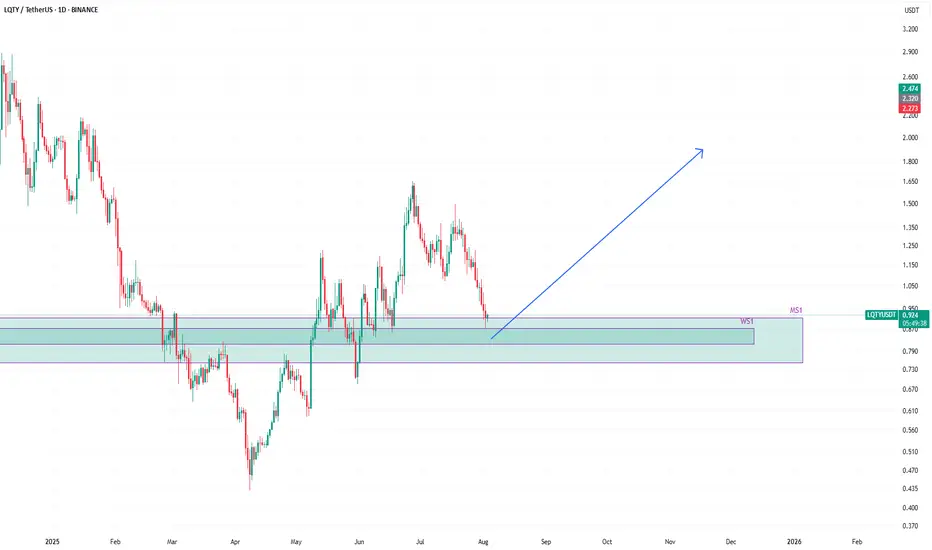
LQTYUSDT has tapped into monthly support zone MS1.
There is a confluence of weekly and monthly support there.
While tapping into monthly support, the price has barely touched the weekly support WS1 as well.
This zone of WS1 is very likely to reverse the price and this might already be in progress.
In case price still has some downward move left, it may go deep into WS1 zone and possibly in lower part of MS1 zone.
However, it is likely that it is going to reverse from WS1 zone if it has not done so yet.
This reversal will lead the price to go beyond the current all time high reached around 1.65.
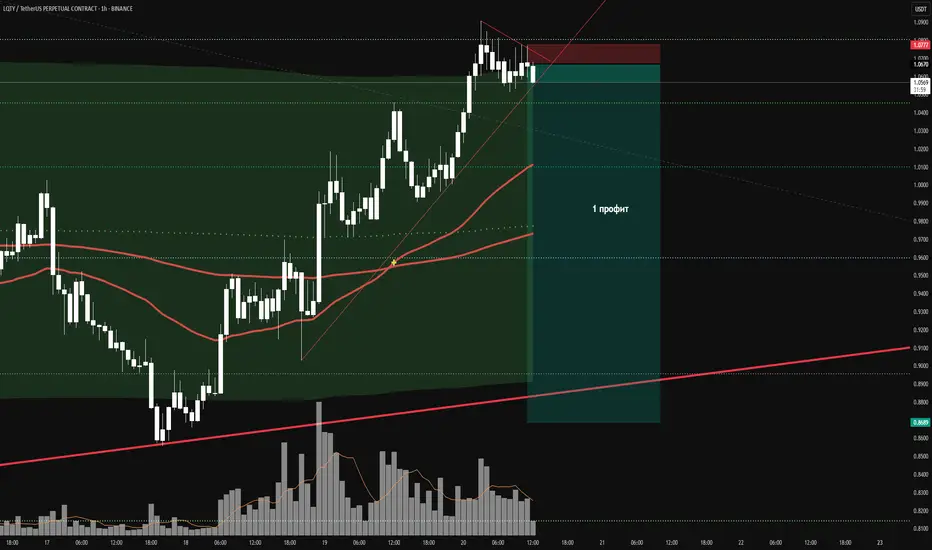
Lqtyusdtperp
LQTY - Buy - buy - bye bye- Volume in volume
- Divergence in volume
- Completed 5th wave of growth
I don't know what else to write.
If you like the idea, please put a ‘like’. It's the best ‘Thank you!’ 😊 P.S. Always do your own analysis before a trade. Set a stop loss. Capture profits in instalments. Withdraw profits in fiat and make yourself and your friends happy.
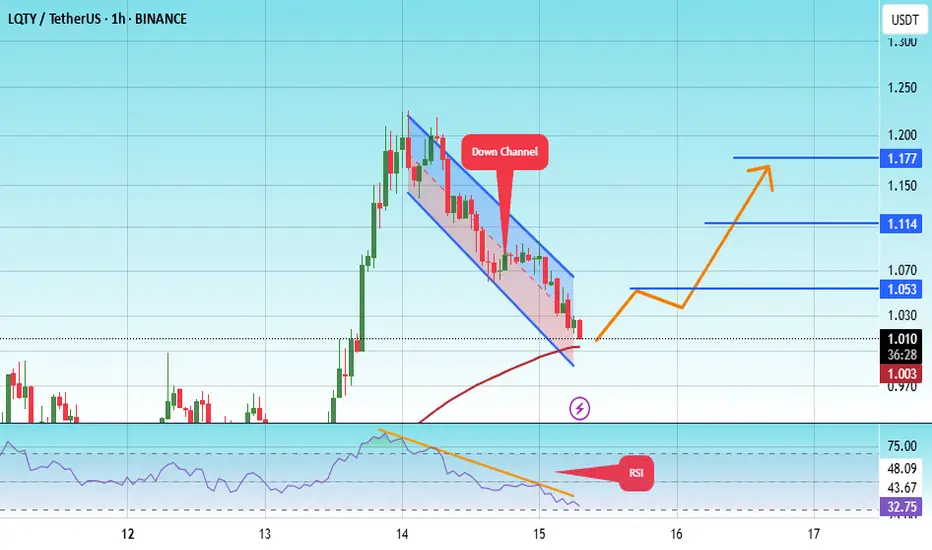
#LQTY/USDT#LQTY
The price is moving within a descending channel on the 1-hour frame, adhering well to it, and is heading for a strong breakout and retest.
We are seeing a bounce from the lower boundary of the descending channel, which is support at 0.986.
We have a downtrend on the RSI indicator that is about to be broken and retested, supporting the upward trend.
We are looking for stability above the 100 moving average.
Entry price: 1.011
First target: 1.053
Second target: 1.114
Third target: 1.177
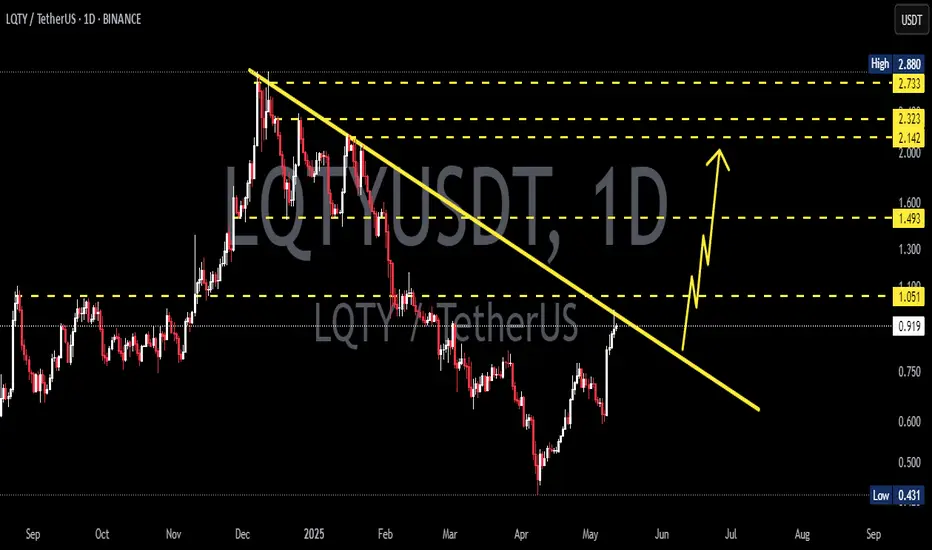
LQTYUSDT 1D Analysis LQTY ~ 1D Analysis
#LQTY Buy after successfully breaking this resistance line with a short term target of at least 15%+ from here.
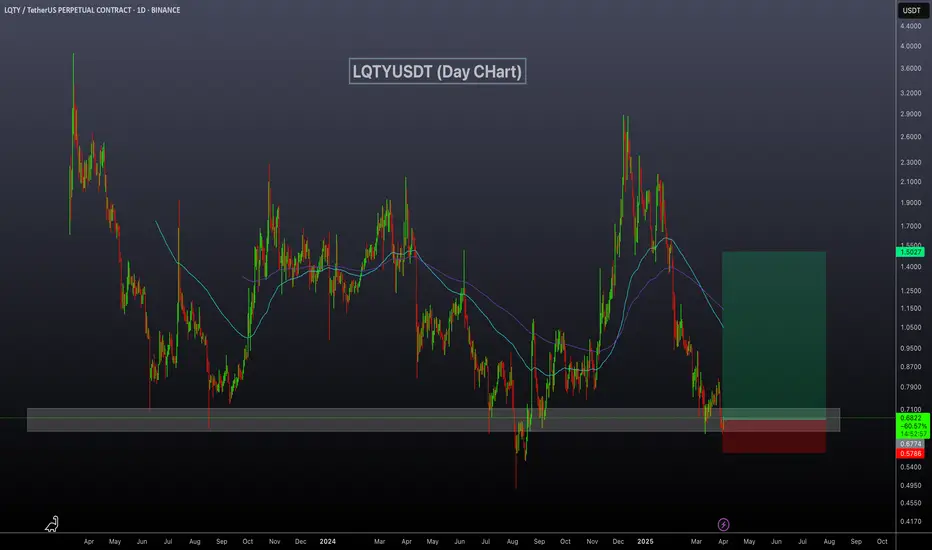
LQTYUSDT Eyes Rebound from Strong Support!LQTYUSDT technical analysis update
LQTYUSDT is trading at a strong support zone, where the price has touched multiple times and bounced back in the past. We can expect a similar bounce from the current support level. Additionally, in the daily chart, the RSI has dropped below 30, which is another bullish sign for LQTY.
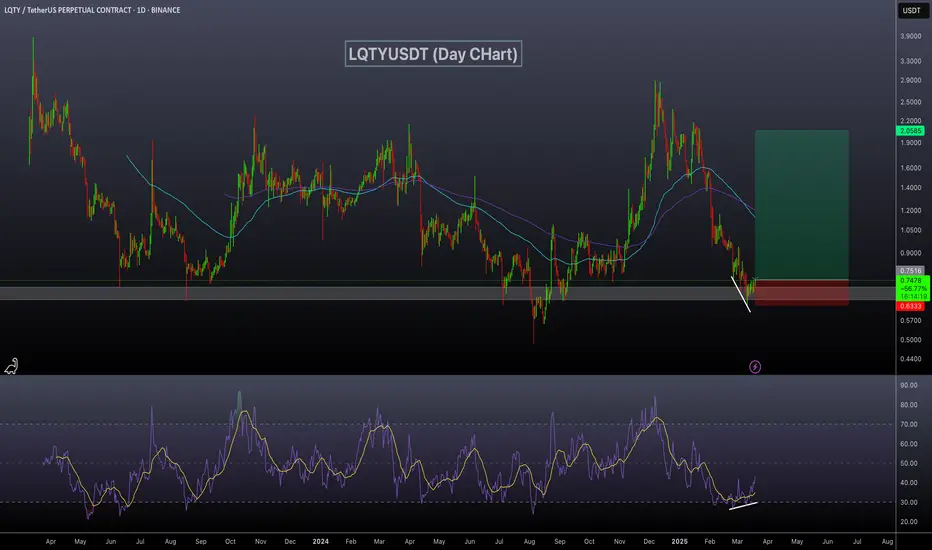
LQTYUSDT Bouncing Back!LQTYUSDT Technical analysis update
LQTYUSDT has bounced off a strong support zone, the same level where it previously showed a strong rebound. A bullish RSI divergence is visible on the daily chart, suggesting a potential bullish move from the current levels.
Buy zone : Below $0.76
Stop loss : $0.625
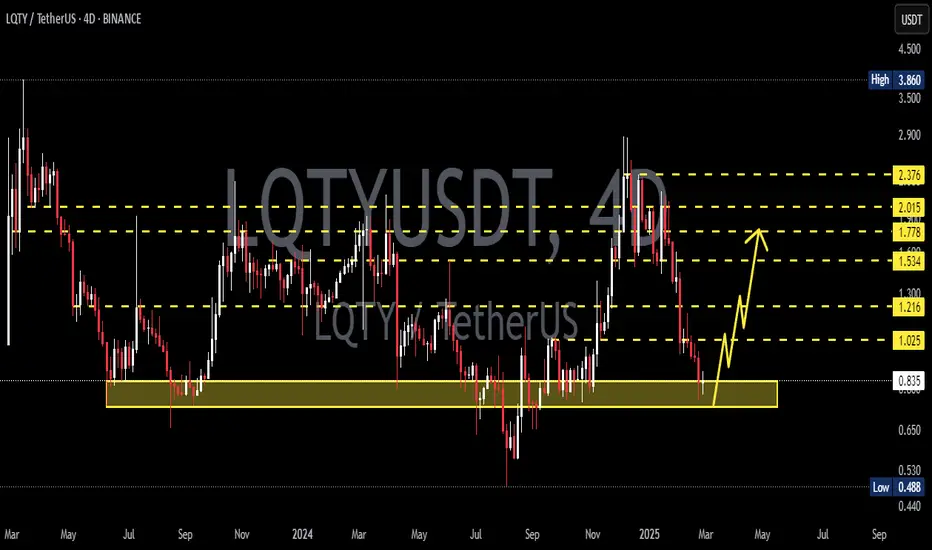
LQTYUSDT 4DLQTY ~ 4D Analysis
#LQTY Buy gradually from here if you still have a Conviction on this Coin with a minimum target of 20%+.
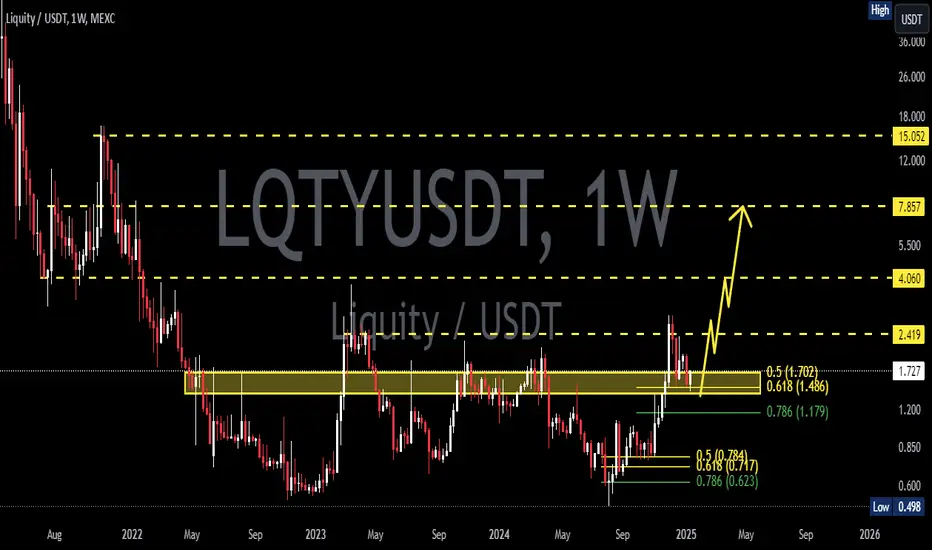
LQTYUSDT 1WLQTY ~ 1W
#LQTY So far it continues to maintain its bullish structure. Buy gradually within this support block, with a minimum target of 20%+
LQTY USDT 11% potentialLQTY/USDT shows an 11% potential for a spot trade, with bullish momentum building. Monitor support and resistance levels closely for optimal entry and exit points.

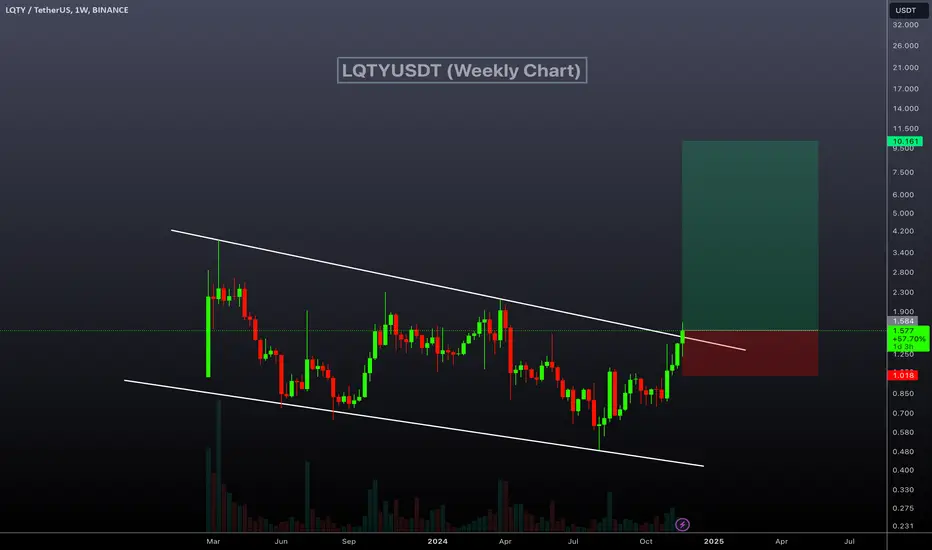
LQTYUSDT Breaks Channel !LQTYUSDT technical analysis update
BINANCE:LQTYUSDT price formed a descending channel pattern on the weekly chart. After 630 days of formation, the price has broken above the channel resistance. With a noticeable rise in volume, we can expect a strong bullish move in the coming days.
Stop Loss: $1.00
Target: 200-500%
Regards
Hexa