LRCUSDT , Exactly move to 2nd target , did you got ?Helloooo guysss
Whats up ? Did you got this amazing profit from the market or not ??
Loopring is one of the most powerful project that it work on layer 2 but it is optimistic , Do you know what i want to say ???? :D
According to last analysis we told and shown on chart that the price was broken the trendline and we need more pullback to the trend zone then we can be ready to go up until the new target reach .
Now exactly this movement was happen and the price touch the 2nd target and we have powerful momentum for the rising price , we shoud have pullback to recover power , if the recovery price take long time the movement and the route should update guys , until now you have this analysis if any change happen we try to update chart for everybody .
Previous analysis :
Dont forget use stop loss and attention to money management
Good Luck
Abtin
LRCKRW

LRC/BTC (Sign of Weakness?)💎Technical Analysis Summary💎
BINANCE: LRCBTC
-Looping is trading within a rising wedge on an RSI divergence
-This is technically Bearish in terms of chart pattern
-It is still unconfirmed until the upward trendline is broken down
-I recommend to Sell if a Bearish candle closes below 2k sat
-The downside target is the previous Resistance/Support at the 1400s sat
-Wait for the confirmation and don't rush into the trade without a plan
``````````````````````````````````````````````
Trading Involves High Risk
Not Financial Advice
Please Exercise Risk Management
``````````````````````````````````````````````
If You Like My Daily Published Ideas
A little Help By Supporting My Channel
Through Leaving A Thumbs Up, Comment & Follow
Happy Trading! --> Thank You! :)
``````````````````````````````````````````````

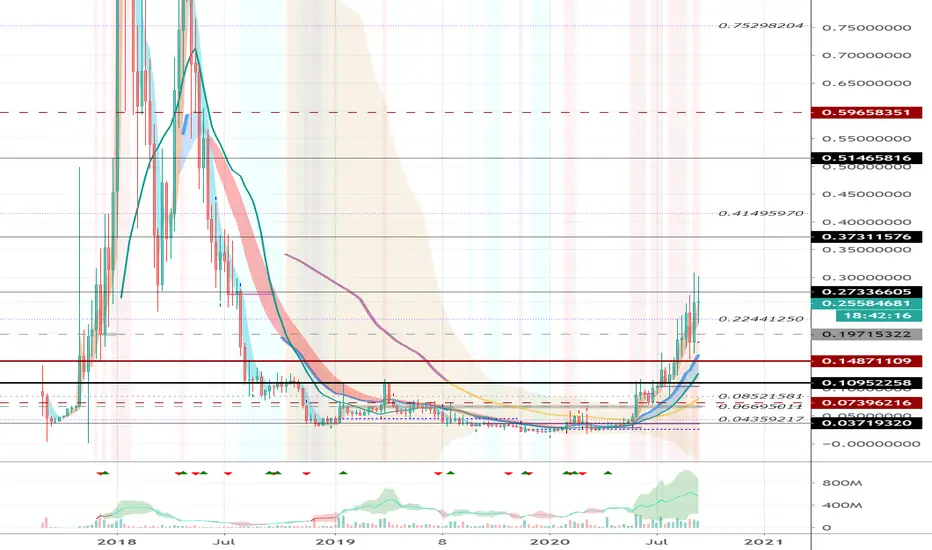
Loopring (LRC) - September 20 (1W)Hello?
Dear traders, nice to meet you.
"Like" is a huge force for me.
By "following" you can always get new information quickly.
Thank you for always supporting me.
-------------------------------------------------- -----
As it rises above 0.14871109, it is completely off the floor.
In order to create a new wave, you need to make sure you can get the support above 0.14871109.
We do not recommend new investments as the uptrend has not yet ended and we do not know where to sideways.
If it falls, we need to see if we can get support at 0.19715322.
It is expected that the movement to create a new wave will proceed, so we will have to watch it with a margin.
-------------------------------------------------- -------------------------------------------
** Check support, resistance, and abbreviation points.
** Support or resistance is based on the closing price of the 1D chart.
** All explanations are for reference only and do not guarantee profit or loss on investment.
Explanation of abbreviations displayed on the chart
R: A point or section of resistance that requires a response to preserve profits
S-L: Stop-Loss point or section
S: A point or segment that can be bought for generating profit as a support point or segment
(Short-term Stop Loss can be said to be a point where profits and losses can be preserved or additionally entered through installment trading. You must trade from a short-term investment perspective.)