Loopring - Green trend cycle long termHello trading friends,
Also, LRC did break down depending on the last trend of BTC.
Same time know that LRC has a green cycle trend - what means for the long term is still interesting.
Coming time there will be more targets updates of LRC.
Have a great day.
Lrcusdt

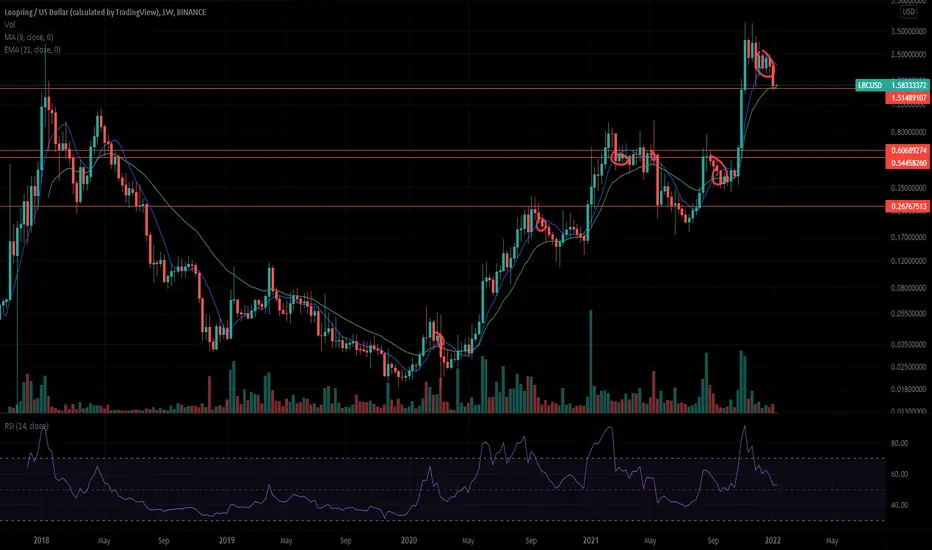
3 LRCUSD Trade Strategies• When LRCUSD is in an uptrend and closes below the 8W SMA, it has at least tested the 21W EMA.
• It’s now testing the 21W EMA, which also happens to be around the price where many bought in end-Oct’21 / early-Nov’21.
• Fundamentally, the mood within the reddit groups have turned from jubilant to rather downbeat, and has the potential to further worsen if LRCUSD does not pump. The weekly RSI has also more room to drop.
• However, though the recent BTCUSD and LRCUSD dumps are expected (BTCUSD retests at least the 20W SMA when it closes below the 8W SMA), the LRCUSD dump took longer than expected and is less severe than originally expected. There might be still some gas left in LRCUSD.
• BTCUSD may have bottomed, or it may not. If BTCUSD dumps further, then let’s KIV any thoughts of LRCUSD till BTCUSD gets back above its bull market support band.
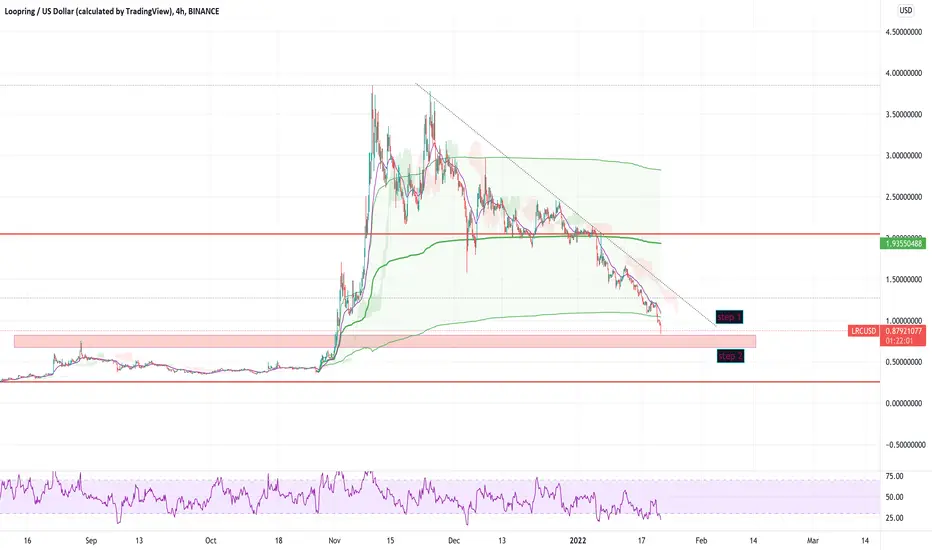
• Strategy 1, If BTCUSD remains above $38K, then watch if LRCUSD closes above its 21W EMA (currently at $1.52) this week. If so, then DCA in.
• Strategy 2, given that LRCUSD may dump further, DCA in at around $0.60.
• Strategy 3, buy LRCUSD when it gets back above the 8W SMA and retests it.
• Strategies 1-3 are arranged in descending order of risk. LRCUSD is an inherently risky investment, and as a long-term trader with mid-high risk appetite, I’d personally go for Strategy 3 if it happens before what is described in Strategy 2.
• I still suspect LRCUSD will not see a new ATH this bullrun. So unless there is anything which changes my mind, if I were to adopt Strategy 2/3, I will sell within 85% of the previous ATH.
LRCYou can just keep putting new rebound bottom arrows everytime it drops another 20 cents. Look at the full chart here.
BTC is at its last point of rebound and if we don't in the next 3 days you can nearly guarantee 60 cents for LRC.
Whether you like it or not this is what a pump and dump is.
If you got sucked in by hype all you can do is wait and hope it gets back to its highs or short it to 60 cents. Both take big balls when all you have is a rumour.
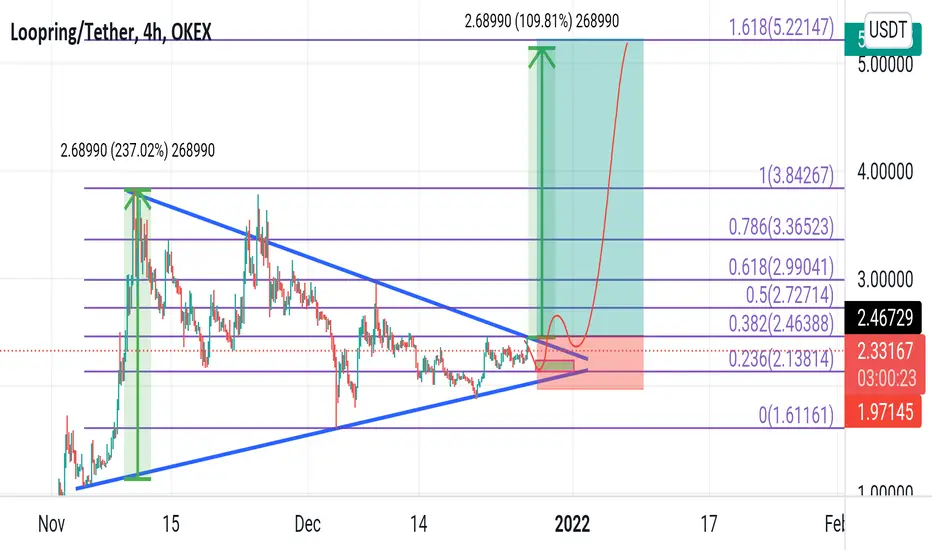
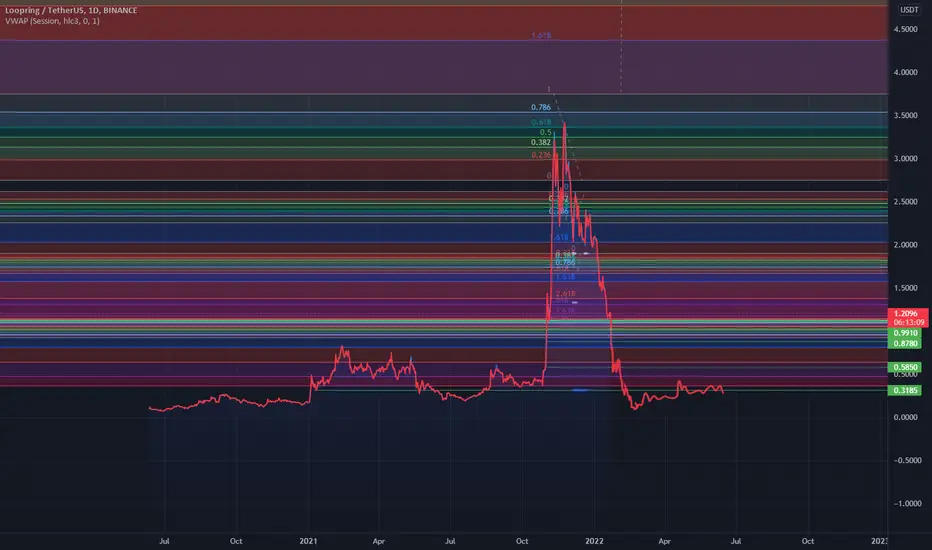
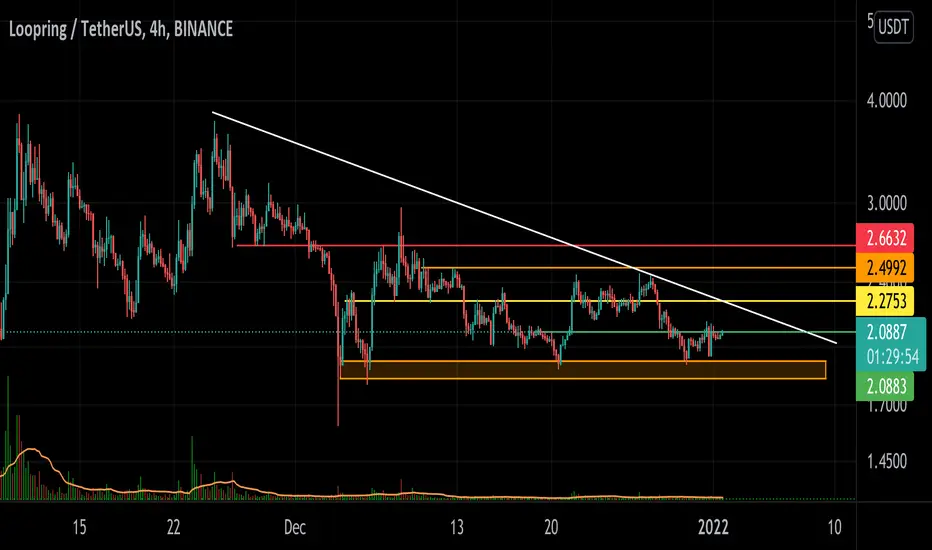
lrc-low targsthis is a chart. it has some major VWAP spots marked on the map by free-hand. It has some fib retracements and fib extensions. it is nice and simple stuff, just the volume weighted zones here thanks.
Good a couple months of hell for the start of this new year
please comment, like and subscribe for more content out soon
LRC Builds New Temporary Bottomhello guys , every thing is on chart , fibbo levels , supply zone ,
LRC Ready For New Temporary Spike Like Shiba Inu before Continue Falling More .
2 ideas for bottom :
1- double top pattern bottom : 0.65 - 0.75
2- bottom based on fibbo and demand zone : 0.9 - 1.15
Targets : On Chart
SL : Daily Candle Close Blow 0.6 ( For Hodlers )

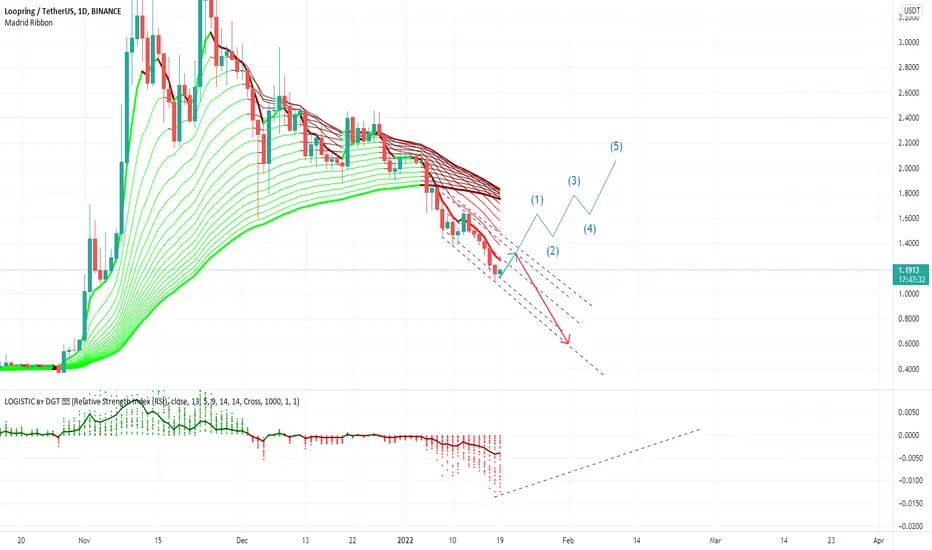
Key area.If we don't break the 130ish area in the coming week then we will surely see 60 cents by February.
If we do we need to fight to get back into trend, fight to get above ma, fight to get above other resistances/cloud.
The only thing that is going to bring upward movement is a release from Looping or GameStop. Expect another dump tomorrow and dumps until the end of January.
I'm holding for the long term but it's good to compare sentiment, developer release schedule, and news to price movement.
A waiting game.

LRC/USDT important momentIf it can break thru this time. LRC will survive
If it cannot break thru. this token is dead. Due to no more strong resistance line.
Cause a massive huge drop.
RSI is hitting bottom, Bullish is forming
Last chance!
LRC -LAYERING ECO -- Again Sharing Entries and exit points are given.
Dont enter without Sl.
Btc Movement is in decision mode. So be careful

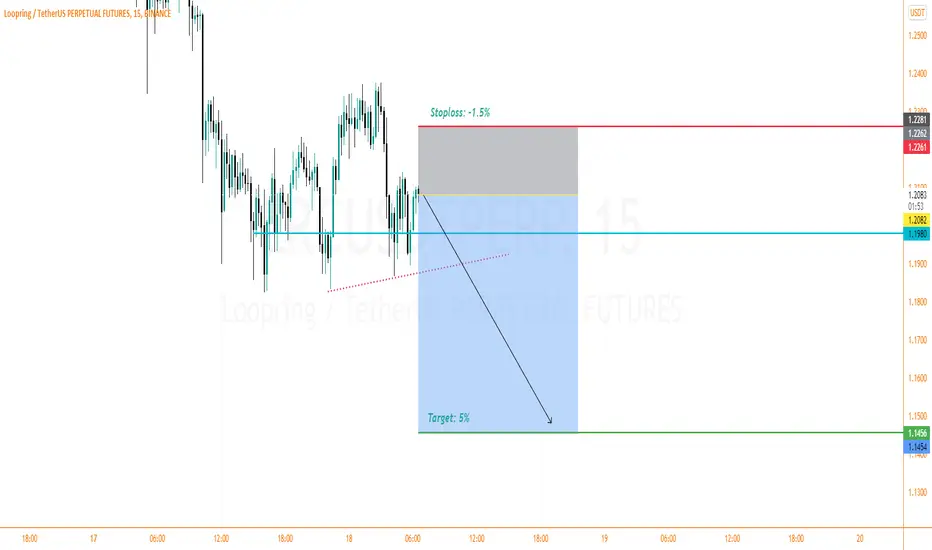
LRCUSDT SellHello traders!
LRCUSDT is now in consolidation formation. Once it is completed then we will see at least a 5% dip.
Stoploss is -1.5%
Target is +5%
Suggested leverage is 10x
Don't forget to hit the like button and follow to stay connected
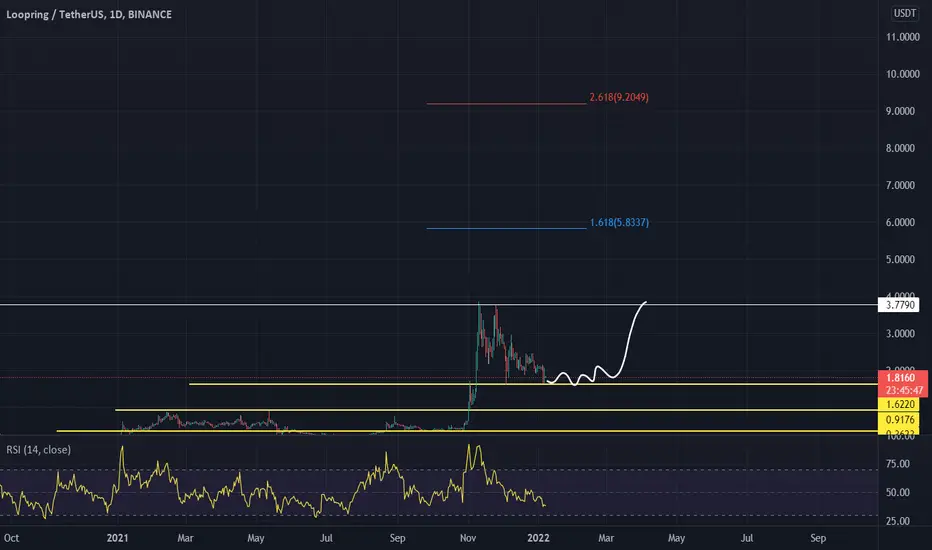
LRC IdeaSeeing the full chart for lrc makes a huge difference.
What do you think about this long term outlook?
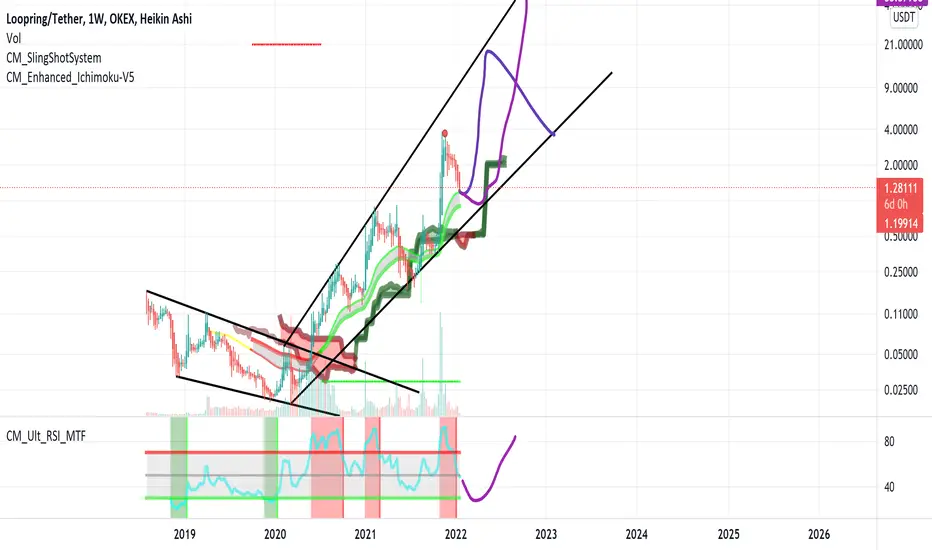
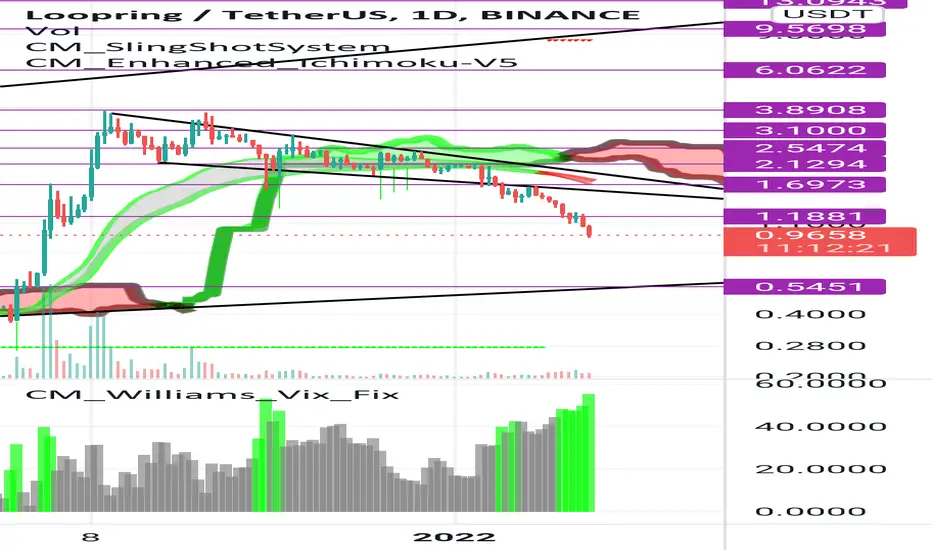
UPDATE: LRC profit 53% after SHORT signal - more to come?Please Like or Follow if you enjoyed this content.
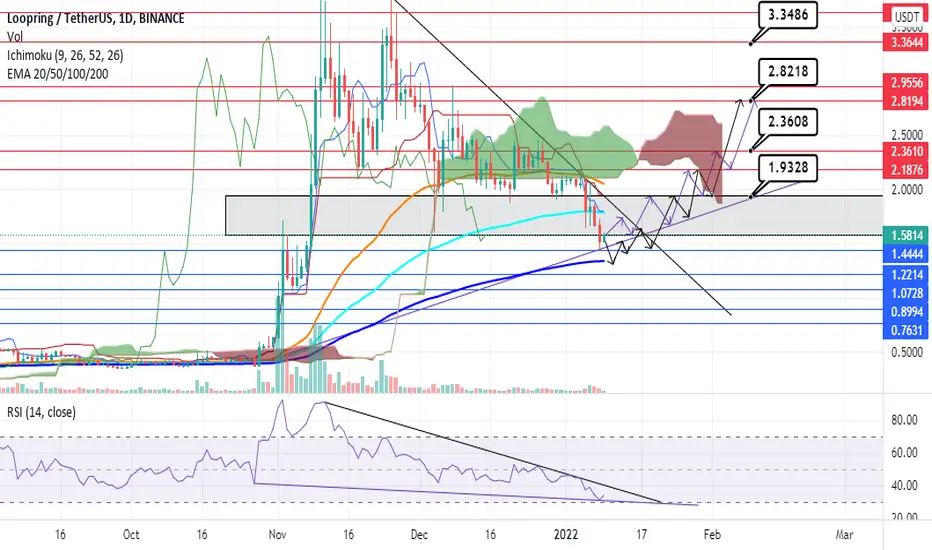
UPDATE: The price dropped 53% after Short signal. Currently sitting on support 1.20 USDT. If support doesn't hold, 0.90 USDT is next support. Price is below Ichimoku cloud and RSI is still bearish. Another drop is definitely possible. But right now support is holding.
This analysis is made with my "Supertrend Ninja - Clean". It displays only the last few signals. Which gives it a clean look. Currently LRC is still in a downtrend.
Supports and Resistances are highlighted as grey blocks. Profits can be taken at each grey block. Supports and resistances are automatically drawn using my indicator "Yo Show Me Some Support - and Resistances". Pun intended.
Thank you for reading.
Namasté 🙏
What Indicators Do I Use:
In the chart I am using my "Supertrend Ninja - indicator", which is a trend-following indicator (Green and red vertical line with arrows). When the background of the candlestick closes green (vertical line) with an upwards pointing pink arrow. It indicates a possible bullish (up)trend.
With each trade proper risk management is essential. Either by using my script "Trailing Stoploss Bottom Activation indicator", visible as grey dots below the candles. Which sends an alert, when current price goes below the previous candle low. Or using my "HA Trailing Stoploss Activation", the indicator below with green and red blocks. Or third option, exit when the Supertrend Ninja indicator displays a vertical red line with a downwards pointing black arrow. Remember, the first stop(loss) is always the cheapest stop.
Disclaimer: Ideas are for entertainment purposes only. Not financial advice. Your own due diligence is highly advised before entering trades. Past performance is no guarantee of future returns.

LRCUSDTHello Crypto Lovers,
Mars Signals team wishes you high profits.
We are in the daily time frame. You see that the price has created a Gartley pattern. If it receives support at the S1 line, the next target would be the R1 line where you can save profit there. If it breaks the R1 line, it can move up to even $2.43. If it breaks the S1 line it can move down to $1.761. But it seems bullish.
Warning: This is just a suggestion and we do not guarantee profits. We advise you to analyze the chart before opening any positions.
Wish you luck

LRCThis currency can experience good growth again due to the positive divergence given in the daily time.
But if Bitcoin wants to try a correction again, I drew the next trend line for you.
LRC: DCA your entry
falling wedge
good fib retracement level to buy
SMI bullish DIV
but mostly some influencer is calling it
For all the reasons listed above this can break out, just DCA your entry and/or use stop losses because I think BTC will go to 40K and this can drag everything down, LRC included.
Good luck

LRC to $10LRC is consolidating for next big move. LRC is at support and best time to add it in your portfolio. This is new base.
LRC Still believe LRC is going to touch 1.50-1.60 area first (which would be bitcoin at 42k) before reaching that 7 or 8 mark.
But..
Im posting this after seeing the current volume from the last few months. That alone tells me to keep holding with big rumors like Nike, MSFT, Alibaba and the bank of China upcoming. Paired with confirmed yet unannounced like GameStop.

LRC -LAYERING ECO -- Only buy in recommended zone -- Signal ID# 207
COIN: LRC/USDT
Exchange: KUCOIN, BINANCE
Direction: Spot AND LONG
------------------
Position: 2%
Risk: med
Entries :
E1: 1.81
E2: 1.68
-------------------
Targets:
TP1: 2.25
TP2: 2.7
TP3: 3.3
TP4: 9, 18 , 50
-------------------
Stop loss: 1.57

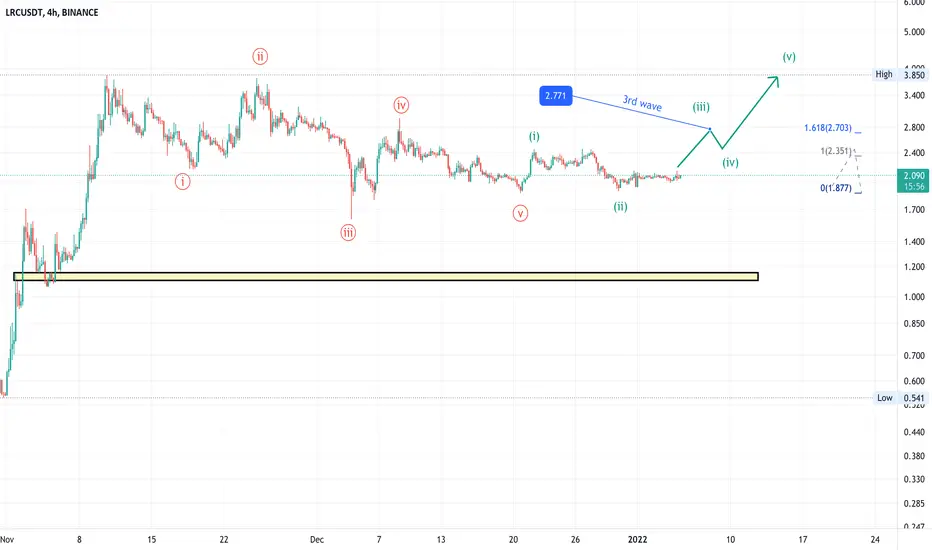
April showers bring May flowersOn 4H TF, I figured out the impulse wave at 1.887. This is the truncation wave.
LRC has been occurring.
Let's wait and see
LrcHello to all traders, the price is close to its long-term uptrend line. The price has also reached a very important support. I identified a shopping situation here. what is your opinion?
trendanalysis
Lrc
Loopring on the verge of next bullish cycleLRCBTC close to daily MACD outbreak. Right now facing cloud resistance around 4.9k sats. Closing a daily candle above is a very bullish sign. Next run could push LRC past $10, not even taking into account the Q4 announcement that's coming within a week.

LRC just bouncing ATM waiting for GME newsLRC is just waiting so just keep dollar cost averaging ur way up to the news

LRCUSDT Wait for the confirm breakout of the Symmetrical triangle, 👉 or use the DCA.
Manage your own risk accordingly with that TP Stop-loss everything.