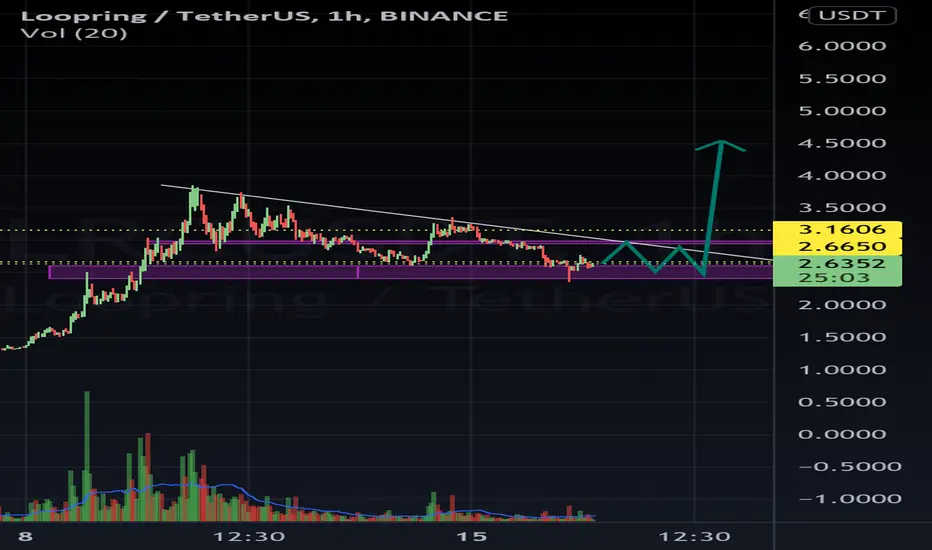
LRCUSDT Longas you see LRCUSDT can move up between next 4-6 Days.
NO ONE can say that my analysis is perfect.
Then have a strategy and trade with low risk.
Lrcusdt
LRC breaks the RooFAs i analyzed loopring in past days it breaks the roof and the rally is continuing now!
After Day canlde close on the roof , you can enter to join the rally to ATH
Tel channel: @zcsash
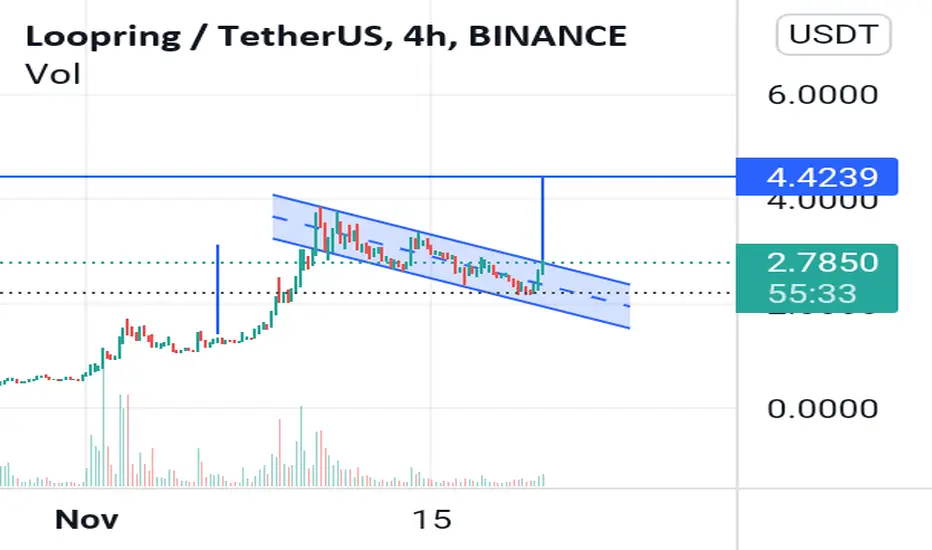
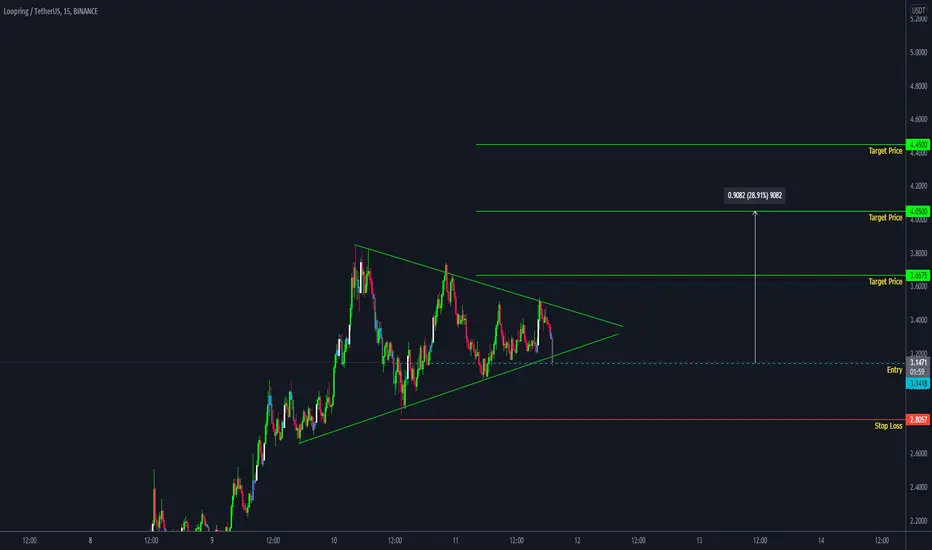
LRCUSDT - Channel Breakout!!LRCUSDT - Channel Breakout!!
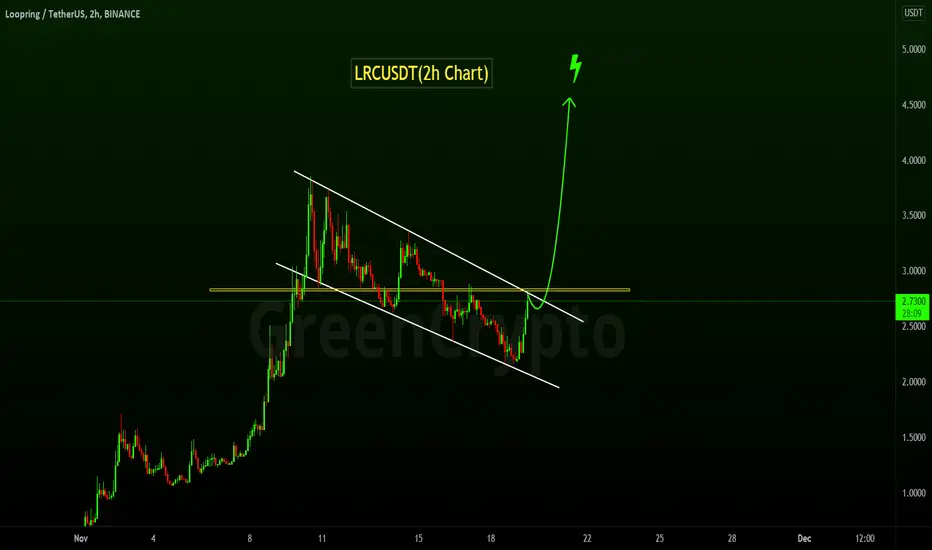
LRCUSDT(2h chart) Technical analysis
LRCUSDT(2h chart) Currently trading at $2.76
Buy level : Above $2.8
Stop loss: Below $2.12
TP1: $3.26
TP2: $3.75
TP3: $4.2
TP4: $5
Max Leverage 3x
Always keep Stop loss
Follow Our Tradingview Account for More Technical Analysis Updates, | Like, Share and Comment Your thoughts.
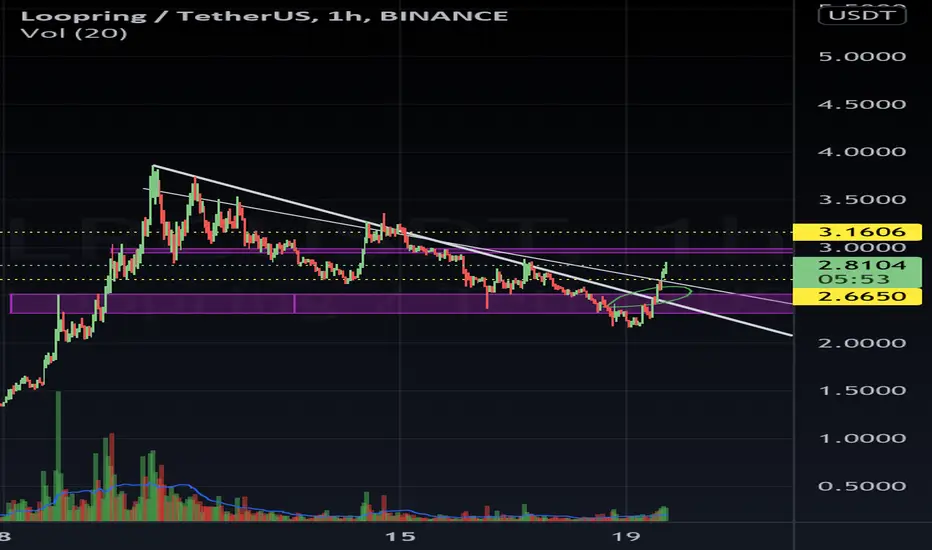
LRCUSDT RecoverFinally, i think LRC will recover from here
We see that the price currently at a support range and willl recover soon to approx. 3 - 3.25
Otherwise, if the support is broken, we'll retest at 2 - 1.5 range
Trade safe.
LRCCritical up/down moment for LRC right now. Given the hype and releases happening this would be a great spot right now to long.
Current candle looks great as well.
Check out the ma's in multiple timeframes to coincide with the cloud, vix, and stochastic.
K.i.s.s

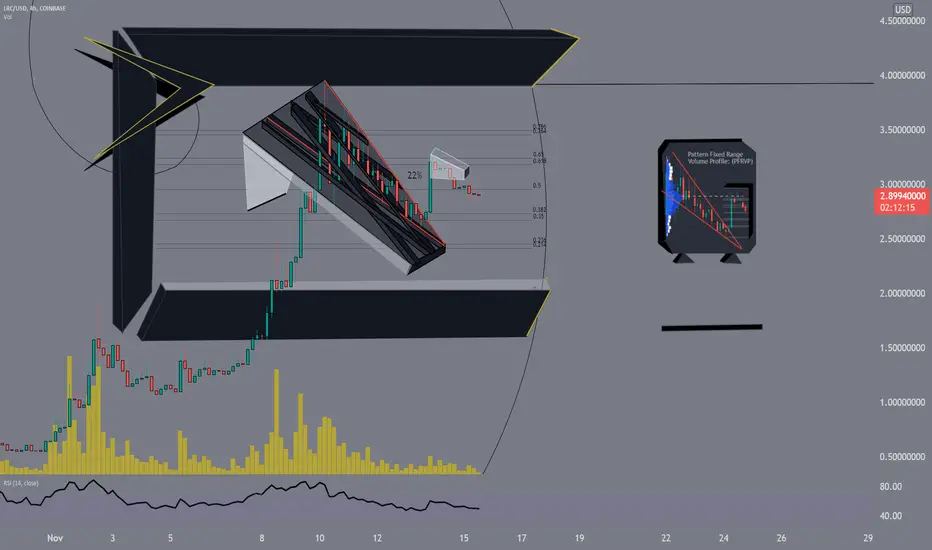
LRC - Falling Wedge Confirmed After a period of consolidation the pattern confirmed with a back-test of the upper bound for a 22% gainer. Price found Golden Pocket resistance with multiple rejection of the Pattern Fixed Range Volume Profile.
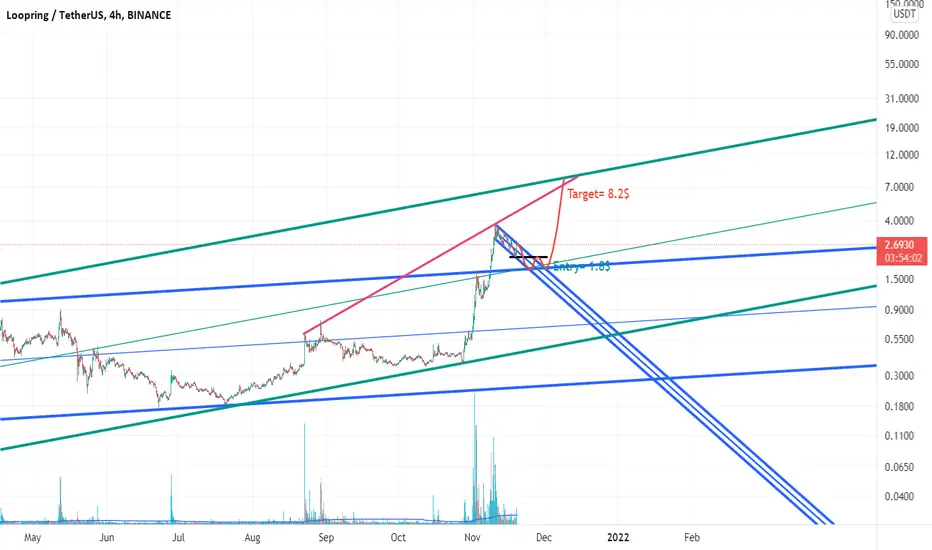
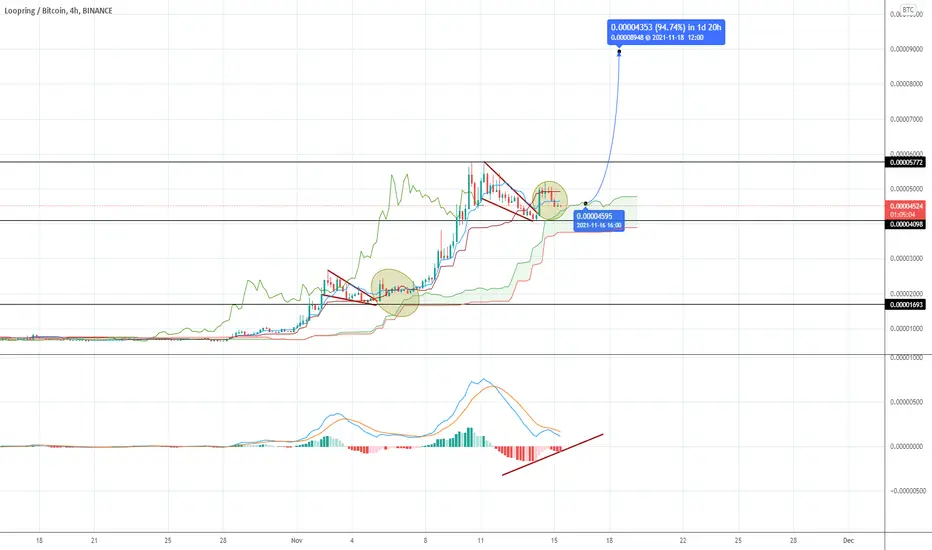
LRCBTC LONG. Target: 14k sats 4H MACD crossover on the way. Moreover, fractal pattern indicates next move up.
Last bullish move: 1700 sats --> 5800 (x3.5)
If multiplier applies in next move up: 4100 sats (support) *3.5 ~ 14k sats target.
This would increase LRC in USDT value up ABOVE $10.
LRC does not follow classical crypto dumping patterns. GME investors are programmed to HODL. Dips are relatively small. Moreover, Grayscale is contemplating to invest in Loopring.
Include the NFT announcement that WILL take place in Q4. LRC is primed to make big big big moves. In addition, only 3 percent of the supply is left out of circulation. This will cause a large supply shock.
Everything indicates a very bullish setup.
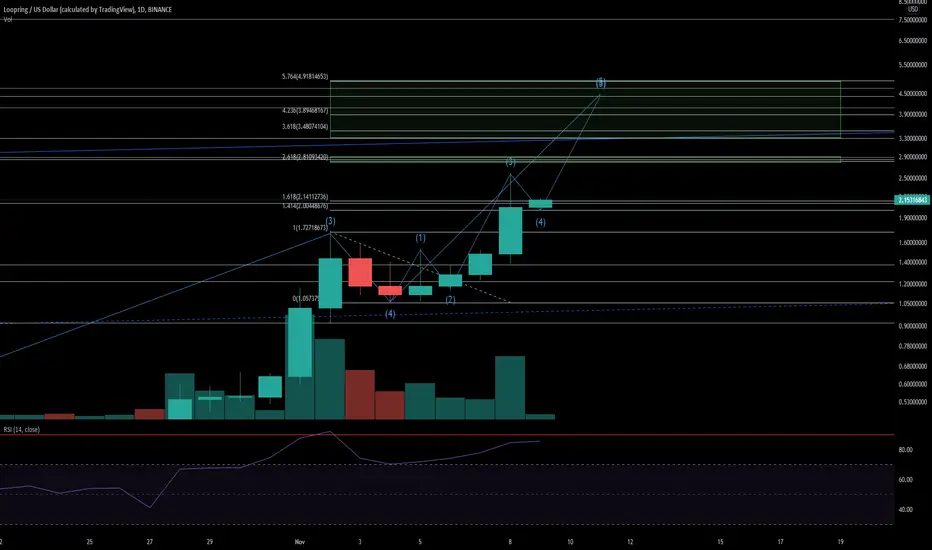
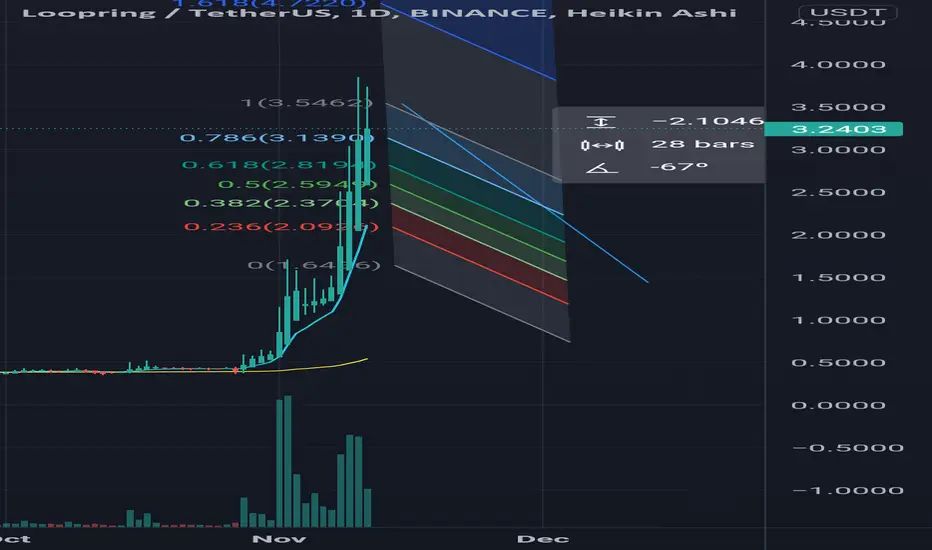
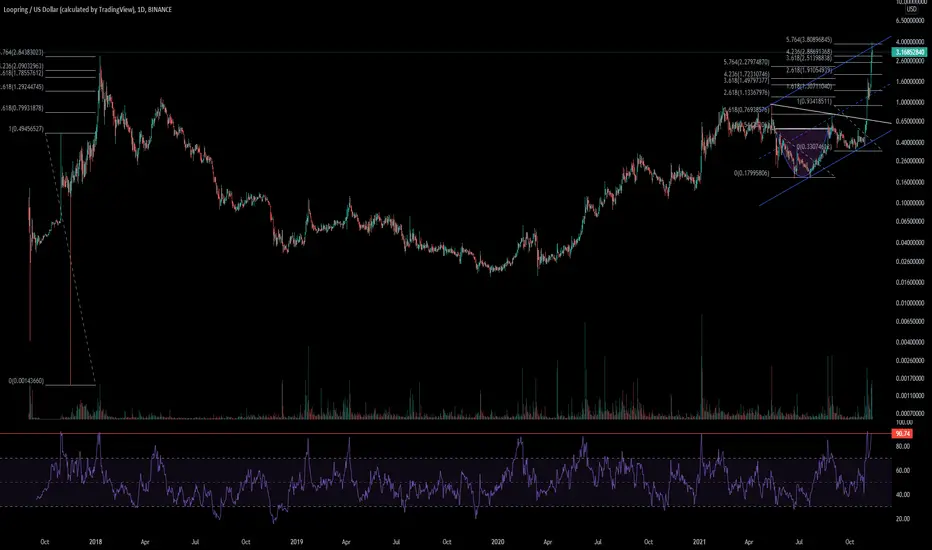
LRCUSD is getting off her bed• As LRCUSD enters Wave 5 and starts to reach for her 2nd and probably final top in this bullrun, it is worthwhile to update our post on LRCUSD.
• Trading is primarily a matter of managing one’s emotions in the context of risk-reward management. FA is a tool to identify opportunities. TA is a tool to quantify and thus visualise potential growth and areas of profit taking.
• Besides contributing to the community, sharing posts on TradingView is also a good way to document one’s thoughts so as to prevent FOMO and FUD as emotions get high near TPs.
• Back to TA, given that LRCUSD has woken up, it is now time to focus on profit taking. I don’t think LRCUSD has peaked yet, but it is good to plan ahead.
• *Assuming* we are currently in Wave 5, keep in mind that according to Elliot Wave Theory, there would be 2 intermediate peaks within Wave 5. I believe we have already seen both of them—the 1st on 5 Nov’21 and the 2nd on 8 Nov (it’s easier to see them on the 4hourly with Heikin Ashi candles).
• I’ve filled in 3 sets of Fib levels. The 1st from crypto winter (Jan’18 to Mar’20), the 2nd from Wave A-C (Feb’21 to Jul’21), and the 3rd from Wave 3-4 (2-4 Nov’21), with the more recent Fib levels being brighter in colour. Note how well these Fib levels have served as support and resistance.
• As indicated in our previous post on LRCUSD, she has been consolidating after forming her 2nd intermediate peak. This is healthy and will confirm the current resistance as support.
• My gut tells me that LRCUSD will punch through the resistance levels at around $2.81. But watch volume and momentum during this breakout.
• My gut also tells me that LRCUSD will break out of the parallel channel she has been in since Mar’20 and enter heavy resistance between $3.48 to $4.92. We should be taking profits within this region.
• Note RSI levels. **Re-evaluate TPs when LRCUSD hits *and* exceeds RSI(14) of 90% on the daily *and then* the weekly. Given how RSI is calculated, cf Wilder’s New Concepts in Technical Trading Systems, this might take several days from now. Don’t burn out. Take profits on the way up **and** on the way down.
• At the same time, don’t forget fundamentals. LRCUSD’s top might be heralded by an announcement on a partnership with GME or ETH. Don’t forget LRC’s role wrt to ETH. There are interesting things happening on the ETHBTC chart.
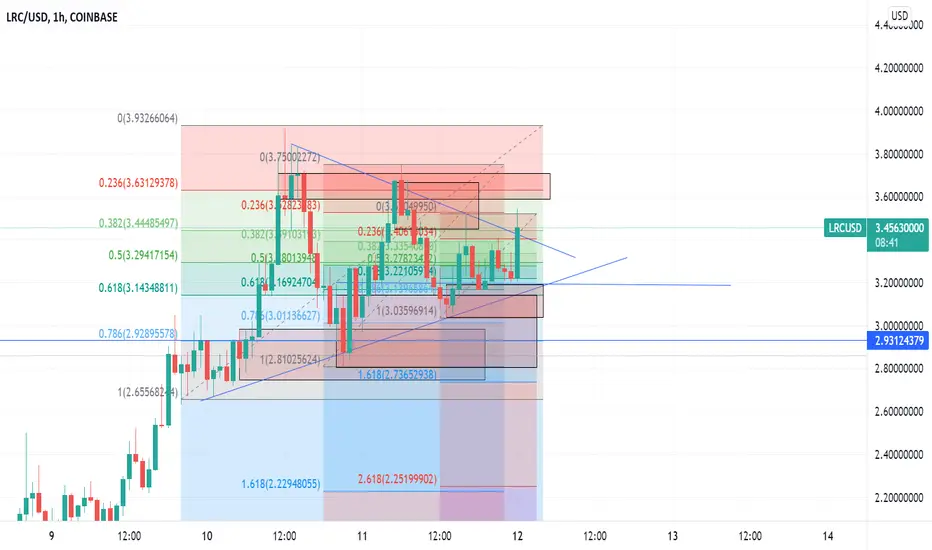
LRC USD is breaking out of a bullish pennant COINBASE:LRCUSD
After a huge run-up and consolidation the price was winding up in a bullish pennant and now could be breaking out higher.
Looking for at least $5 if price can stay about $2.80 support.
Be careful lrc may retouch 1.5 levelAfter up we may see some high sell of lrc was one of the best gems some days earlier but it's over anymore lrc is a great project and has great fundamentals but after reaching to new ath it must retest 1.5 area so be careful and manage your stop losses.
Happy trading.
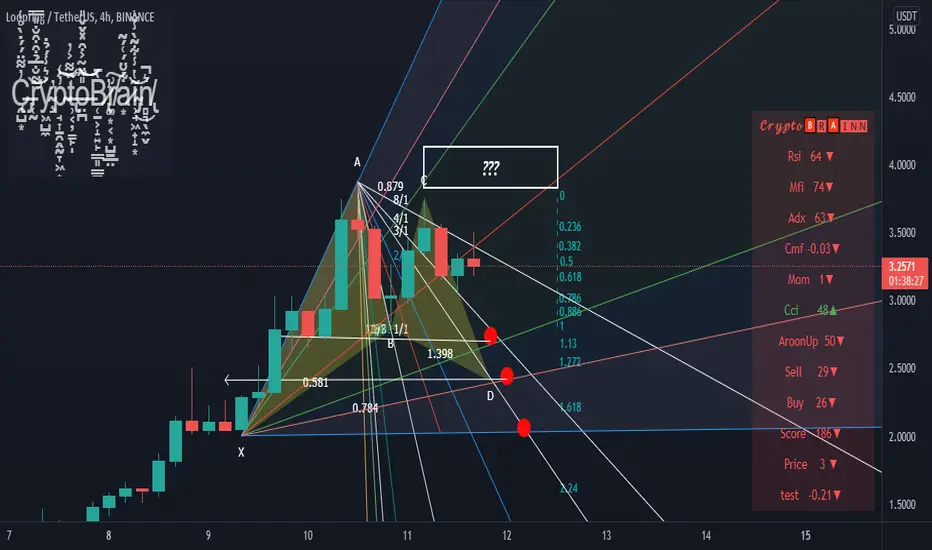
LRC USDT Note: First of all, candle closings in the upper box invalidate everything I wrote below and show that this analysis is wrong. If this box is not entered or this box is not passed, my thoughts below are valid.
Analysis;
Fibonacci measurement at 4H may suggest that this is an elliot wave. But I don't think it's the elliot wave.
1st wavelength is too long
2. sellers consolidated too much
3 indicator values seem too high to me.
Fan intersections marked as circles on the graph should work as supports.
Check the rsi when the price comes to each circle area. If the rsi in 4H still has not fallen below 35 or if the rsi has not fallen below 60 in the daily time frame, it is possible that the decline will continue.
A good trade is the one in the last circle.
Note: This is not Investment advice.
LRC Pump and DumpMy experience says that this looks like a pump and dump. I personally just sold another part of my LRC. Hope to buy it back between 0.5 USD and 1 USD. It is on All Time High related with ETH, much higher ATH vs BTC. I point out the sport to buy at 28 cents. We are now more than 10x profit (time to sell not to buy). I don't care if it goes much higher than this. There are other cheaper projects right now.
LRCUSDT 1H. Time To Sell ⏱️ Loopring, LRC has been on a massive up-move for days. It did over 300% .
But all good stuffs must come to an end.
It peaked out on the 4H chart at near $3.90 . Where I took my profit, because I saw the perfect indicator. After this I tweeted how it needs to cool off yesterday.
This is 1H chart, Double-Top formed already.
Failed to make Higher-High after previous bounce at 0.5 Fibonacci.
MA 10 is already broken twice on 1H.
RSI bearish divergence in progress
These are the signs, time to cool off for LRC . Time to take profit if you haven't already
Various support shown on the chart , support previously tested and the one yet to be tested.
Follow @CryptonKidd for daily analysis
PS : Tell me any Token you want me to do analysis on. I'd consider it.
LRC is forming CUP & Handle Go 4.5LRC chart is so clear , i think it is going to form cup & handle patern. The price could move to 4.5 i think or above.
Please make your own choice...
It is idea ... what do you think please comment below

LRC over bought, triple top in short timeframeLRC pumped from 1$ to 3.85$ in 4-5 days. but its time for check support before new ATH's
note that LRC got so much USD volume flow which is great until music stopped.

LRCUSD After Action Review – 31.5X in 4 trades• That was a nice and enlightening series of trades on LRCUSD. Let’s do an AAR for self-improvement purposes. ** marks areas for improvement.
• Some background first. I’m an amateur long-term trader who utilises both FA and TA. FA to identify investment opportunities. TA to add precision to when/where/how to make trade decisions.
• My overall trading strategy is heavily influenced by the RPG Darkest Dungeon (en.wikipedia.org). Trading is stressful, more so when you are “in the dungeon”. Stress reduces one’s trading efficacy, so I try my best to minimise stress by doing due research before taking action, and by minimising the number of trades I take. I don’t leverage trades.
• I’m a technologist in my day job, and FA is a large part of what I do. In essence, FA is simply the identification of problem statements, use cases and the estimation of commercial potential.
• For TA, I avoid fancy stuff and rely on simple patterns to identify trends, E-Waves and Fib levels for potential levels, and RSI for momentum and tops.
• Fundamentally, LRC tries to address the iron triangle of crypto. Very similar to other industries (eg quality, cost and accessibility in healthcare), in crypto, there is 3 traits that are valued—decentralisation, security and speed—but it is only reasonable for any blockchain to be good at at most 2. This is the problem statement. ETH focuses on decentralisation and security, and needs to outsource speed to layer 2 blockchains. LRC’s use case is to serve as ETH’s L2. However, even though L2 is required, L2 does not need to be tokenised. The only reason why L2 is tokenised as LRC is profit-making, and we should view her accordingly with clear eyes. It is eventual that LRC is acquired by ETH, or ETH may even build its own parallel L2 and eventually phase out LRC. Any partnership with GME is done more out of desperation and diversification than anything. Let’s be brutally honest with ourselves and not be blinded by ideology.
If history repeats.If history repeats itself , then consolidation and retrace to support levels might start now.
One of Warren Buffett's most famous investment sayings is “Be fearful when others are greedy. Be greedy when others are fearful.”

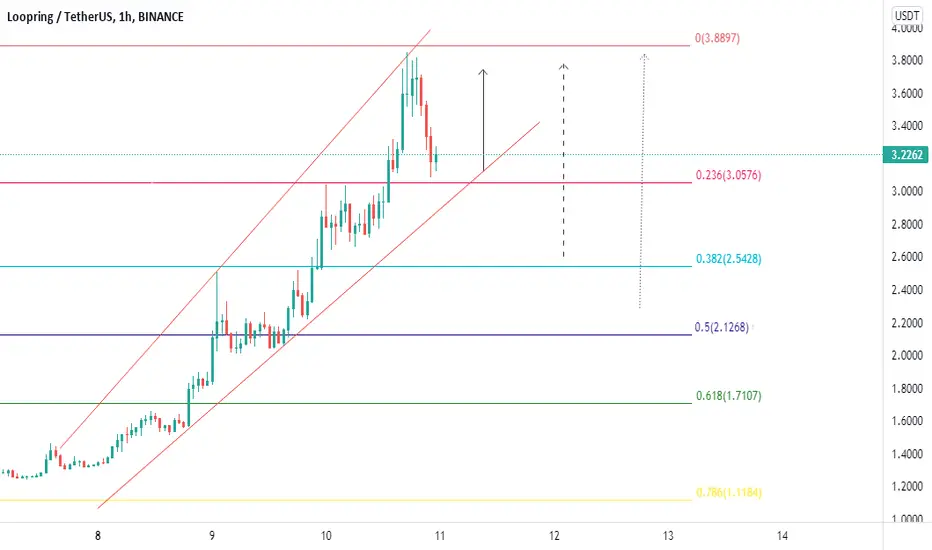
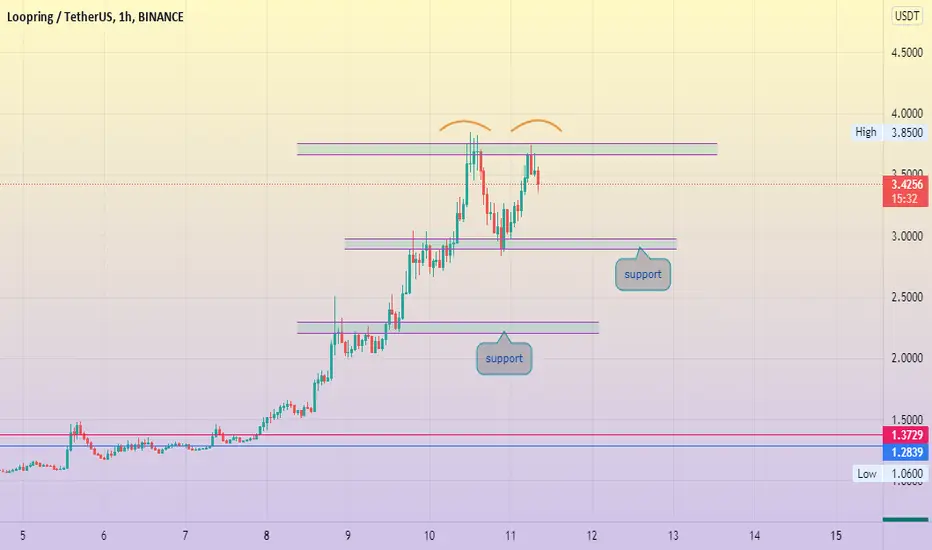
LRC key levels to keep an eye on on shorter time frameLRC has made massive move in past few days so levels we are looking for correction are mentioned in the chart. If it holds on these levels it may make more up moves from these key levels. these levels are to be looked for shorter time frame
key levels are:
3.05
2.54
2.10
1.70