LRCUSD is rubbing her eyes - Update on LRCUSD• LRCUSD’s recent price action has been enlightening. This is just an update.
• Some background and FA first. As BTCUSD crossed her 1.618 Fib of the crypto winter before this bull run, besides DCAing BTC, I started hunting for altcoins to fill my bag in preparation for the eventual ETH pump towards the end of this bullrun. ETH is a much safer investment than altcoins, and the potential ROI makes much more sense than BTC, so my overall strategy is to buy alts related to ETH during the dip, and then swing to ETH when the latter breaks key resistance levels towards the end of this bullrun. ETH is an excellent technology, but current gas prices are exorbitant. LRC’s zkRollup Layer2 helps solve this issue and path the way for ETH’s eventual pump. It was a no brainer to fill my bag with LRC in Jul’21.
• Anyway, back to TA, a brief summary.
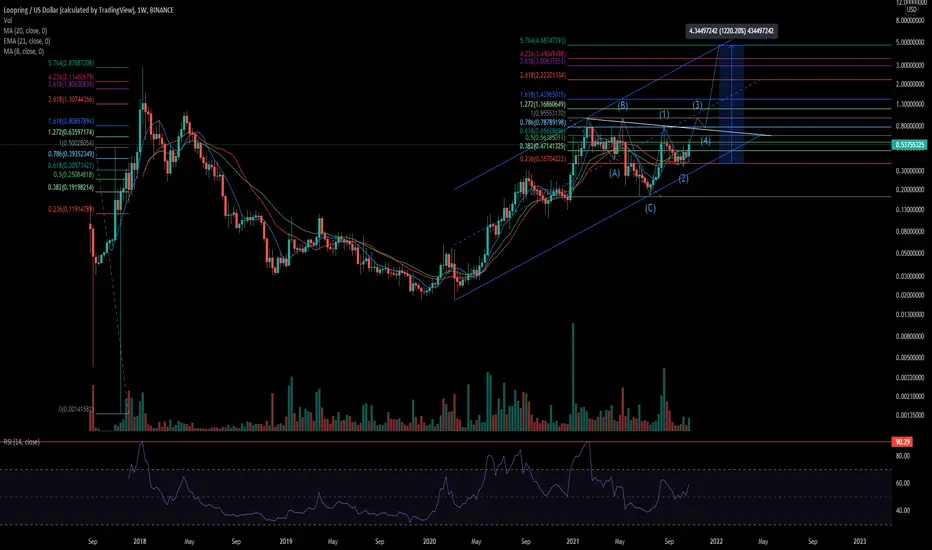
• LRCUSD reached her peak during the previous bullrun at the 5.764 Fib level measured from top to bottom of her mid-cycle consolidation phase.
• *Assuming* LRCUSD will not dump to 0.17ish levels again, the 5.764 Fib level measured from the LRCUSD’s 1st peak to the bottom of her mid-cycle consolidation phase will bring us to approximately $4.5.
• LRCUSD has been in a parallel channel since Mar’20. *Assuming* LRCUSD reaches $4.5 and *assuming* this will be reached at the topline of this parallel channel, $4.5 will be reached around 14 Jan’22. This aligns with my gut sense that this bullrun will end by Mar’22 and the observation that LRCUSD leads the market, peaking before BTCUSD and ETHUSD (the latter reason is yet another good reason to invest in LRC and then swinging to ETH).
• LRCUSD’s recent price action has been interesting. She does not acquiesce herself to momentum indicators that well (or maybe I’m just bad at short-term trading), but she has obeyed Fib levels quite well. *Assuming* LRCUSD does not dump below the 1.618 Fib level of $1.05, and *assuming* we have just witness Wave 4, the 5.764 Fib level from top to bottom of Wave 4 will bring us to $4.9, a level very near the previous $4.5. *Assuming* LRCUSD reaches $4.9 at the topline of the parallel channel will bring us to LRCUSD reaching this level at around 6 Feb’22, which is reasonable given our assumptions regarding LRCUSD leading and this bullrun ending by Mar’22.
• Watch RSI levels too. It is not surprising that LRCUSD is consolidating after hitting a daily RSI of 90%, as she has done so throughout her history. However, LRCUSD’s price action has always been extremely violent, and it is too risky to engage in short-term trades (or at least if you are as bad as short-term trades as me). Trade macro, and hodl till LRCUSD reaches she reaches weekly RSI of 90%, where LRCUSD historically peaks during her bullrun.
• In summary, **the range of $4.5 by 14 Jan’22 to $4.9 by 6 Feb’22 gives us something to shoot for, **watch the weekly RSI level of 90% to swing to ETH, and **this thesis is needs updating if LRCUSD breaks below $1.05, or **LRCUSD breaks the trendline linking her peaks on 12 Feb'21, 12 May'21 and 29 Aug'21, or **LRCUSD breaks below $1.05, or **LRCUSD breaks below the parallel channel.
Lrcusdt
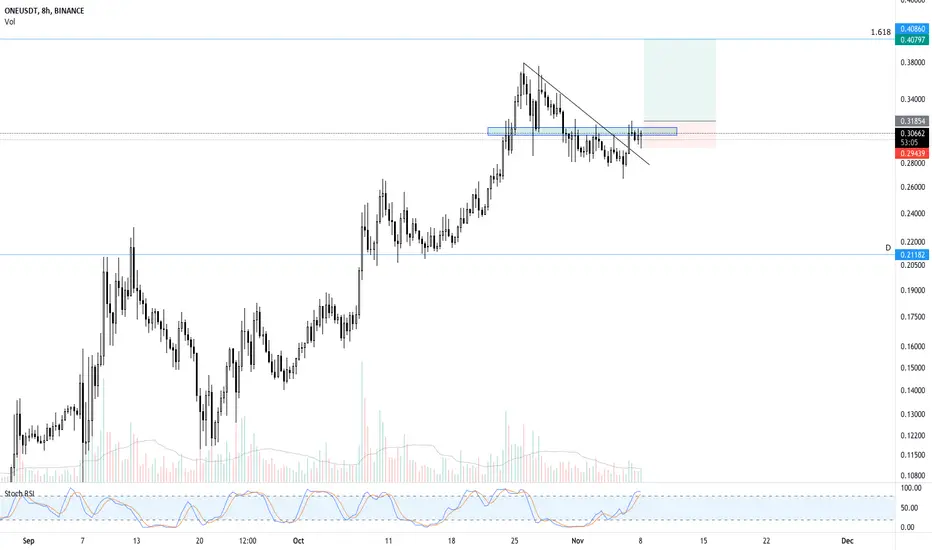
ONE READY TO MAKE A MOVEONE has been extremely bullish lately, pushing higher highs every few days. We have a triangular flag that is testing a breakout currently. Take profit @ 1.618 fib
Cup and Handle IdeaLet it pull back to the red line...which is the spike of the upward price of the cup... lets see how it plays out....bold strategy cotton!

lrcusdt flag 190%Another cripto in flag pattern, LRC.
Flags when broken upside aim the same target at it first pump, in that case 190% or at least 40%, as the size of the triangle.
Macd are also trying to perform an up trend.

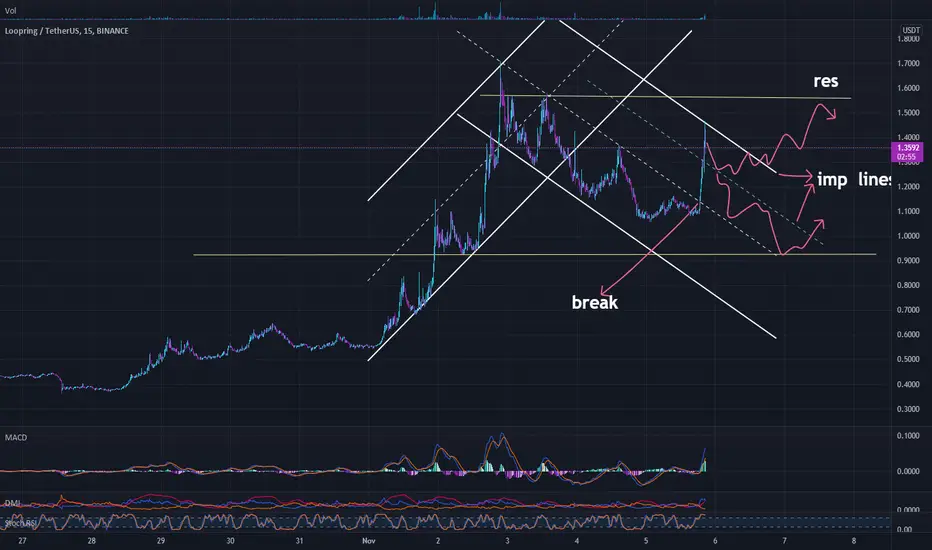
SHORT or LONG LRC by these linesI know 2 direction ideas don't get likes or views ,but u can fallow them and mould trade according to path
if it helped you anyway , please share : ) NFA
The best place to buy LooperingFriends I think LRC is in a good place to buy around 1.06 and if it breaks the trend line upward it can go more

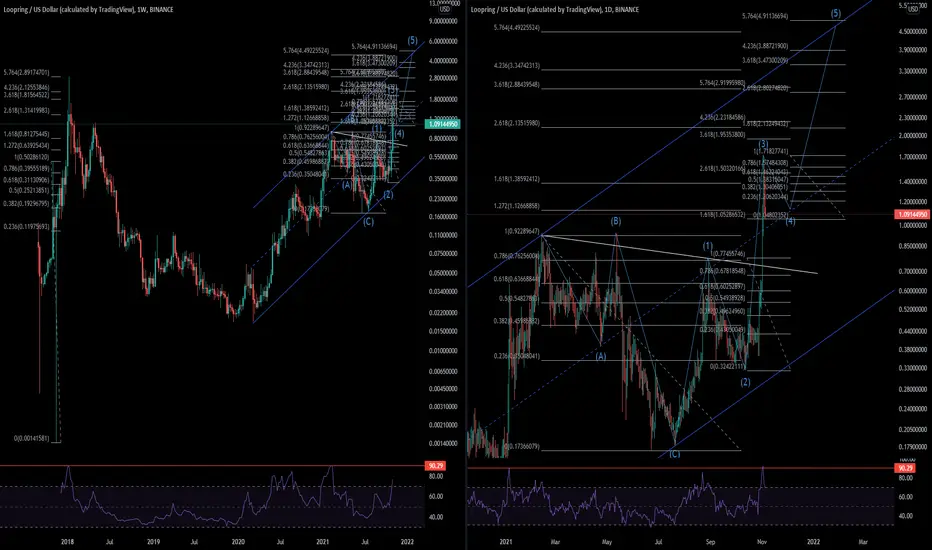
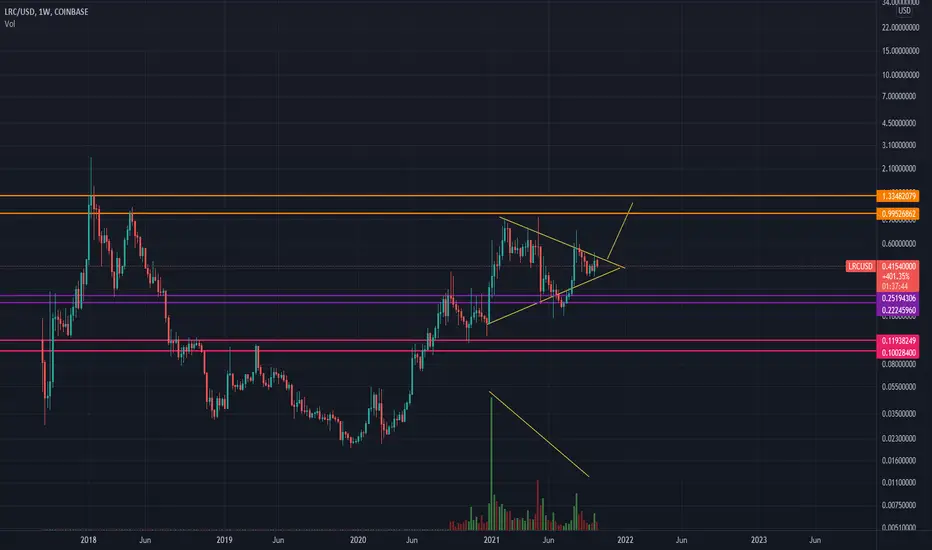
Time for sleeping LRCUSD to wake up• Just a chart to show the similarities between this and the previous bullrun for LRCUSD.
• LRCUSD has been in a parallel channel on the weekly since Mar’20.
• LRCUSD reached the top of this channel in Feb’21, and its bottom in Jul’21.
• Using the same fib levels, and similarly applying from peak of bullrun phase 1 to bottom of mid-cycle consolidation phase, the same fib levels hit the top of the channel at approximately the same time (alts-ETH) are projected to peak.
• Hodl till $4.34 for up to a 12X potential.
• Watch weekly RSI; volume should pump when weekly RSI hits ~70.
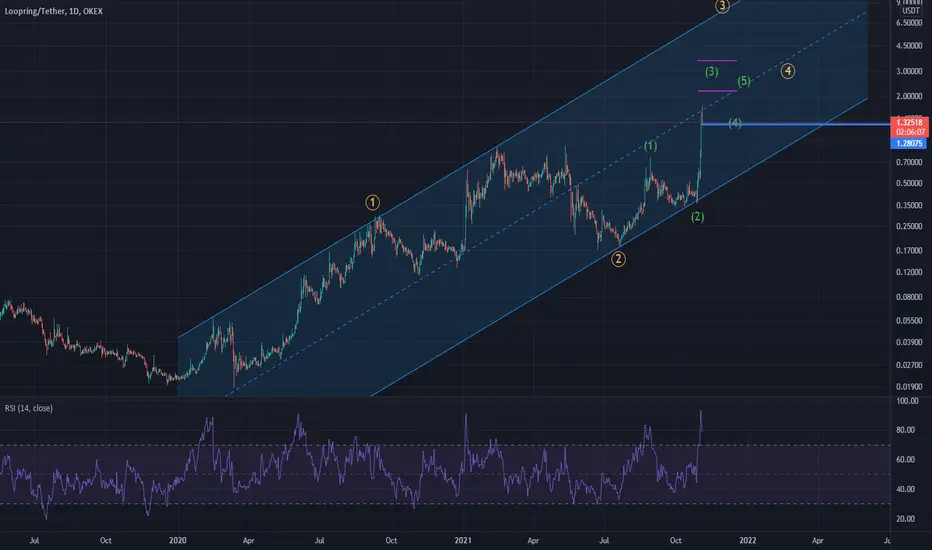
LRC still has a long way to goIt seems that Wave 3 is not over yet, and after that we will reduce the price, and then Wave 5 will start.
LRC entryGood entry point if you're looking to get in/long.
Nov 5th is supposedly the date for the news drop on the GameStop nft exchange built on loopring.

LRCUSD SHORTWe point out the spot to buy. Now is time to sell. LRCUSD SHORT after 70% up in the last 24h
LRC Range breakout ? LRC has been in range for pretty much the whole year between 1$ area and 20ct.
Today it seems that prices are going for a break of this range, the MACD in Daily and Weekly are supporting for this plans.
I would wait here to confirm the breakout with closure of daily candle and then wait for a consolidation with prices finding support of the 1$ area.
To me, in my opinion it is too late for buying here as entries were well bellow current prices. But the setup looks good and have some great potential with 1st higher target at 2$. Aggressive traders could take a long here to play the momentum.
If not already in the market we'll need some patience before going long, for the ones already in, enjoy the ride and don't sell for now if you have mid to long term plans.
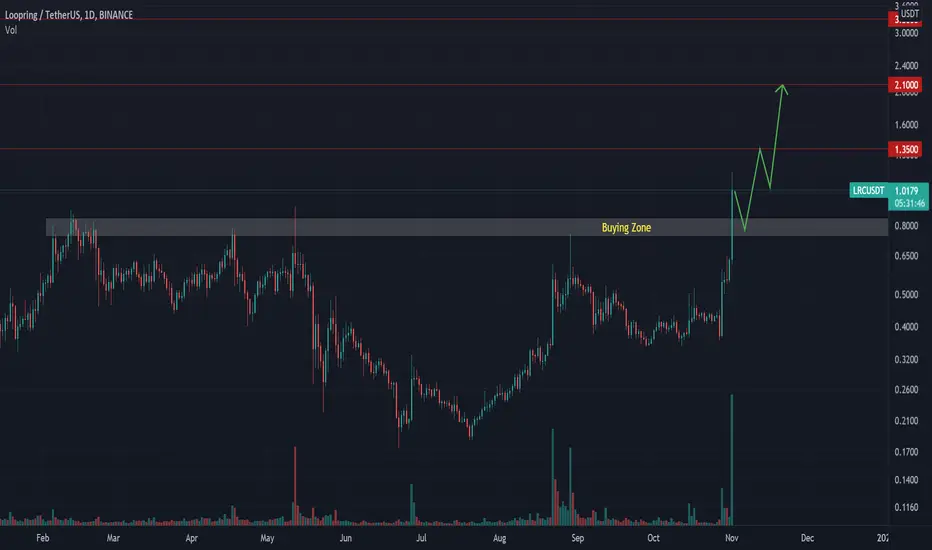
LRC USDT Long SetupLRCUSDT just made New All-Time Highs
Now expecting a slight dip to buying zone for next upper targets
Big Volume coming in
Ode to the LRCIt's not quite 1993 yet and this dog looks hungry.
Possible breakout occuring and we could see a good upside in trade of a widening formation with a cup and handle.

LRCUSDT long* I was toying with this chart and teaching my 9yo daughter the relationship between chart patterns and market psychology yesterday. Unfortunately, I did not publish my idea prior to the pump. Well...
* This pump may be the result of Loopring releasing news relating to Layer-2 NFTs. More news to be released soon.
* Anyway, LRCUSDT has broken out of the ascending parallel channel, forming both a potential inverse H&S and a cup and handle. Confluence and the levels align very nicely with the fib levels.
* Those who bought in near the bottom of the ascending parallel channel can take profits now.
* Or do so upon completion of the confluent inverse H&S and cup and handle.
* I personally favour the latter approach.
* Of course, nuch depends on DXY (see linked idea).

LCR USDT 1D - Binance FuturesPossible formation of a Cup & Handle pattern. Right now the price seems to be testing and preparing for a break out. I'll wait for the re-test to LONG. Taking profits on Fib Level 161.8%

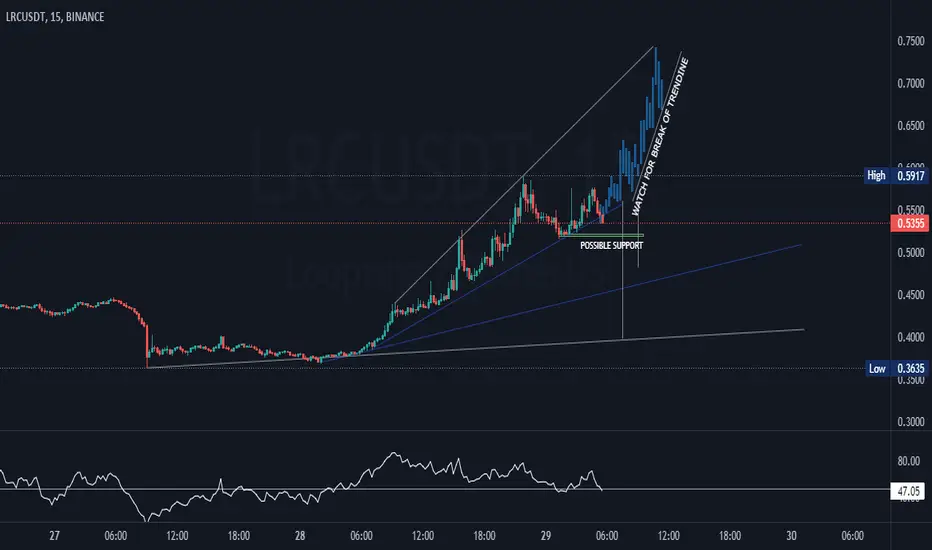
LRC LONG OR SHORT??LRC at crossroads currently . Watch for a break of currentline for a short position.
However could find horizontal support at 0.52.
That said I expect a punt toward new local highs of 0.65+ before opting for a short.
Hope this helps you out.
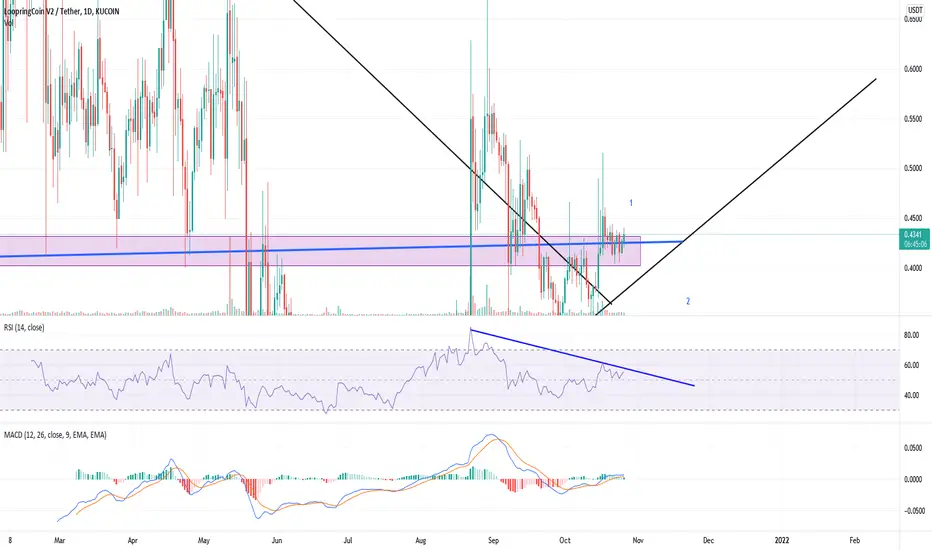
LRC/USDT IN KUCOINHi
You can buy in the first step after breaking the trend line in RSI
I hope you make a good profit and fluctuate
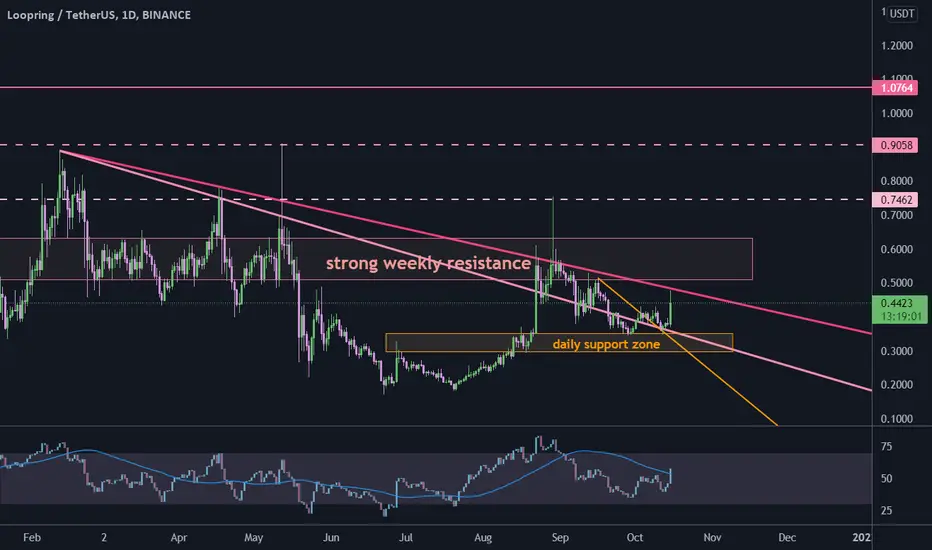
LRC to $1#LRCUSDT
$LRC broke out from a short term descending resistance line and hold above a daily support zone. if price close a weekly candle above the last descending resistance, $0.74, $0.9 and maybe $1 can be take profit targets.
LRC falling wedge breakoutThe price broke out of the formation and is currently consolidating on an important level (0.4066). Claiming this level should trigger more buying pressure.
-- NOTE: In general altcoins started to be more sensitive to bitcoins moves which means some sort of uncertainty came to the market --
TP: 0.4845 (~20%)
TP2: OPEN++
SL: 0.3765

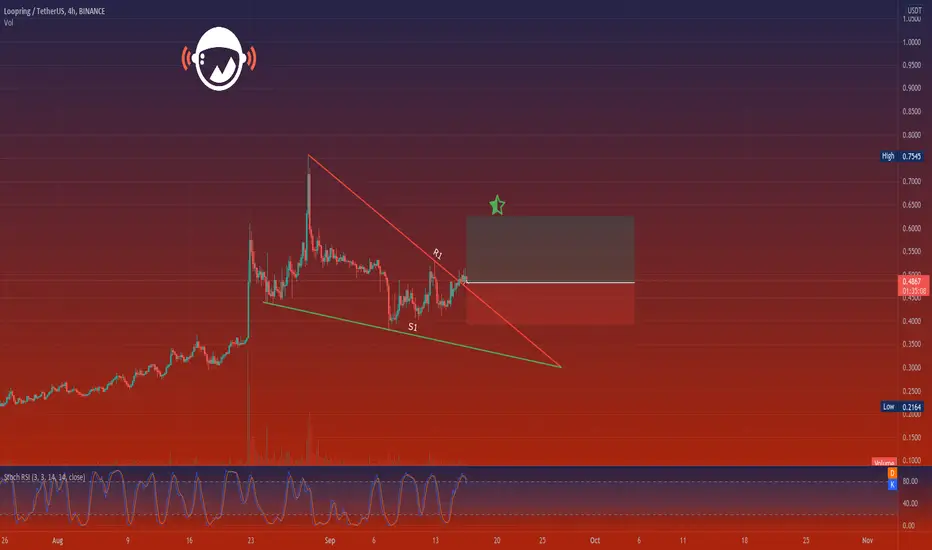
LRCUSDTHello Crypto Lovers,
Mars Signals team wishes you high profits.
We are in a 4-hour time frame.
Currently, the price is fluctuating inside an ascending triangle and has broken the resistance ahead, and is fluctuating above the line.
If it can be fixed above the line, it can touch our target over time.
But if it can not move up and penetrate below our resistance line, we consider a fall.
Warning: This is just a suggestion and we do not guarantee profits. We advise you analyze the chart before opening any position.
Wish you luck
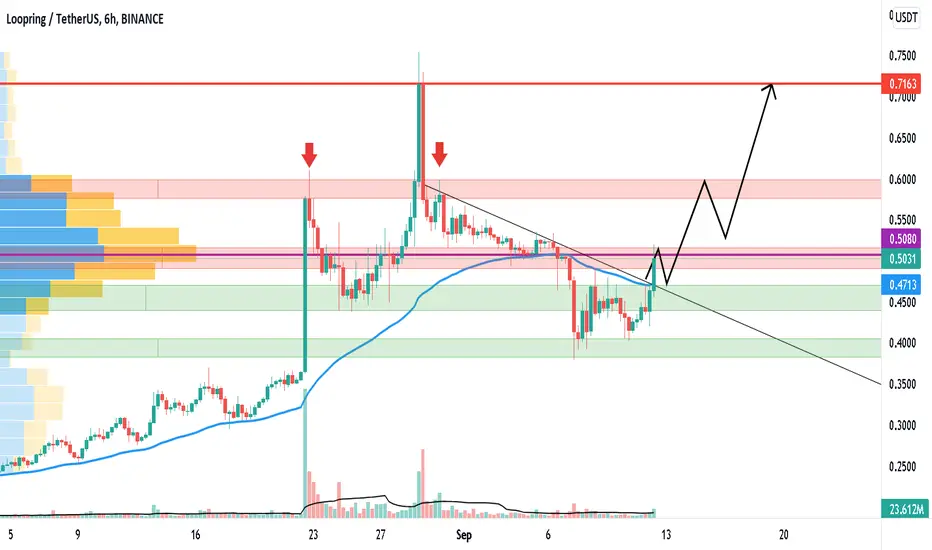
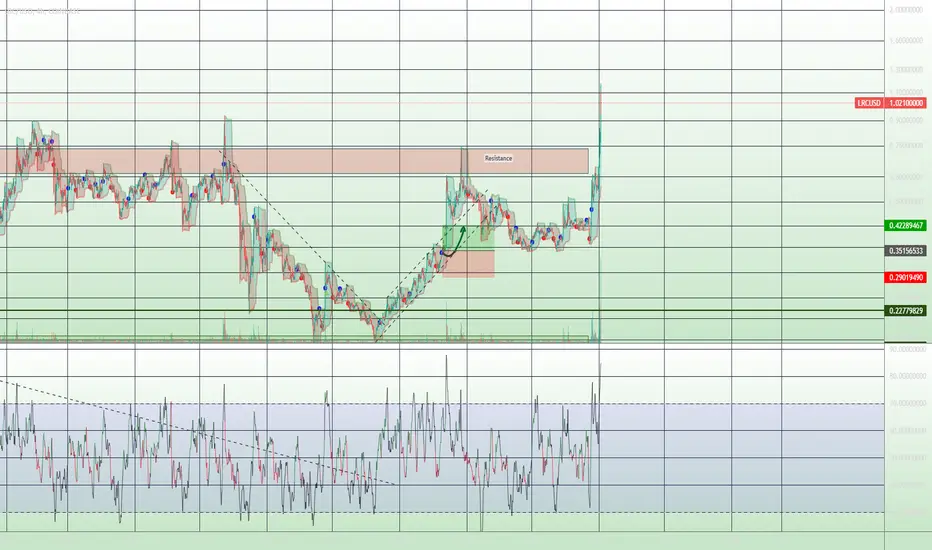
LRC > Time to bounce-back? > Support & ResistanceHello Friends,
Hope you all are having a thrill in your trading journey.
I am presenting you my analysis of LRC.
According to my technical analysis, LRC is going to reach its next Resistance Zone(Potential target). Now, we are expecting a fall to support zone and a rise!
"My analysis is valid until We don't see a breakout from support zone"
I hope my analysis is pretty clear to you guys.
Kindly do your own research and follow proper risk management.
Feel free to share your views in the comment section. Like and Follow!
Best Regards,
Shaswat Naman
TradeThrill, India🇮🇳
Disclaimer: The analysis provided is purely informative and it should not be used as financial advice. Remember that you need a plan before you start trading; so, take this knowledge and use it as a guidebook that will ultimately help you understand the market and easily predict your next move.

LRC LOOKS AUSPICIOUS LRC has managed to break above the descending trend line that is designated in black. POC aligns perfectly with the resistance zone, and I expect a retest of the trendline to confirm an upward movement. Volume has declined in a significant way. In order for LRC to scale higher, more liquidity must flow in. Resistance levels are designated in red and support levels in green.