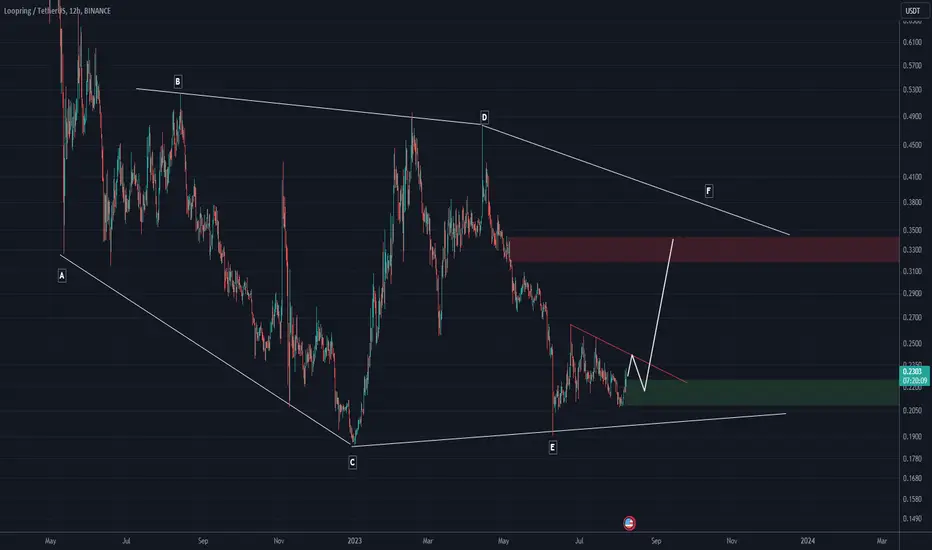
LRC LOOKS BULLISH (12H)Hi, dear traders. how are you ? Today we have a viewpoint to BUY/LONG the LRC symbol.
For risk management, please don't forget stop loss and capital management
When we reach the first target, save some profit and then change the stop to entry
Comment if you have any questions
Thank You
Lrcusdt
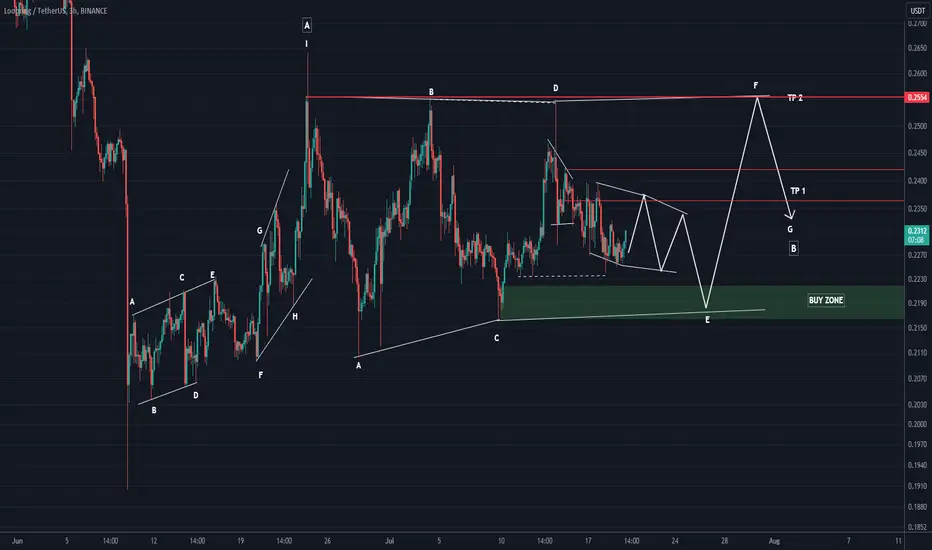
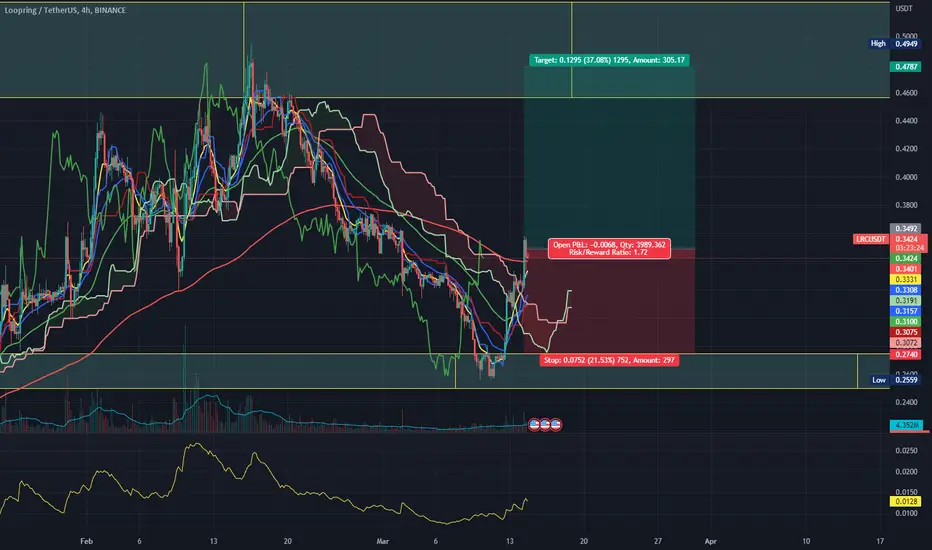
LRC ANALYSIS (4H)Hi, dear traders. how are you ? Today we have a viewpoint to BUY/LONG the LRC symbol.
For risk management, please don't forget stop loss and capital management
When we reach the first target, save some profit and then change the stop to entry
Comment if you have any questions
Thank You
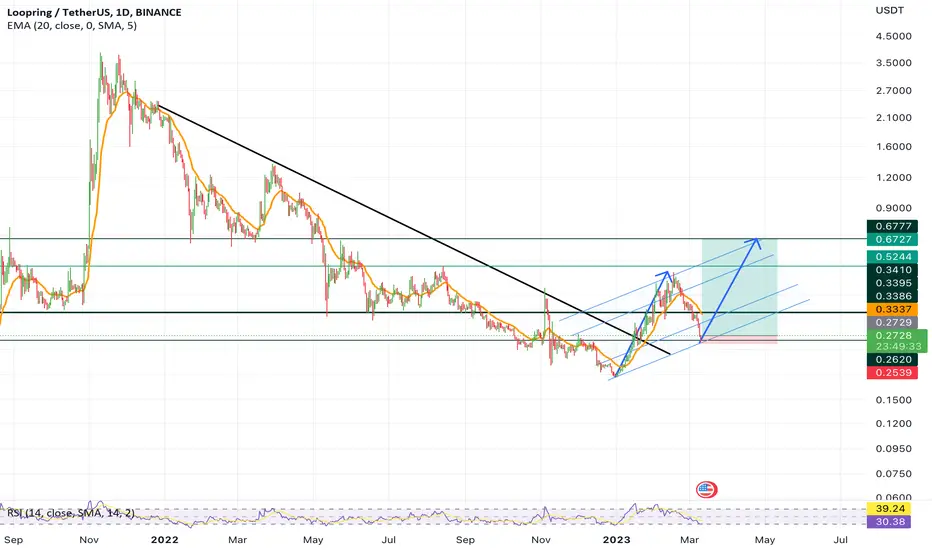
LRC bullish momentum time to buy? 👀 🚀loopring today analysis💎LRC is making an impressive move as it has recently broken out of the channel and is primed for a bullish surge.
💎It's on the verge of trading above the 50 EMA. If it maintains its momentum above this EMA, we can anticipate a strong bullish move. The fact that it's trading in a high-demand area is a significant factor that can't be overlooked.
💎Another point to consider is the box. If the price breaks through this box, we may no longer be in an upward trend.
💎In the dynamic world of crypto, staying informed and adaptable is key. Stay tuned for more updates and enjoy your trading journey

Crypto LRC , Long TF H1, TP = 0.2932On the hour chart, the trend started on May 25 (linear regression channel).
There is a high probability of profit. A possible take profit level is 0.2932
But do not forget about the SL = 0.2744
Using a trailing stop is also a good idea!
Good luck!
Regards, WeBelieveInTrading

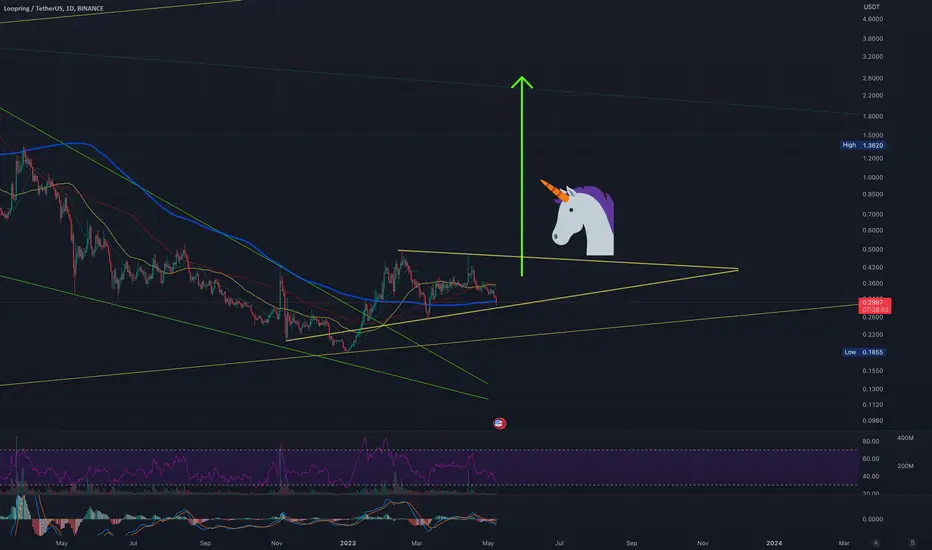
Loopring (LRC) patter with unicorn parabolaLoopring looks promising, if it hold triangle we can see 1-2USD price june unicorn number 2. it is more wish than prediction.
Loopring token (LRC) forming bullish Cypher for upto 71.50% pumpHi dear friends, hope you are well and welcome to the new trade setup of Loopring token (LRC) with Bitcoin pair.
Recently we caught almost 50% pump of LRC as below:
Now on a daily time frame, POEPLE with LRC pair has formed a bullish Cypher move for next price reversal.
Note: Above idea is for educational purpose only. It is advised to diversify and strictly follow the stop loss, and don't get stuck with trade

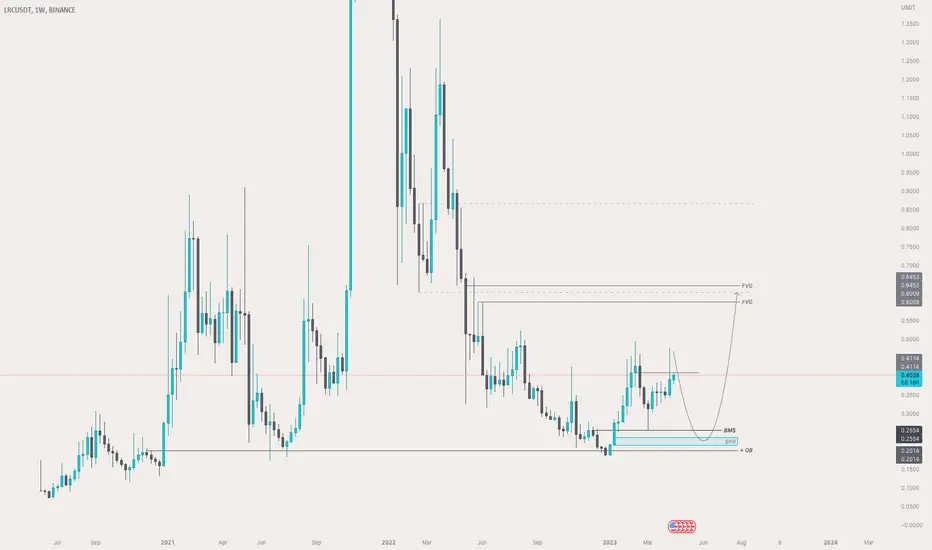
LRC Weeklyif we have lucky before major upside movement,
a retracement to $0.25~$0.22 be a good entry point to reach $0.62.
Lrc next Target 0.45 and 0.580.37 resistance breakouts successfully, current target is 0.45. If 0.45 breaks then final target will be 0.58
Below the red trend line is risk. Price will not pump soon if it goes below the red trend line.

Trend Continuation Idea 🤖 Multi-timeframe Technical Analysis:
D1 Bounced off strongly from key support level that holds the uptrend within the ranging market.
H4 Ichimoku Kumo Breakout destroying downtrend structure signaling the start of a potential reversal to the upside which goes along with Daily Timeframe trend and structure.
Key Areas
Key Support area: 0.2748 - 0.2493 (Potential Entries)
Key Resistance area: 0.4558 - 0.5243 (Potential Targets)
Please make sure to check brokers slippage along with trading fees for you to accommodate if the trading signal is useful for you or not.
Do not risk entire portfolio on a single trade. Remember market is king!
Stay healthy and happy trading!
LRC LONG SETUP (HOT PROFIT)Hi, dear traders. how are you ? Today we have a viewpoint to BUY/LONG the lrc symbol.
For risk management, please don't forget stop loss and capital management
When we reach the first target, save some profit and then change the stop to entry
Comment if you have any questions
Thank You

LRCUSDT time to buy has arrivedLRC is looking very strong compared to most coins. We belive that this is the time for investors to start looking at it. Our upside target is very conservative, but the price can jump so much higher...

LRCUSDT: LONG SETUPLRC is currently moving in a bullish channel,
It tested its down trend line.
I am expecting a huge bullish move toward my target which is a measure move of second leg
Its BTC pair is also at strongest support level.
There might be some up and down,
But lets see

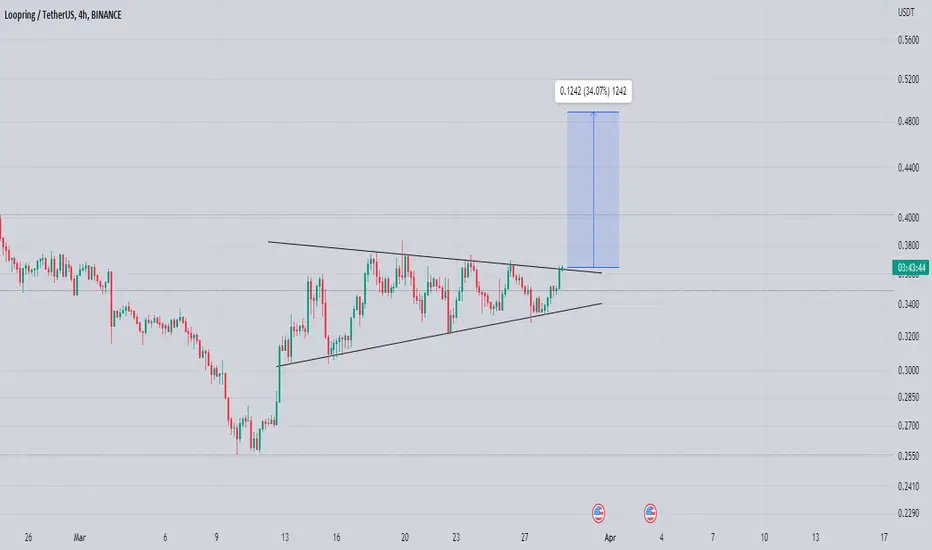
Lrc Breaking bullish pennant Formed Bullish Pennant In h4 timeframe Incase Of breakout expecting 30 to 35% bullish Move
Look For buying Opportunities After breakout
LRC/USDT RISING WEDGEThe price chart in 1H TF showing a rising wedge and bearish divergence, looks like it is very close to enter our plan.

LRCUSDT IdeaPOLONIEX:LRCUSD BINANCE:LRCUSDT
✅ ✅ Risk warning, disclaimer: the above is a personal market judgment and analysis based on published information and historical chart data on The trading view,
And only some of these analyzes are my actual real trades.
I hope Traders consider I am Not responsible for your trades and investment decision.
The rise of wave four or wave CThe currency has completed a three-wave decline, A, B, and C, or a five-wave decline, and a fourth and fifth wave remains, and this is what we will know with more data that will appear later.

LRC: Pullback in UptrendLoopring (LRC) technical analysis:
Trade setup: Following a bullish breakout from Falling Wedge pattern, price reached our target $0.50 where it got rejected. Pullback near $0.30 support and 200-day moving average could be a swing entry. Momentum is inflecting bullish again (MACD Histogram rising).
Trend: Downtrend on Short-Term basis, Neutral on Medium-Term basis and Uptrend on Long-Term basis.
Momentum is Bearish but inflecting. MACD Line is below MACD Signal Line and RSI is below 45 but momentum may have bottomed since MACD Histogram bars are rising, which suggests that momentum could be nearing another upswing.
Support and Resistance: Nearest Support Zone is $0.30, then $0.20. The nearest Resistance Zone is $0.40, then $0.50.

Loopring token (LRC) forming bullish Cypher for upto 46% pumpHi dear friends, hope you are well and welcome to the new trade setup of Loopring token ( LRC ) with US Dollar pair.
On a daily time frame, LRC is about to complete the final leg of a bullish Cypher move.
Note: Above idea is for educational purpose only. It is advised to diversify and strictly follow the stop loss, and don't get stuck with trade

LRCUSDTHello Crypto Lovers,
Mars Signals team wishes you high profits.
This is a 4-hour-time frame analysis for LRCUSDT
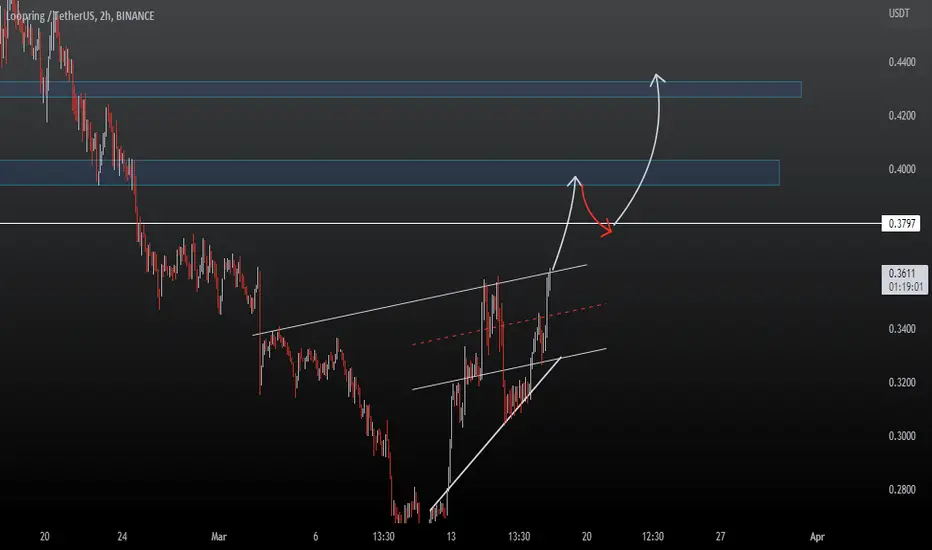
In the current chart, R3 used to a support area. R1 is the resistance area which contains the unsuccessful attempts of price to rise. S1 used to be a resistance line. And S2 is our support line at the bottom with its well support of price at several points. Presently, the price was able to have a noticeable rise and touch S1 and then by having a falling trend, it could break S1 upward and now it is fluctuating over it. We will predict the price to give us some rising signs and an increase is waiting for it to touch R1 besides the activation of the long position of our chart. Or even by not being supported, more fall would take place for the price downward to lower amounts. We recommend you to have every piece of information and idea via our analyses for receiving more profitable trades.
Warning: This is just a suggestion and we do not guarantee profits. We advise you to analyze the chart before opening any positions.
Wish you luck
lrcusdtWe have a support at the specified level. We have to see how the reaction to this level will be
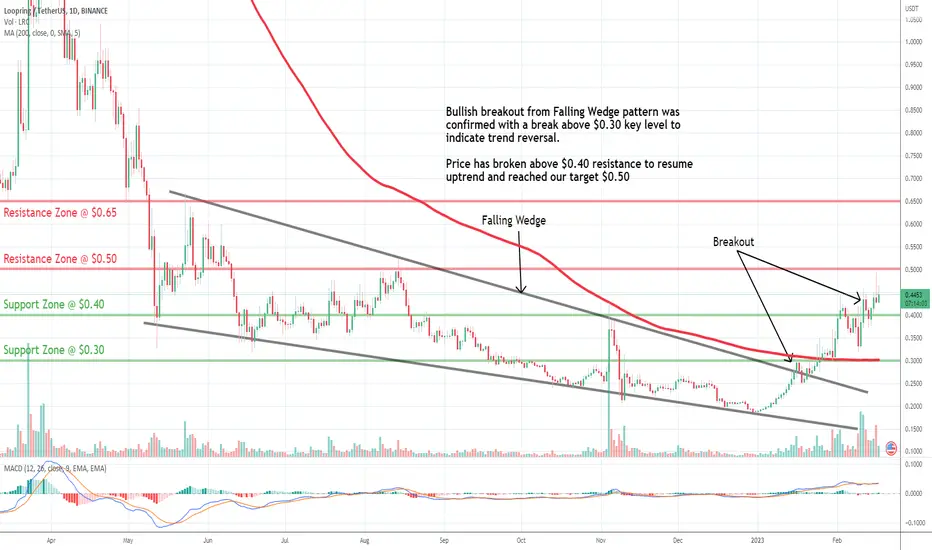
LRC: Approaching ResistanceLoopring (LRC) technical analysis:
Trade setup : Bullish breakout from Falling Wedge pattern, was confirmed with a break above $0.30 key level to indicate bullish trend reversal. Price broke above $0.40 resistance to resume uptrend and reached our target $0.50. Now we wait for price to either 1) break above $0.50 to resume uptrend, or 2) pull back near $0.40 support for a swing entry in uptrend.
Trend : Uptrend across all time horizons (Short- Medium- and Long-Term).
Momentum is Bullish (MACD Line is above MACD Signal Line and RSI is above 55).
Support and Resistance : Nearest Support Zone is $0.40 (previous resistance), then $0.30. The nearest Resistance Zone is $0.50.
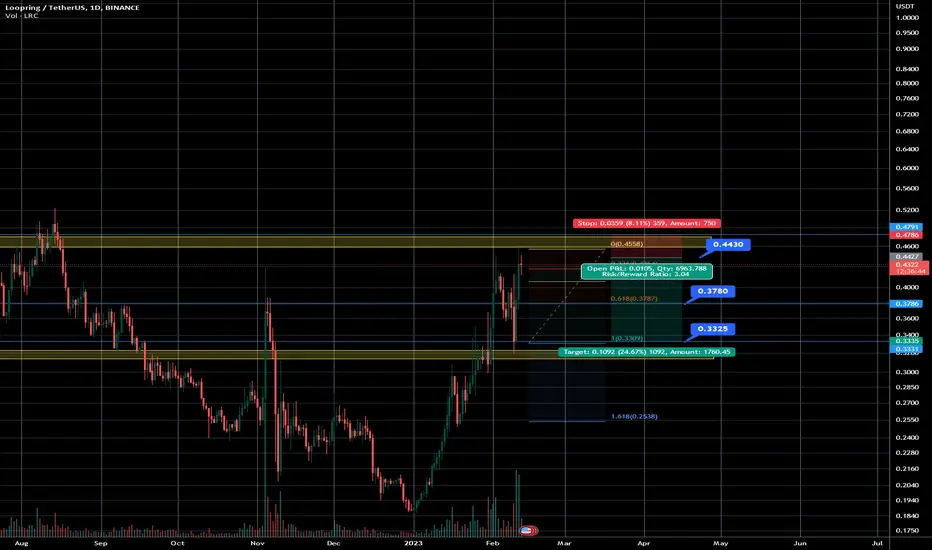
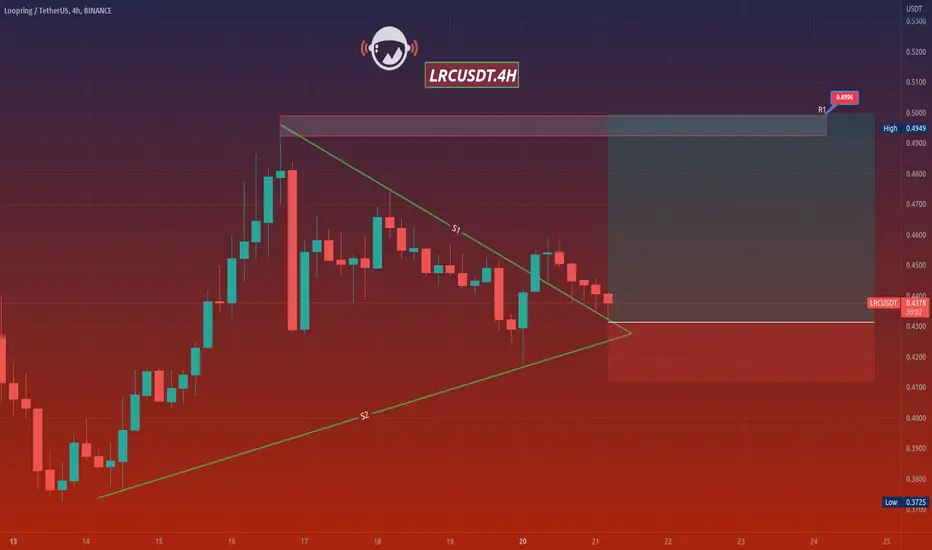
Let's see the LRC/ SHORTWhat do you think about LRC? The market looks bad, and the price is also reacting well to the resistance line around $0.46. We can expect a price decrease to the area ~ $ 0.33
All positions on the chart.
This is not a financial recommendation.
BUY ~ 0.44$
1TP ~ 0.378
2TP ~ 0.3325
SL - 0.479