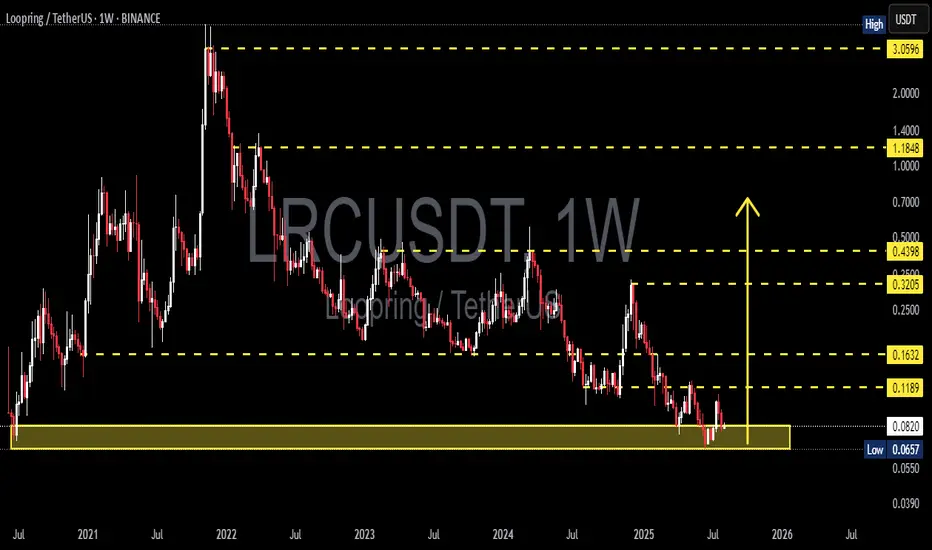
LRC/USDT 1W – Final Test Before a Major Reversal?> Loopring (LRC) is currently sitting at a critical long-term support zone, and the next few weeks could determine whether a strong reversal or deeper decline will follow.
---
🧠 Macro Overview:
After falling more than 97% from its all-time high (ATH) of $3.0596, LRC is now revisiting a historical demand zone between $0.0657–$0.0821. This area has acted as a powerful launchpad during previous cycles and remains a major accumulation zone.
---
🔎 Technical Structure & Price Action:
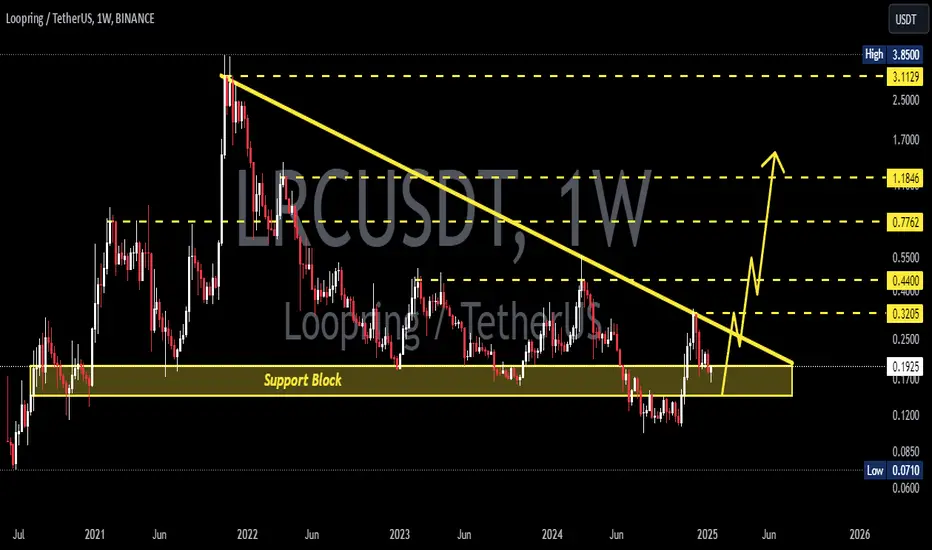
✅ Historical Demand Zone (Strong Support)
Marked by the yellow box, this range has historically triggered major price rallies.
Buyers have consistently stepped in at this level since early 2021.
✅ Possible Double Bottom Formation
A potential double bottom pattern is forming in this zone. A breakout above $0.1189 would confirm the bullish reversal structure.
✅ Low Volume = Volatility Brewing
Current low-volume environment could indicate quiet accumulation before a potential breakout.
✅ Weakening Downtrend
The multi-year downtrend is still intact, but the selling momentum is fading as price consolidates in this key support area.
---
🟢 Bullish Scenario (Reversal or Relief Rally):
1. Price holds and bounces from the $0.0657–$0.0821 demand zone.
2. Breakout above $0.1189 (initial resistance) opens the door for:
🎯 $0.1632 – First key resistance.
🎯 $0.3205 & $0.4398 – Mid-term resistance levels.
🎯 $1.1848 – Long-term recovery target if altcoin momentum returns.
> A weekly candle close above $0.1632 with strong volume would confirm the bullish trend shift.
---
🔴 Bearish Scenario (Support Breakdown):
1. A breakdown below $0.0657 would invalidate the support zone.
2. Potential downside targets:
⚠️ $0.0550 – Psychological support.
⚠️ Uncharted territory below $0.0550 could trigger panic selling and deeper declines.
> In this case, strict risk management is essential, as breaking this zone may lead to a fresh leg down in price discovery.
---
📈 Strategy & Outlook:
Short-term/Swing Traders:
Consider speculative entries within the support zone with tight stop-losses below $0.0657.
Wait for a confirmed breakout above $0.1189–$0.1632 for trend validation.
Long-term Investors:
This zone presents a compelling Dollar-Cost Averaging (DCA) opportunity with high reward potential.
However, maintain capital discipline in case of deeper downside risk.
---
💡 Conclusion:
> LRC is at a make-or-break level.
If this historical support holds and volume kicks in, we could be witnessing the early signs of a major weekly reversal.
But if the support fails, it may enter a new bearish phase with further downside.
#LRCUSDT #Loopring #AltcoinReversal #CryptoSupportZone #CryptoAnalysis #TechnicalAnalysis #SwingTradeSetup #BearishOrBullish #LRCChart #CryptoOpportunities
Lrcusdtanalysis
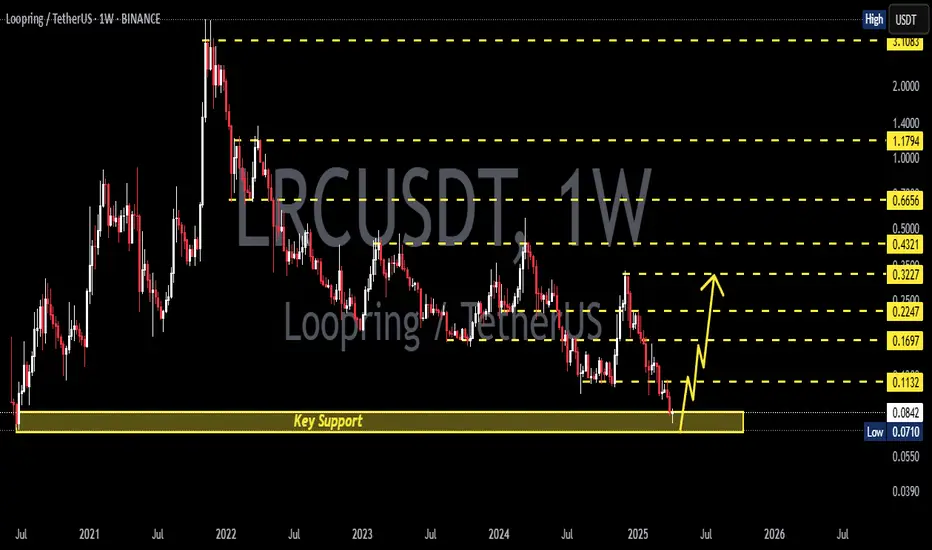
LRCUSDT 1WLRC ~ 1W Analysis
#LRC This is the lowest support at this time, maybe you can consider starting to buy back from here with a short -term target of at least 15%+
LRCUSDT 1WLRC ~ 1W Analysis
#LRC If you still have a Conviction on this coin. Maybe you can consider this support to start buying back from here with a minimum target of 20%+.
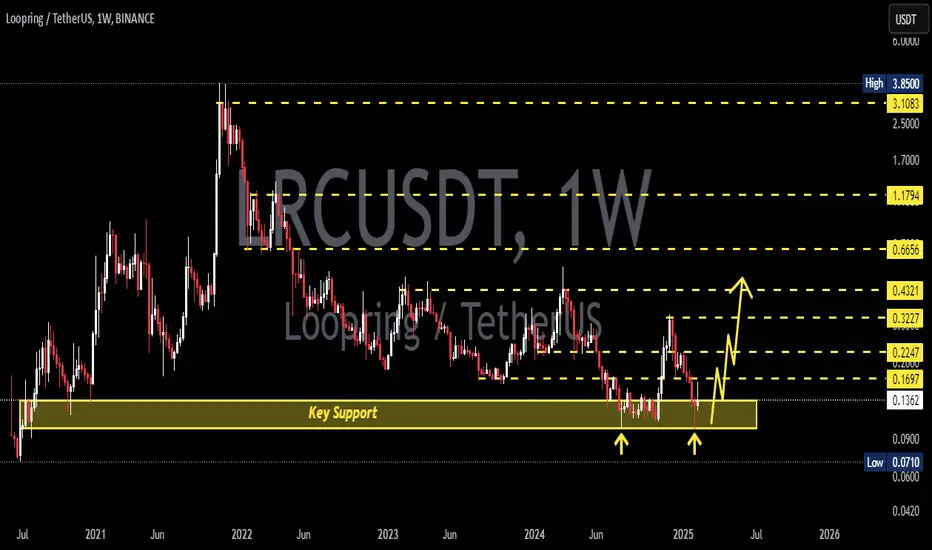
LRCUSDT 1WLRC ~ 1W
#LRC If you still have Conviction on this coin,. Don't miss this trade, Buy and take profit of at least 20%+
LRCUSDT 1WLRC ~ 1W
#LRC If you still have Conviction on this coin,. This support block will be a very good buying spot for now, Buy it gradually with a target of at least 20%++
LRCUSDT 1WLRC ~ 1W
#LRC If you still have Conviction on this coin. buy in stages from here. With a minimum target of 20%+. It is only a matter of time until this resistance line is broken. and bullish will dominate
LRC / LRCUSDTGood Luck >>
• Warning •
Any deal I share does not mean that I am forcing you to enter into it, you enter in with your full risk, because I'll not gain any profits with you in the end.
The risk management of the position must comply with the stop loss.
(I am not sharing financial or investment advice, you should do your own research for your money.)

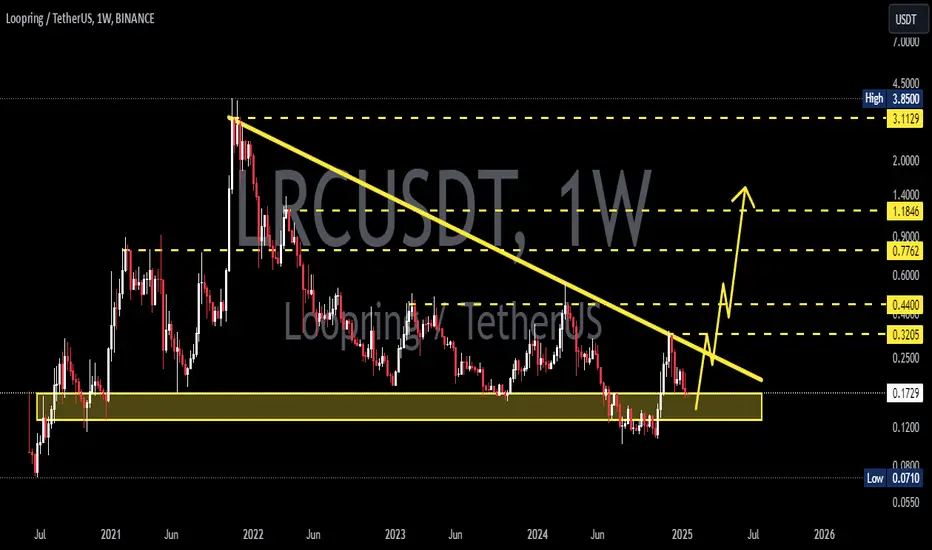
LRCUSDT Analysis (Local Vision)Hello friends.
Please support my work by clicking the LIKE button👍(If you liked). Also i will appreciate for ur activity. Thank you!
Everything on the chart.
Entry: market and lower
Target: 0.7 and 0.8
after first target reached move ur stop to breakeven
Stop: ~0.44 (depending of ur risk). ALWAYS follow ur RM .
Risk/Reward: 1 to 3
risk is justified
Good luck everyone!
Follow me on TRADINGView, if you don't want to miss my next analysis or signals.
It's not financial advice.
Dont Forget, always make your own research before to trade my ideas!
Open to any questions and suggestions.
