LRC/USDT 1W – Final Test Before a Major Reversal?> Loopring (LRC) is currently sitting at a critical long-term support zone, and the next few weeks could determine whether a strong reversal or deeper decline will follow.
---
🧠 Macro Overview:
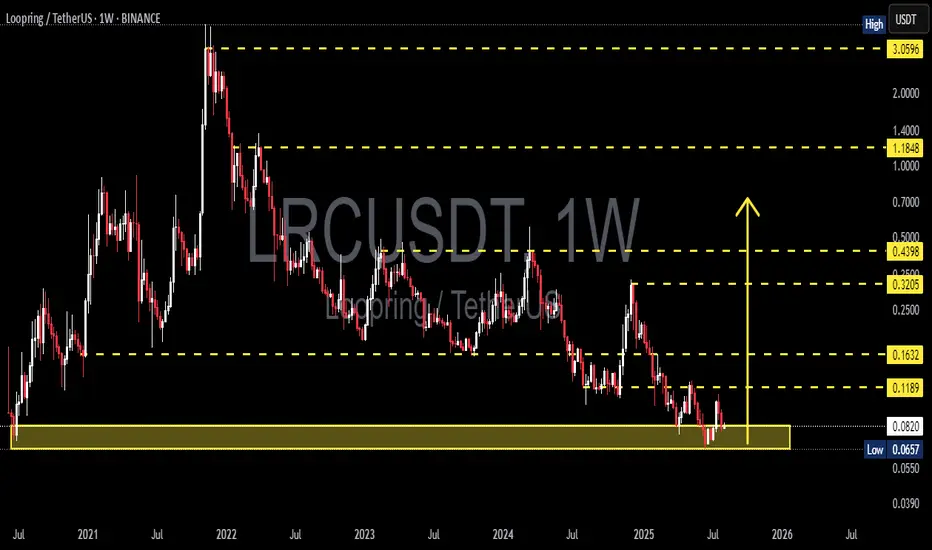
After falling more than 97% from its all-time high (ATH) of $3.0596, LRC is now revisiting a historical demand zone between $0.0657–$0.0821. This area has acted as a powerful launchpad during previous cycles and remains a major accumulation zone.
---
🔎 Technical Structure & Price Action:
✅ Historical Demand Zone (Strong Support)
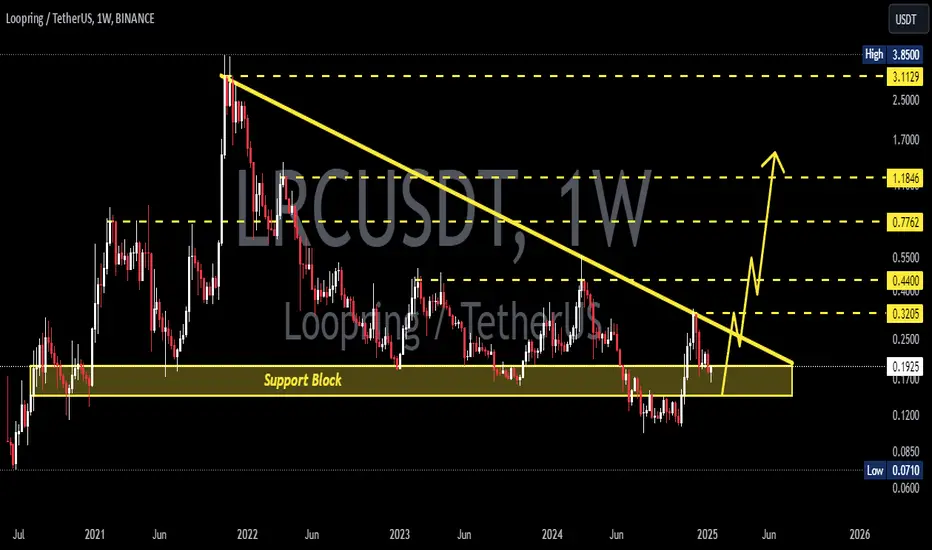
Marked by the yellow box, this range has historically triggered major price rallies.
Buyers have consistently stepped in at this level since early 2021.
✅ Possible Double Bottom Formation
A potential double bottom pattern is forming in this zone. A breakout above $0.1189 would confirm the bullish reversal structure.
✅ Low Volume = Volatility Brewing
Current low-volume environment could indicate quiet accumulation before a potential breakout.
✅ Weakening Downtrend
The multi-year downtrend is still intact, but the selling momentum is fading as price consolidates in this key support area.
---
🟢 Bullish Scenario (Reversal or Relief Rally):
1. Price holds and bounces from the $0.0657–$0.0821 demand zone.
2. Breakout above $0.1189 (initial resistance) opens the door for:
🎯 $0.1632 – First key resistance.
🎯 $0.3205 & $0.4398 – Mid-term resistance levels.
🎯 $1.1848 – Long-term recovery target if altcoin momentum returns.
> A weekly candle close above $0.1632 with strong volume would confirm the bullish trend shift.
---
🔴 Bearish Scenario (Support Breakdown):
1. A breakdown below $0.0657 would invalidate the support zone.
2. Potential downside targets:
⚠️ $0.0550 – Psychological support.
⚠️ Uncharted territory below $0.0550 could trigger panic selling and deeper declines.
> In this case, strict risk management is essential, as breaking this zone may lead to a fresh leg down in price discovery.
---
📈 Strategy & Outlook:
Short-term/Swing Traders:
Consider speculative entries within the support zone with tight stop-losses below $0.0657.
Wait for a confirmed breakout above $0.1189–$0.1632 for trend validation.
Long-term Investors:
This zone presents a compelling Dollar-Cost Averaging (DCA) opportunity with high reward potential.
However, maintain capital discipline in case of deeper downside risk.
---
💡 Conclusion:
> LRC is at a make-or-break level.
If this historical support holds and volume kicks in, we could be witnessing the early signs of a major weekly reversal.
But if the support fails, it may enter a new bearish phase with further downside.
#LRCUSDT #Loopring #AltcoinReversal #CryptoSupportZone #CryptoAnalysis #TechnicalAnalysis #SwingTradeSetup #BearishOrBullish #LRCChart #CryptoOpportunities
LRCUSDTPERP
LRCUSDT 1WLRC ~ 1W Analysis
#LRC This is the lowest support at this time, maybe you can consider starting to buy back from here with a short -term target of at least 15%+
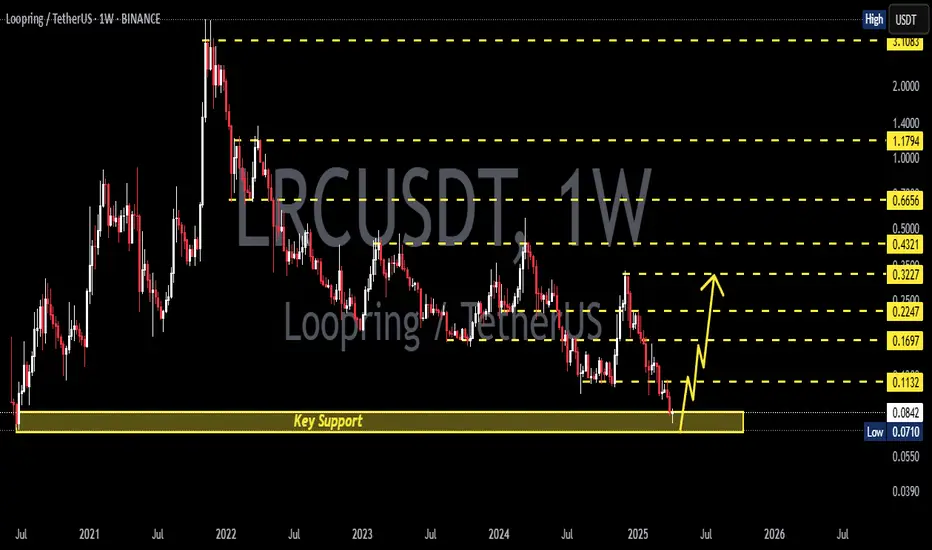
LRCUSDT 1WLRC ~ 1W Analysis
#LRC If you still have a Conviction on this coin. Maybe you can consider this support to start buying back from here with a minimum target of 20%+.
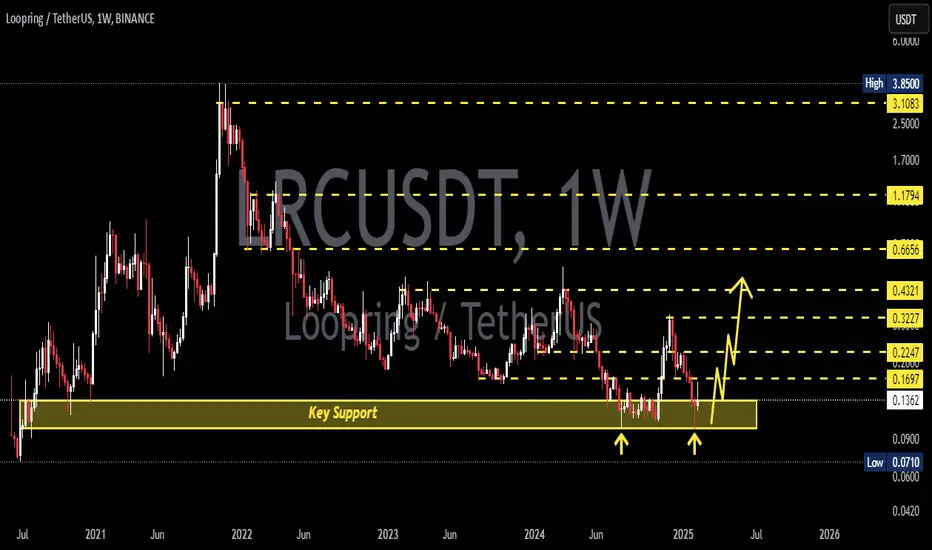
LRCUSDT 1WLRC ~ 1W
#LRC If you still have Conviction on this coin,. Don't miss this trade, Buy and take profit of at least 20%+
LRCUSDT 1WLRC ~ 1W
#LRC If you still have Conviction on this coin,. This support block will be a very good buying spot for now, Buy it gradually with a target of at least 20%++
LRC is Setting Up BIG!Loopring (LRC) is presenting an excellent opportunity with a confluence of technical factors aligning at the old high demand zone. This area holds significant importance as it combines the strength of a multi-tap demand zone with a Fibonacci retracement level, enhancing its reliability for a potential bounce.
Why the Old High Demand Zone is Key
3-Tap Test:
The price has tapped into this demand zone multiple times, signaling its strength as a support level. Each tap reinforces the zone, indicating buyer interest and the likelihood of a reversal from this level.
Historical Significance:
This zone corresponds to a previous high where LRC established strong momentum. Retesting old highs as support is a common bullish continuation pattern, suggesting this area is crucial for price stability.
Fibonacci Confluence:
The demand zone aligns perfectly with a key Fibonacci retracement level (e.g., 0.618 or 0.786). Fibonacci levels are widely respected in the market, making this zone even more attractive for an entry.
Why This Setup Stands Out
High-Probability Reversal: The confluence of factors increases the likelihood of a strong bounce, making it an ideal point to join the trend.
Low Risk, High Reward: Entering near this zone offers a tighter stop-loss and greater upside potential if the price rebounds.
Market Structure Support: The demand zone holds significance in maintaining the bullish structure of LRC.
How to Approach This Trade
Spot Buy at the Demand Zone: Place buy orders within the old high demand zone, ensuring you're positioned at this critical level.
Watch for Confirmation: Look for bullish price action, such as candlestick patterns (e.g., hammer or engulfing candles) or increasing volume near the zone.
Set a Stop-Loss: Place a stop-loss slightly below the demand zone to protect against invalidation.
Hold for a Fibonacci Extension: If the price bounces, aim for higher Fibonacci extension levels as potential targets.
I keep my charts clean and simple because I believe clarity leads to better decisions. Trading doesn’t have to be overly complicated, and I enjoy sharing setups that have worked well for me.
My approach is built on years of experience and a solid track record. I don’t claim to know it all, but I’m confident in my ability to spot high-probability setups. It’s all about learning and growing together as traders, and I’m here to share what I see.
The markets can confirm what the charts whisper if we’re paying attention. I hope these levels help you as much as they’ve helped me in the past. Let’s see how this plays out!
Tip of The Iceberg
🐶 DOGEUSDT.P: Next Move
🎨 RENDERUSDT.P: Opportunity of the Month
💎 ETHUSDT.P: Where to Retrace
🟢 BNBUSDT.P: Potential Surge
📊 BTC Dominance: Reaction Zone
🌊 WAVESUSDT.P: Demand Zone Potential
🟣 UNIUSDT.P: Long-Term Trade
🔵 XRPUSDT.P: Entry Zones
🔗 LINKUSDT.P: Follow The River
📈 BTCUSDT.P: Two Key Demand Zones
🟩 POLUSDT: Bullish Momentum

#LRC/USDT Ready to go up#LRC
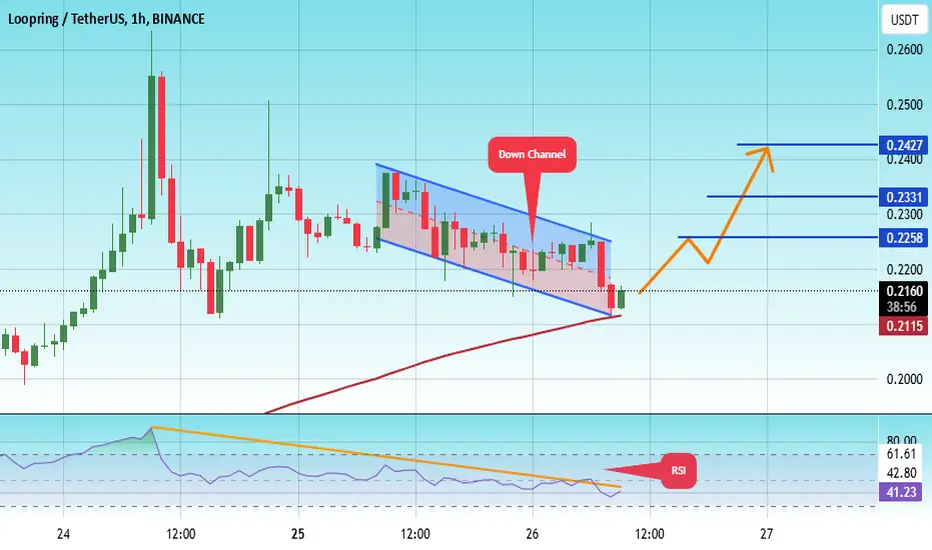
The price is moving in a descending channel on a 1-day frame and sticking to it well
We have a bounce from the lower limit of the descending channel, this support is at 0.2112
We have a downtrend on the RSI indicator that is about to be broken, which supports the rise
We have a trend to stabilize above the moving average 100
Entry price 0.2150
First target 0.2258
Second target 0.2331
Third target 0.2427
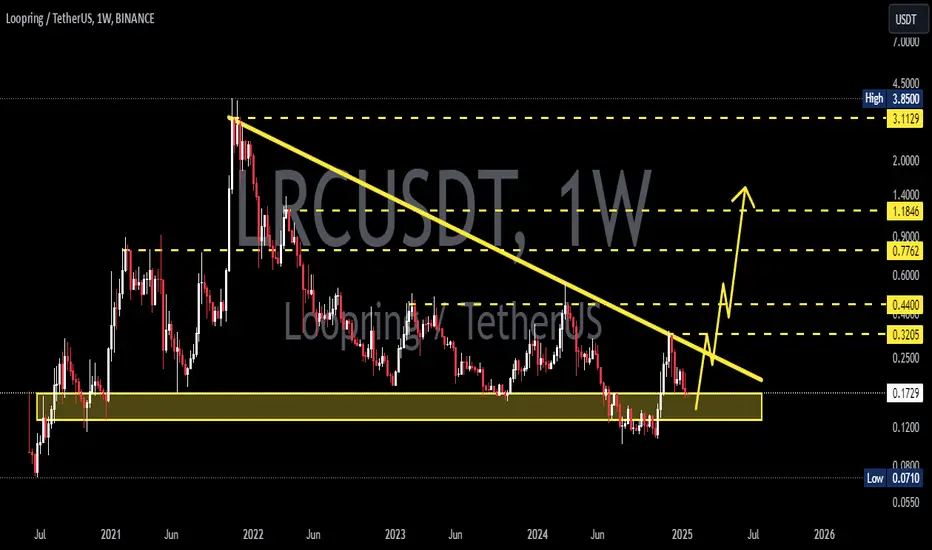
LRCUSDT 1WLRC ~ 1W
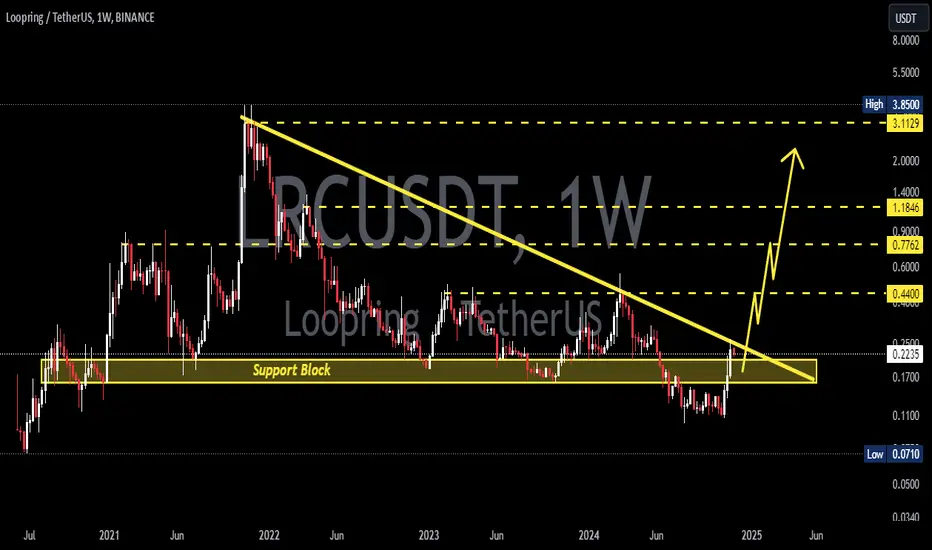
#LRC If you still have Conviction on this coin. buy in stages from here. With a minimum target of 20%+. It is only a matter of time until this resistance line is broken. and bullish will dominate
#LRCUSDT LONG#LRC
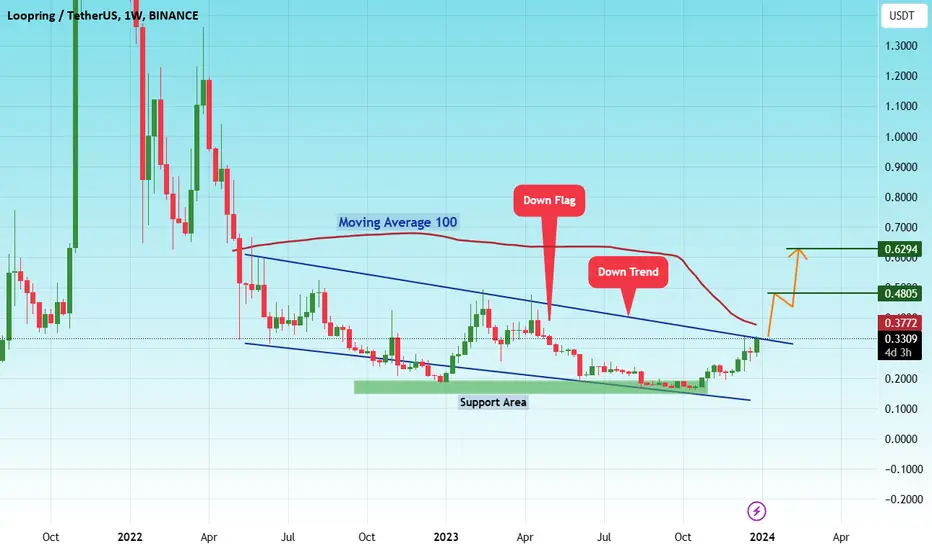
Finally, we reached the upper limit of the downward channel
Since May 2023
At the same time, we are close to breaking the EMA 100
We have a large reversal pattern and the price looks set to break it
The price is expected to trade in an upward wave with price corrections
Current price 0.3310.
The first target is 0.4805.
The second target is 0.6294.
UPDATE LRC / LRCUSDTUPDATE IDEA^
Good Luck >>
• Warning •
Any deal I share does not mean that I am forcing you to enter into it, you enter in with your full risk, because I'll not gain any profits with you in the end.
The risk management of the position must comply with the stop loss.
(I am not sharing financial or investment advice, you should do your own research for your money.)

LRCusdt BullishPossible Hold here can send it to 0.4 initially and higher later.
Longing the area here.
Expecting it to push higher from here.
Will DCA in the area.
Invalidation breaking recent lows.
Note: Not a Financial Advice.

LRC / LRCUSDTGood Luck >>
• Warning •
Any deal I share does not mean that I am forcing you to enter into it, you enter in with your full risk, because I'll not gain any profits with you in the end.
The risk management of the position must comply with the stop loss.
(I am not sharing financial or investment advice, you should do your own research for your money.)

Loopring token (LRC) forming bullish Cypher for upto 46% pumpHi dear friends, hope you are well and welcome to the new trade setup of Loopring token ( LRC ) with US Dollar pair.
On a daily time frame, LRC is about to complete the final leg of a bullish Cypher move.
Note: Above idea is for educational purpose only. It is advised to diversify and strictly follow the stop loss, and don't get stuck with trade

LRC/USDT - LONG ----- Welcome, dear followers! -----
- Here is my trading methodology. I trade with a normal system and analysis of resistance and support, as well as price reversal patterns.
- For the record, I do not place a stop loss within my trades. So that I only risk 1.5% of my total capital in order to support the loss due to a price reversal against me.
- If a price reversed against my expectation and touched the drawn line r3, then I transferred targets to the entry point and waited for the price to close at it with a loss equal to almost zero.
- Today's deal is shown in the chart, and here are the entry and exit points below.
-- Support me with numbers and follow up on my account for other deals in the future. Thank you for coming to this part. --
-------------------------------------------------------
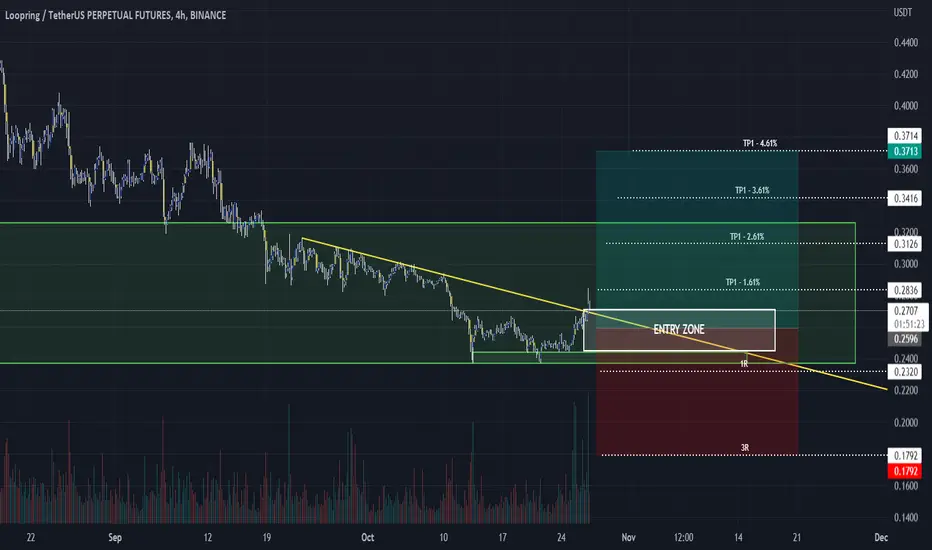
⚡️⚡️ LRC/USDT ⚡️⚡️
Exchange: Binance Futures
Trade Type: Regular (Long)
Leverage: Cross (1.0X)
Entry Orders:
1) 0.2713 - 24.829% ✅
2) 0.2628 - 24.986%
3) 0.2540 - 25.078%
4) 0.2452 - 25.106%
Take-Profit Orders:
1) 0.2836 - 50.0%
2) 0.3126 - 25.0%
3) 0.3416 - 15.0%
4) 0.3714 - 10.0%
Trailing Configuration:
Entry: Percentage (0.5%)
Stop: Breakeven -
Trigger: Target (1)
LRCUSDT Ready For Takeoff!LRCUSDT technical analysis update
Buy zone : $0.305 - $0.308
Stop loss : $0.295
TP 1 : $0.322
TP 2 : $0.337
TP 3 : $0.360
Always keep stop loss
Thanks
Hexa

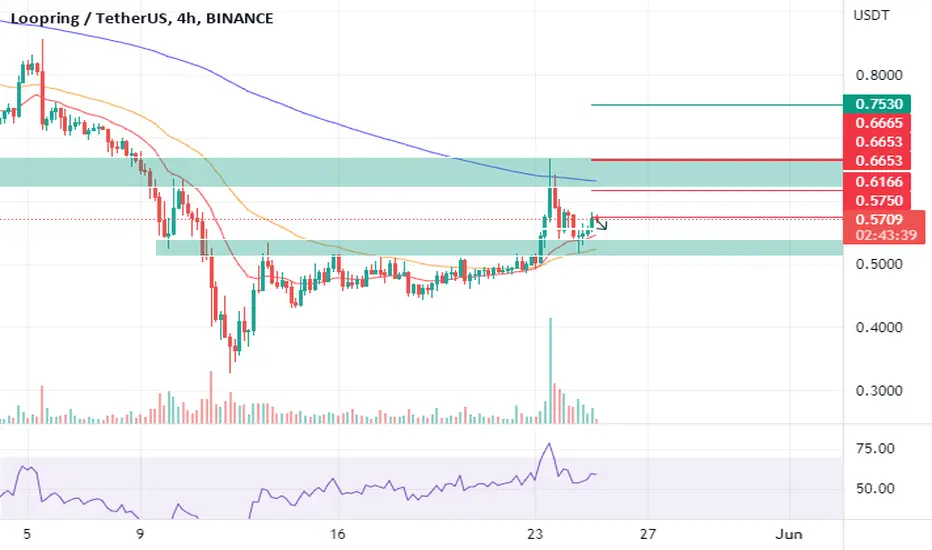
LRC/USDT BUYING SETUP LRC Reject on key support , we can setup entry , potential continue upward movement
BTC rejection to on key support will follow BTC movement
Buy zone : 0.555 - 0.52 - 0.5
Target : 0.5750 - 0.61666 - 0.6653 - 0.7530
Stop : 0.49
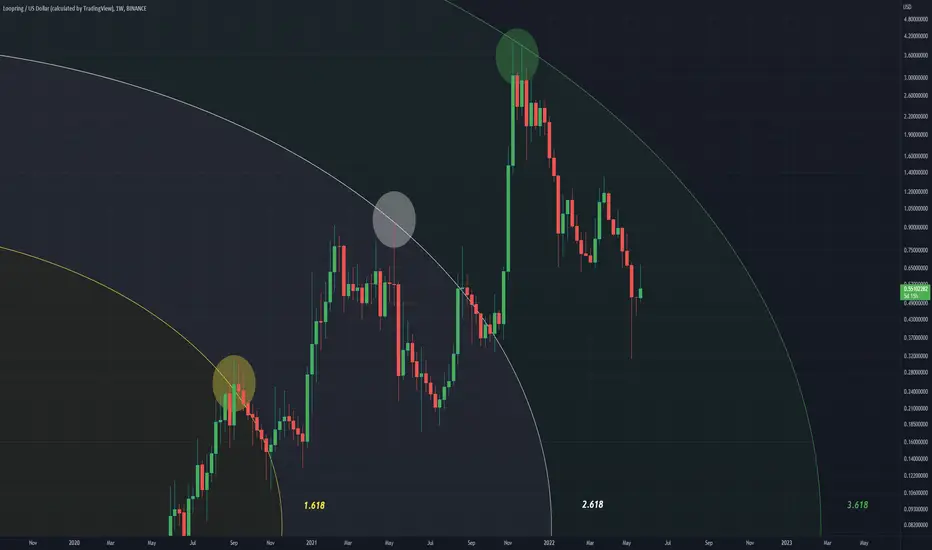
LRCUSD Interesting Fibonacci Top PatternLoopring proceeds to rise to 1.618, then retreats, rises to 2.618, retreats, rises to 3.618.
Will this pattern continue for the next outer ring 4.618
LRC RANGES TO ACHIEVE BOTTOMEntering at yellow lines ,Stopping at red line , Taking targets at green lines . Simple and crisp !

LRCUSD Bulls in ChargeThe 50MA seems to be imperative in prices evolution on this weekly chart, price has recently touched it and been bullishly rejected
The orange trendline is dominant and seems to be hodling strong
All MA's are spread this is the best state for likely continuation

LRC Darvas boxBINANCE:LRCUSDTPERP BINANCE:LRCUSDT LRC has formed Darvas Box,breakout will be huge from here.Care about downside risk too.Im personally LONG since 0.85$ so im not clong it until the breakdown.

LRC/USDT LOWER TF TRADE SETUP Hi guys, This is CryptoMojo, One of the most active trading view authors and fastest-growing communities.
Do consider following me for the latest updates and Long /Short calls on almost every exchange.
I post short mid and long-term trade setups too.
Let’s get to the chart!
I have tried my best to bring the best possible outcome in this chart, Do not consider it as financial advice.
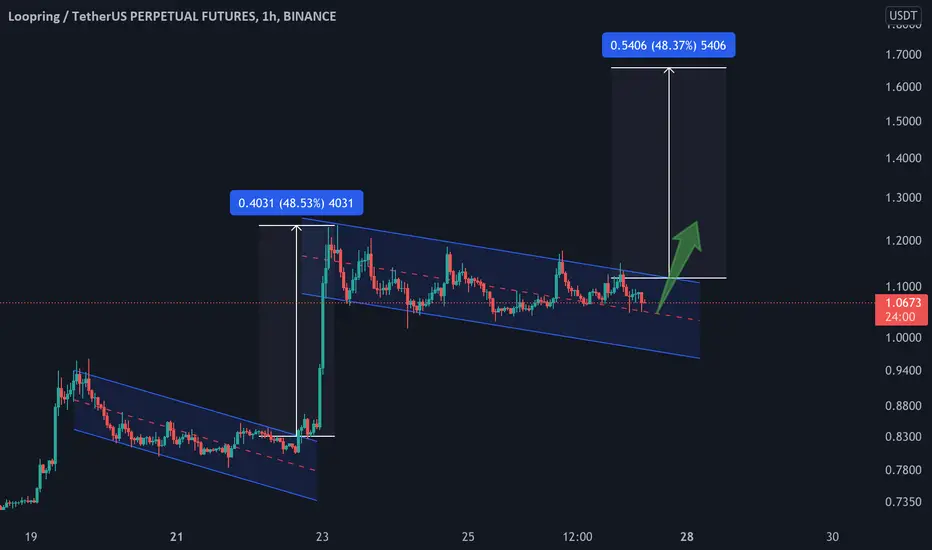
LONG #LRC/USDT
ENTRY: CMP and add more up to $1.05
SELL- 50%
STOP LOSS: $1.01
Leverage - 5x
This chart is likely to help you in making better trade decisions, if it did do consider upvoting this chart.
Would also love to know your charts and views in the comment section.
Thank you
LRC/USDT - Pending sell order #FUTURES x20Pending sell order.
After reaching the price of 0.9295, open a position for 2% of the deposit, with 20x Leverage
Target and stop loss indicated on the chart

LRC Potential Formation ?LRCUSDT | 4H Timeframe
Scenario potential, all things being equal.
Follow @cryptonkidd for my picks and trades.
