LSKBTC


LSK Map - Supp/Res Zones along the wayMy personal map to LSK coming days -
Zones(Buy/Sell) - (Confluence of 1hr(pink)-4hr(orange)-Daily(blue) horizontal resistence/supports and Fib. levels)


LSK/BTC New Targets.if it is still above0.0013687 it will go higher
target 1: 0.0013687
2: 0.0015580
3: 0.0016544

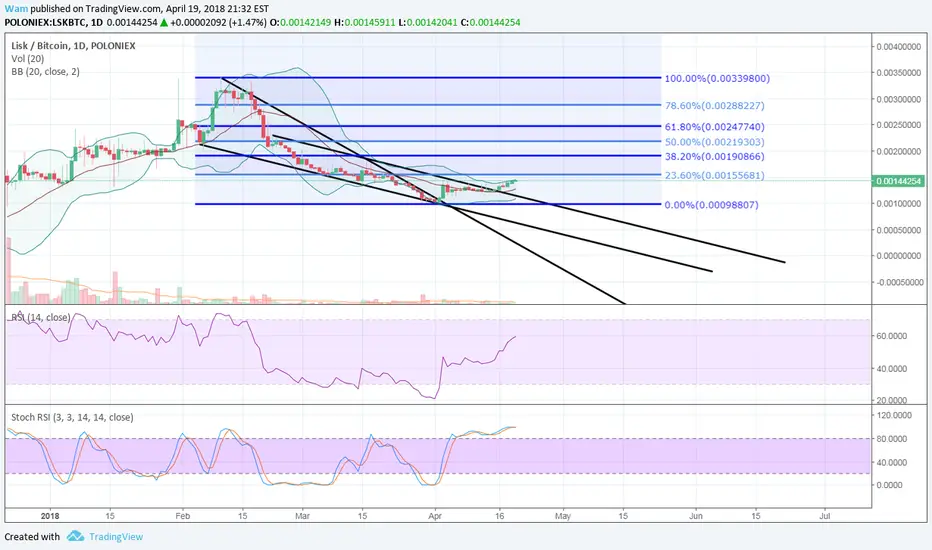
Looking at Lisk Next Moves.Hey, I am back with some Technical Analysis.
This time looking first time at Lisk.
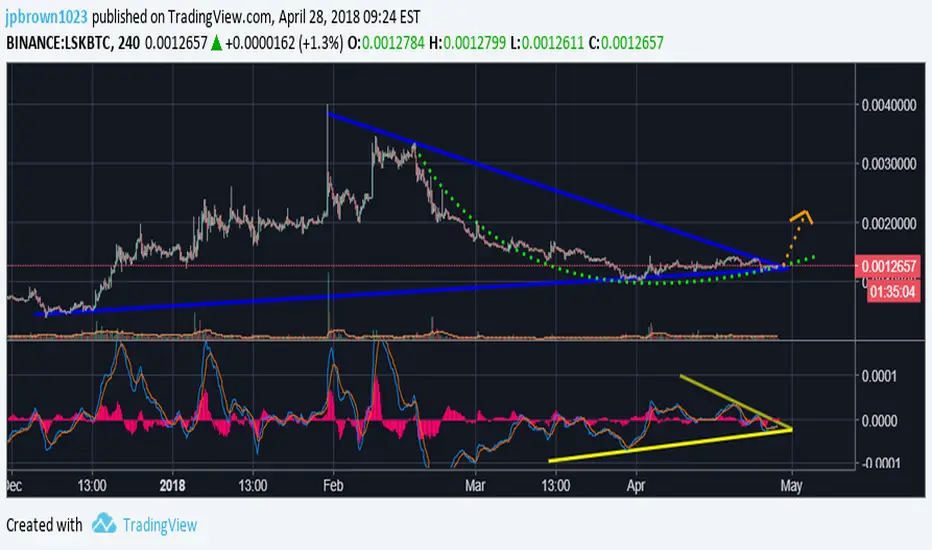
Right on the chart you can see there was bear flag that led to breakdown, currently it looks like we are forming Pennant with a possible breakout, as we are on a strong support where I expect some bounce upwards.
Indicators looks pretty okay, but RSI needs to surpass 54 to be bullish.
Hope I made your view on whats going on with Lisk somehow clearer.
If you like this TA let me know in the comments, Likes are aprreciated, Thanks !
If this gets a little bit of attention, I will update!

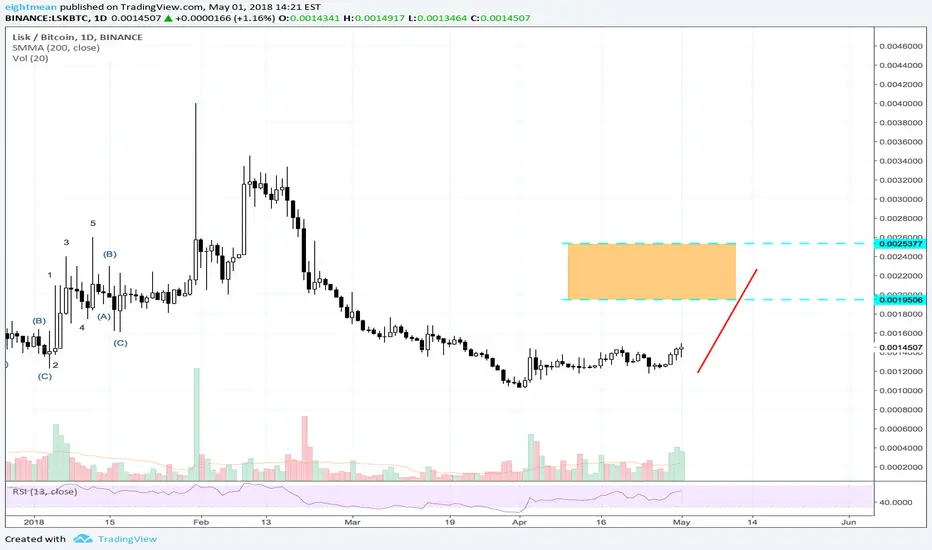
LISK: Head and ShouldersLisk has formed a bullish signal: Head and Shoulders. We can confirm a breakout when the price closes above the green resistance line.
LSKBTCDear Fallowers,
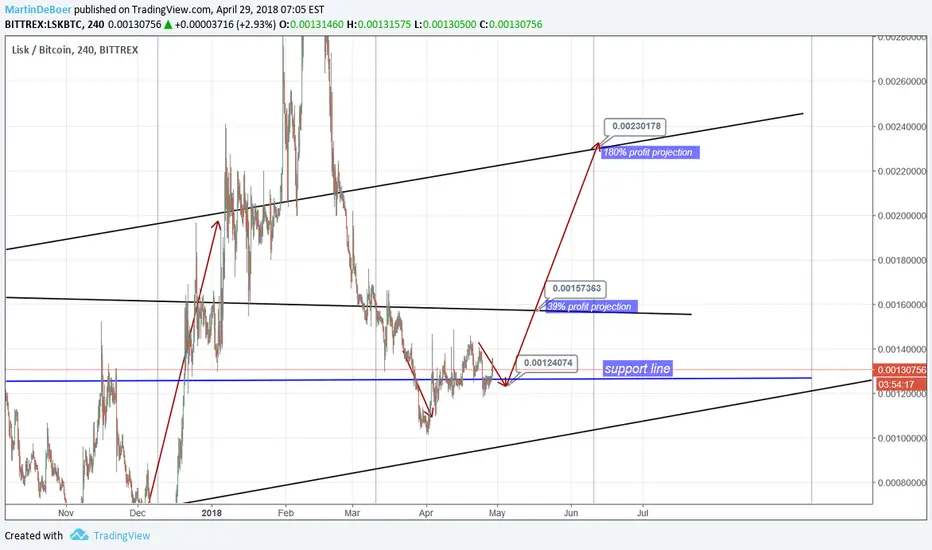
LSKBTC is ower target give full attention to the drawing pls. and make a nice profit comming weeks
success on trading for the fallowing peoples.
We have 2 target here :
39% profit projection at 0.00157363 and
180% profit projection at 0.00230178
If this coin drop, support around 0.00124443, use stoploss below support line
LSK - May be ready for a breakoutLisk looks like it may be completing a pattern here soon on the 4-hour chart. It has been consolidating from its February pump. The price action found support and has been slowly rising since April. I see a bullish cross on the MACD, I think all LSK needs is volume to jump start the next run.
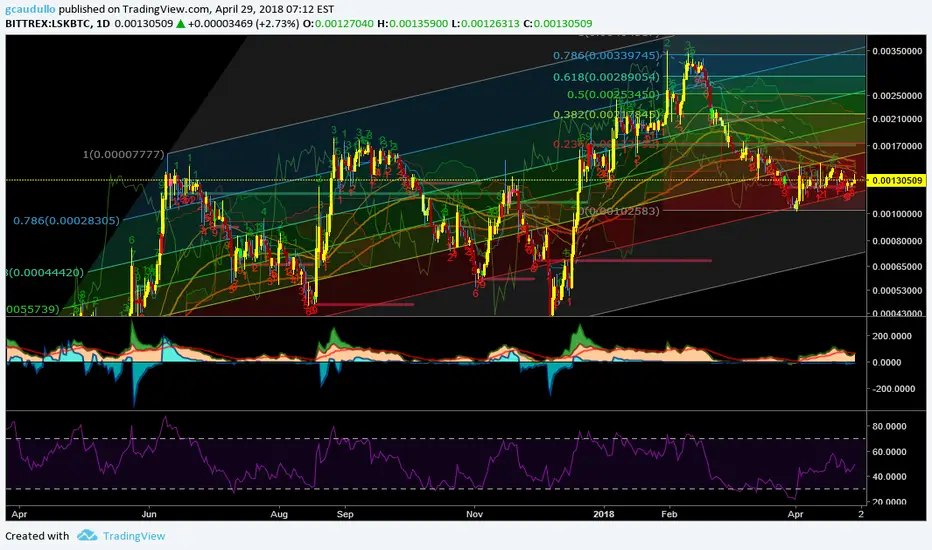
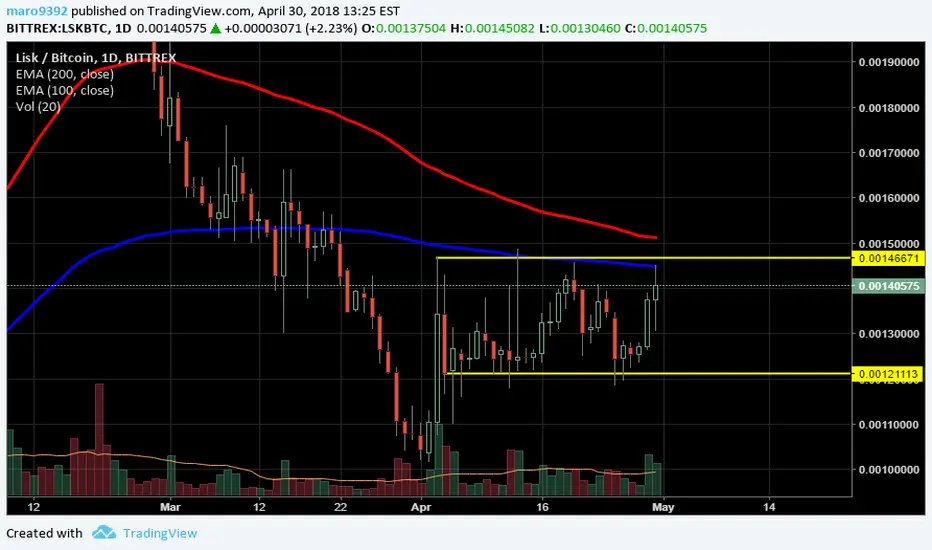
LISK vs Bitcoin - Insipid Sideways To Continue For Now!Today we are looking at Lisk vs Bitcoin to see what we find!
The MACD is looking to cross down below the signal line, though as you can see there is no real momentum behind this.
Aroon Up is at 42 and falling, whilst Aroon Down was recently above 50 but has now dropped below – and is continuing to fall lower. This does not indicate a change in trend, but simply shows us that prices are not moving lower. With the Aroon Up below 50 we are subsequently not going to move higher either. This suggests a continued period of consolidation sideways within the blue dashed channel.
RSI is at 45 whilst Accumulation/Distribution is pretty much halfway; both of these further supporting a continued sideways move.
Let’s have a look and see what our moving averages tell us. The 200 EMA has crossed above the 50 EMA in a bearish fashion on 15/04 and we are currently trading well below both of them. We have tested the bottom of the channel multiple times and have actually found some solid support at close to half way up the channel as indicated by the dashed green support line.
Looking at the EMA 12 and EMA 26; we almost had a bullish crossover on the 24th of April, however the bears ramped up the down pressure in terms of volume and prevented this from occurring. We are not currently trading below both EMA’s which are acting as resistance.
So where to from here? For now we have both some solid support directly below and solid resistance directly above us. Our indicators suggest a continued move sideways so there are not a lot of trade opportunities. I am neutral on this one currently and won’t be trading. I will likely keep an eye on it however; and when our indicators give us some more information post an update on which way we are looking to go.
Cheers

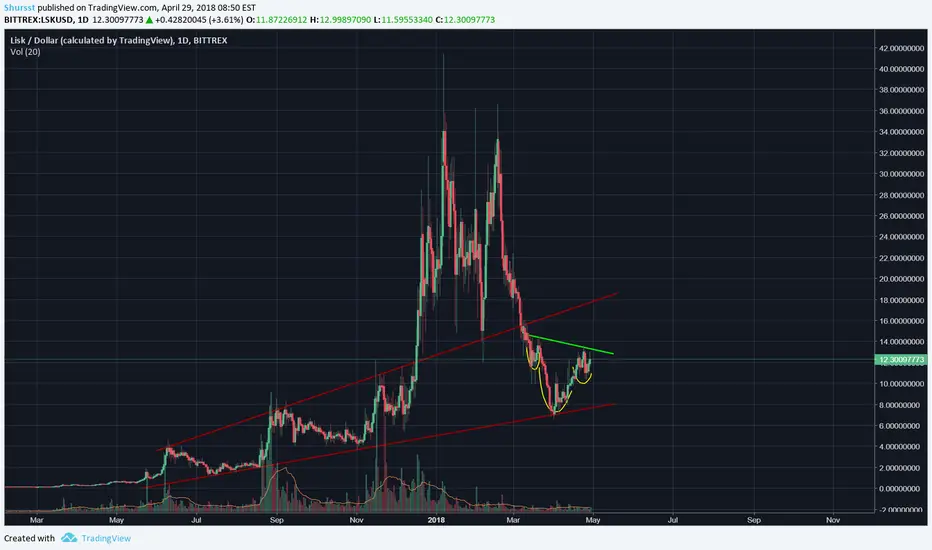
LSKBTC Signals Hey guys what's up its your fav trader and i have another coin with good profit in not so much time. The coin is Lisk (LSK).
Lisk is a next generation platform that allows for the development and distribution of JavaScript based decentralized applications using an easy to use, fully featured ecosystem. Through Lisk, developers can build, publish, distribute, and monetize their applications within a custom built cryptocurrency powered system that utilizes custom blockchains, smart contracts, cloud storage, and computing nodes; all from within one industry solution.
Lisk is the first decentralized application solution written entirely in Node.js. This opens up the Lisk ecosystem to thousands of current developers with no additional skills necessary. Any web developer who is already familiar with JavaScript and Node.js can immediately jump in and begin building decentralized applications from day one.
Lisk seems to have a very nice bullish breakout in all the time frame and also it formed a really good triangle with the bullish breakout. I'm planing to buy some quantity right now and if it test the blue (Dark) line i'll buy more if u guys are planning to join this one have proper money management. Buy in blue and sell strong at targets. Thanks guys for looking into it, don't forget to leave a like.
THANK YOU

LSK/BTC Modest analyze everLSK/BTC BINANCE:LSKBTC
Buy zone: 0.00140 - 0.00142
Sell: 0.00157
Good luck <3
If you want me to analyze your currencies comment here !


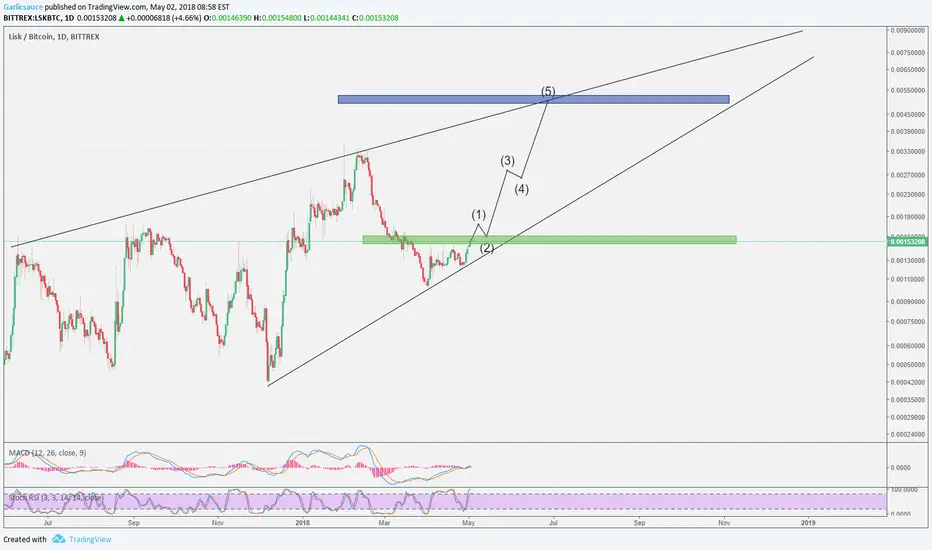
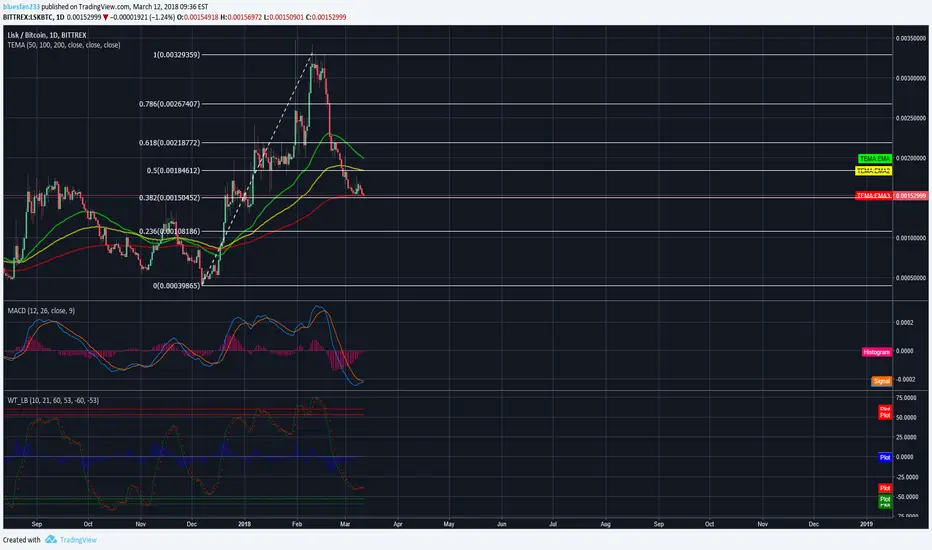
WHAT IS LISK GOING TO DOHello!
LISK is looking in doubt. We have the option to form a bearish pennant and retrace deeper. It has been fighting its recent downtrend for a while now. And so far lacks the power to break thru. The resistance is heavy coinciding with both the 50 and 200 EMA. That's pretty much the bearish scenario.
The bullish scenario is that we start/ are forming a new ew cycle upwards. The resistance will have to be broken to the upside with good strength to confirm the power of the bulls. The MACD and WT tell us it is looking or will soon try to fight the bears on the Line. The stronger support lies @ 125k- 127k level and at the 100k level. If we do manage to break upside the trading opportunity could bring good rewards. Goodluck


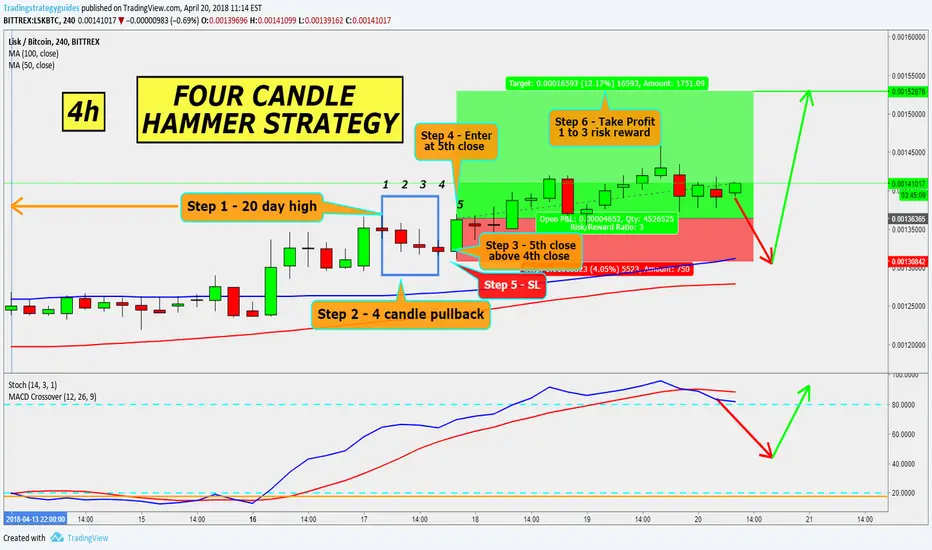
FOUR CANDLE HAMMER STRATEGYStep #1: The market needs to make a 20-candle new high
The first step is to identify the market trend. This makes sense since the four candle hammer strategy is a pullback strategy it needs a prior trend.
The first and the most important thing are to identify a strong trend that is moving vigorously up. Identifying strong trends can be done through technical indicators. However, our retracement strategy doesn’t use any technical indicators and rely solely on price action.
Price action is the most accurate way to determine trends and hedge fund managers know this best.
The 20-candle high rule is an excellent way to identify markets that are having a strong trend and is it’s rather a simple way to spot the trend.
Step #2: Identify a 4 candle pullback that goes against the prevailing trend.
As a general rule, the second part is to spot a pullback that moves against the prevailing trend. This step is quite important because the pullback will create our entry opportunity before the market starts resuming the prevailing trend.
The four candle hammer strategy will relay again on the price to identify the retracement. Technical analysis trading can be done even without indicators. However, the retracement still needs to satisfy some trading conditions.
Namely, we want to see 4 consecutive candle retracement in a row after the 20-candle high was put in place.
Step #3: The 5th candle closing price needs to be above the 4th candle closing price
It’s our job to identify when the short-term retracement will end and jump on the wagon before the dominant trend resumes and leaves us in the dust.
On the 5th candle, we’re looking for the market to put an end to the retracement. The upside momentum should pick up on the 5th candle.
The stronger the momentum at this stage, the better.
Note* It’s sufficient for the 5th candle closing price to be above the 4th candle CLOSING price. Please note that we didn’t say the 4th candle HIGHEST price. The rule is that the higher the 5th candle closing price is, the better.
This is a crucial day because it’s the candle prior to our possible entry point.
Step #4: Buy at the close of the 5th candle of the pullback
Our retracement strategy is offering us a good entry point that is close to the end of the pullback. This is also the point where the market will begin resuming the primary trend.
In this regard, we buy at the close of the 5th candle of the pullback. Or you can say that we buy at the opening of the 6th candle.
Our entry strategy will help you maximize your profit potential and minimize your risk level.
Step #5: Place protective Stop Loss 10 pips below the 5th candle low
Usually, the lowest risk trades happen when the retracement of a strong trends end. This is the reason why we’re able to use such a tight stop loss.
Place your protective stop loss 10 pips below the 5th candle low. We’ve added a buffer of 10 pips to protect ourselves in case of any false breakouts.
Note* Remember to always use SL because not using stop loss is the number 1 reason why traders take significant losses.
Step #6: Take Profit equals 3 times the distance between your entry price and your stop loss price
The best way to establish your profit targets is to multiply the distance between your entry price and your stop loss price by 3. In other words, we want our profit target to be 3 times greater than our stop loss giving us a positive risk to reward ratio of 1:3.
Note** the above was an example of a BUY trade using technical analysis trading. Use the same rules for a SELL trade – but in reverse.