LSKBTC


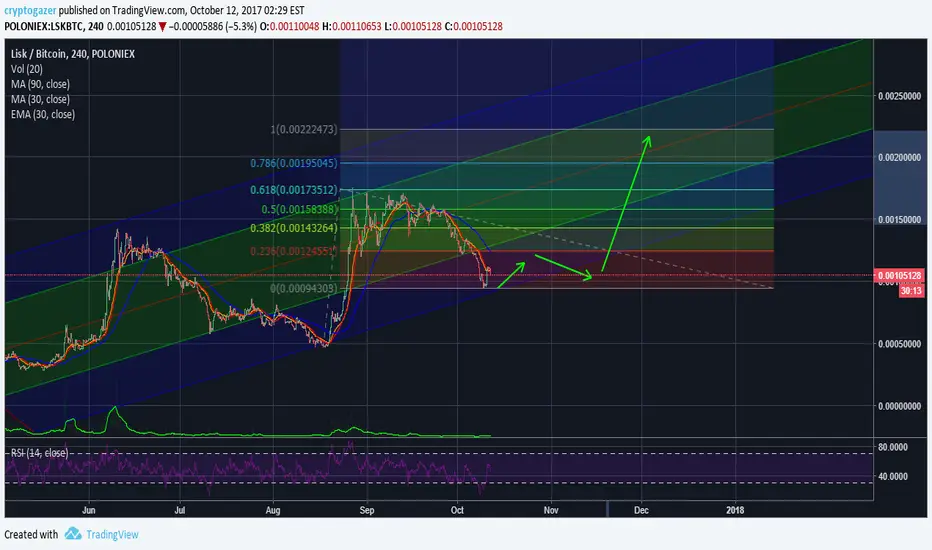
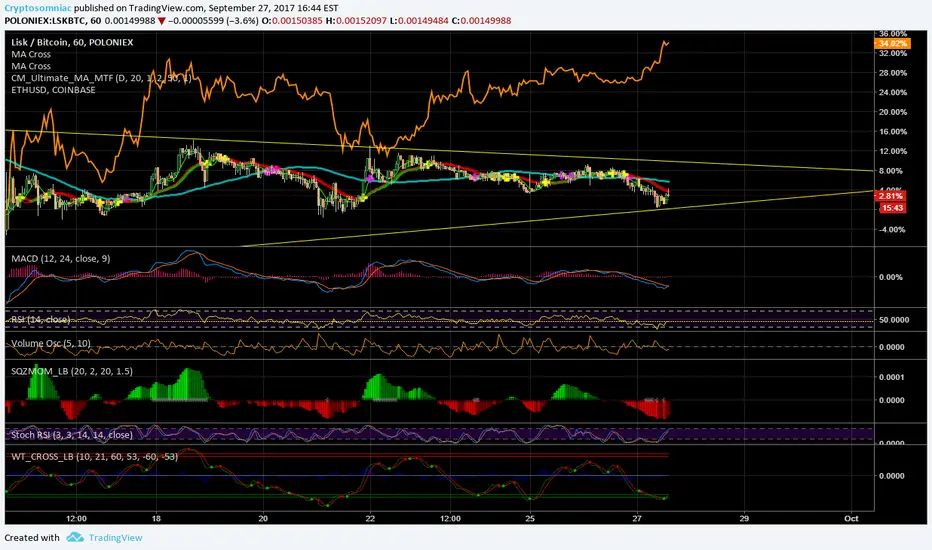
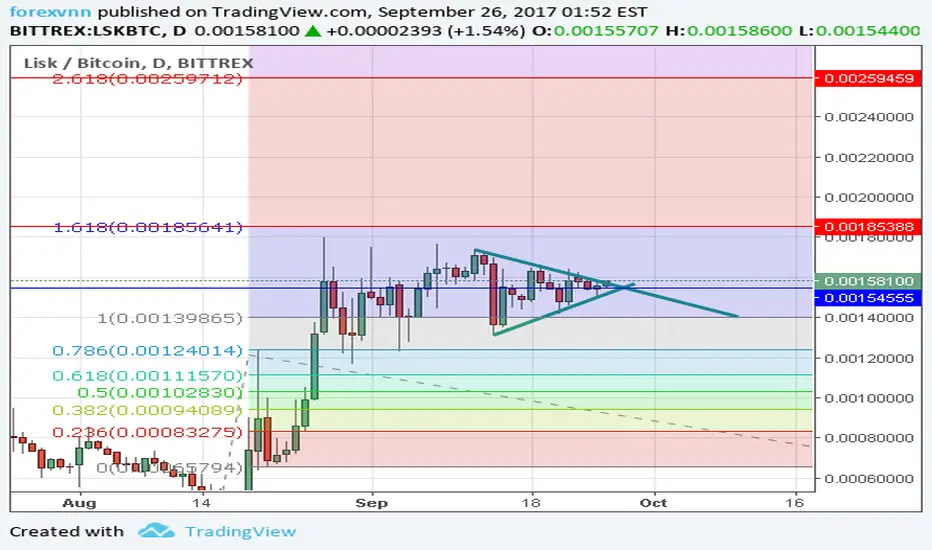
LSK BTC pattern emergingLast time RSI and MACD dropped this low, it signaled the beginning of the last leg of the correction before another big move. Appears that the EMA and MA are about to converge and possibly cross to signal a change in price direction. Could see a new high in a few weeks possibly after a little sideways action. I've increased my holdings in LSK consistently and I am hoping to take some profits on the next move, assuming that the pattern will repeat similarly. IMHO there is never a bad time to buy LSK, but now is a really good time! This one still has a lot of room to go up.
New low could be around .00085 as the correction pattern completes then hopefully a new high around .00195 or as high as .0024, but I think that will depend largely on the price of BTC. Would like to see it close over .00143 to confirm. Even a buy in at .00143 could see as much as 50%!
All of us hardcore LSK hodlers are dying to see how this plays out.
Got slightly lover numbers when I worked it out on coinigy - should give you a good range to work with.
www.coinigy.com
LSK Trade Idea#LSK is on floor now, also trying to pull out vloume into buying side. we have oppurtunity to gain over 70% by Tradng on #Lsk. Under 0.00105 would be good position. #Lsk has one of the most advanced & experienced programmers team and Continuously they improving #Lsk blockchain. This is why #LSk DevTeam have pretty decent flow of commits on #Github.

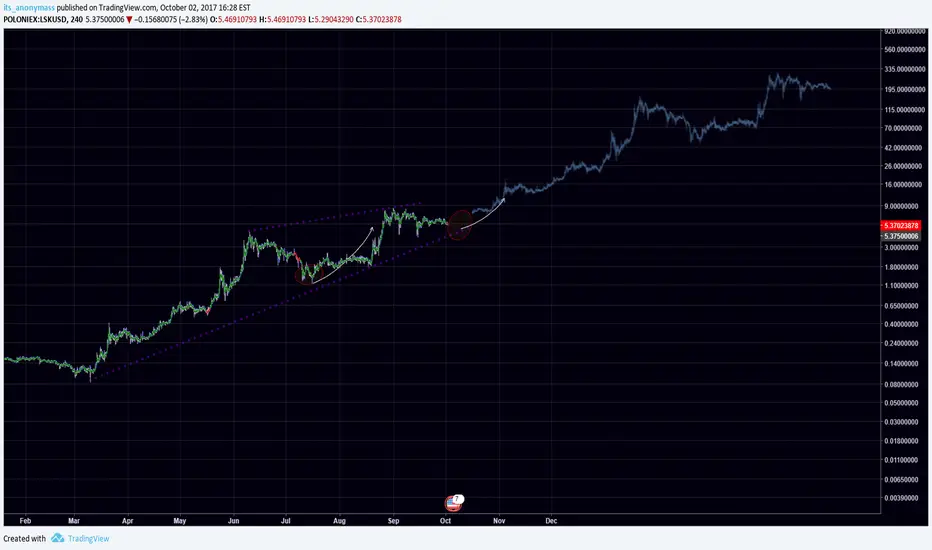
LSK RepeatIf LSK were to repeat this is what it looks like. Currently not in a position but considering a long hold.
Lmk if you have any thoughts.

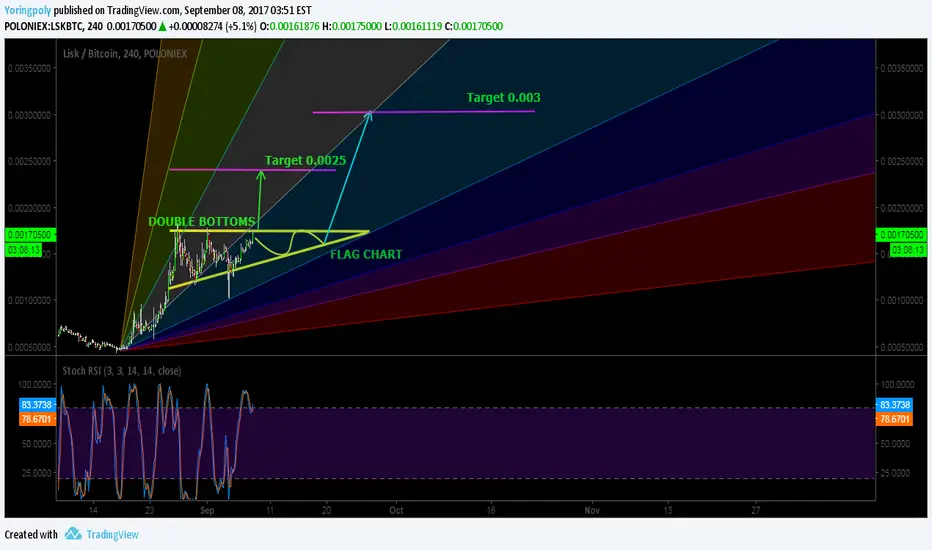
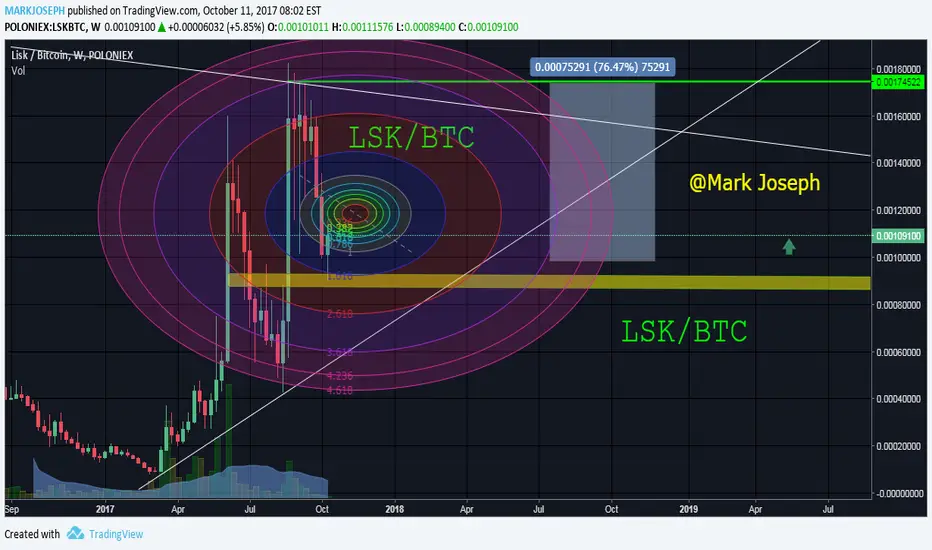
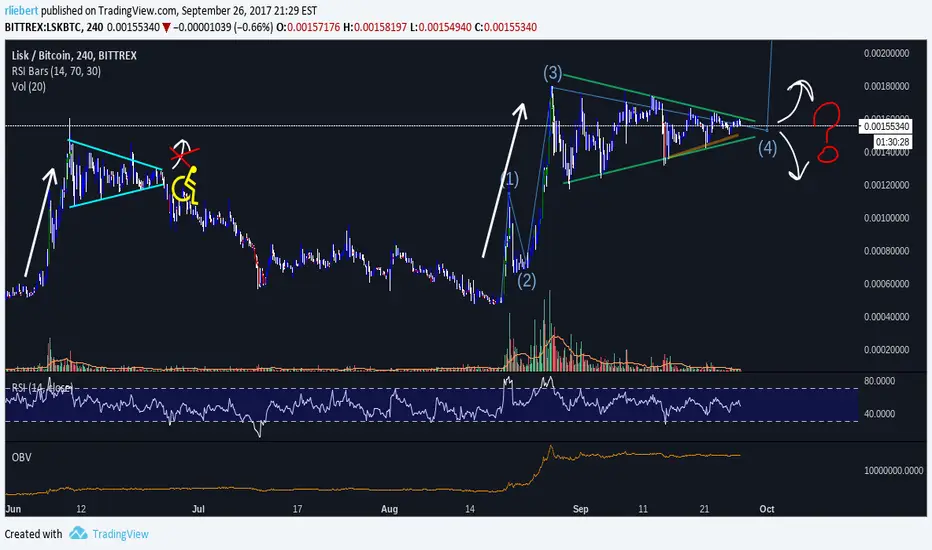
LSK - BTC analysis?As a new cryptotrader, I have been studying Elliot wave theory fundamentals and patterns... I have been trying to figure out where we are on the impulse waves with LSK as I am trying to decide if I should adjust my position. While I believe that this is a solid long term hold I would like to be able to make some predictions on entry/exit strategies and where I should be looking to take profits or reduce my position.
One possibility is that we are in wave 4 retracement after the new high of wave 3. This would mean that we could expect sometime in the near future an extension of a new impulse wave 5 to the .00251-.00281 area. I would then predict retracement to the .00195 area. So if this is wave 4 retracement, it cannot cross below the top of wave 1 - which is why we are having this sideways price movement while volume declines.
Other possibility that I would consider is that we are in a distorted or truncated wave 5 due to not enough momentum left after a huge wave 3 or the FUD coming from China. I have found research showing that this is a real pattern and in some cases the 5 wave will fall just short of breaking the high of wave 3 or barely break it. In that scenario, I would be calling wave 1-2 the small impulse leading to the huge wave 3. To me that makes sense but I'm also not as experienced at identifying variations in the patterns.
OMG also moved in a less textbook way and it seems as though I bought on the way up on wave 5... took profits, but should have waited to play with that one until the next run. Lesson learned, which is why I am really really digging into analysis on LSK.. and I haven't seen any good analysis or information on LSK so far. So let's start the discussion!
Really would appreciate some feedback on this analysis so I can learn more about Elliot Wave theory and measuring fibonacci retracement and extension.

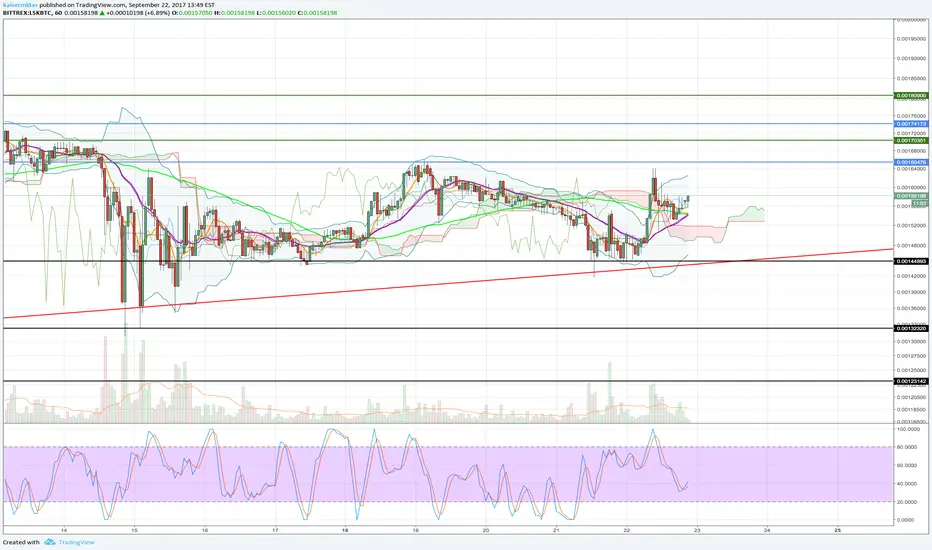
LISK looking to make a moveLisk one hour interval, Wave trend says buy, Triangle forming, MCAD may cross soon
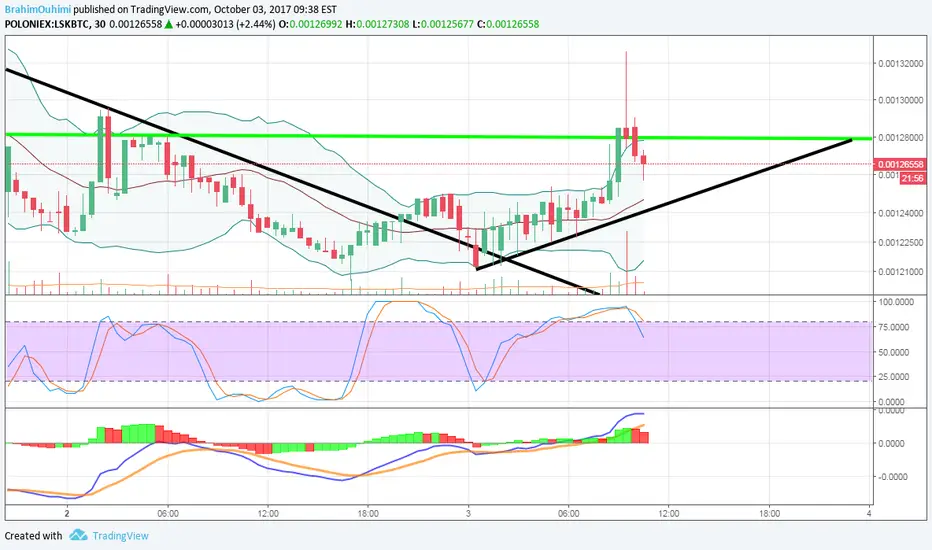
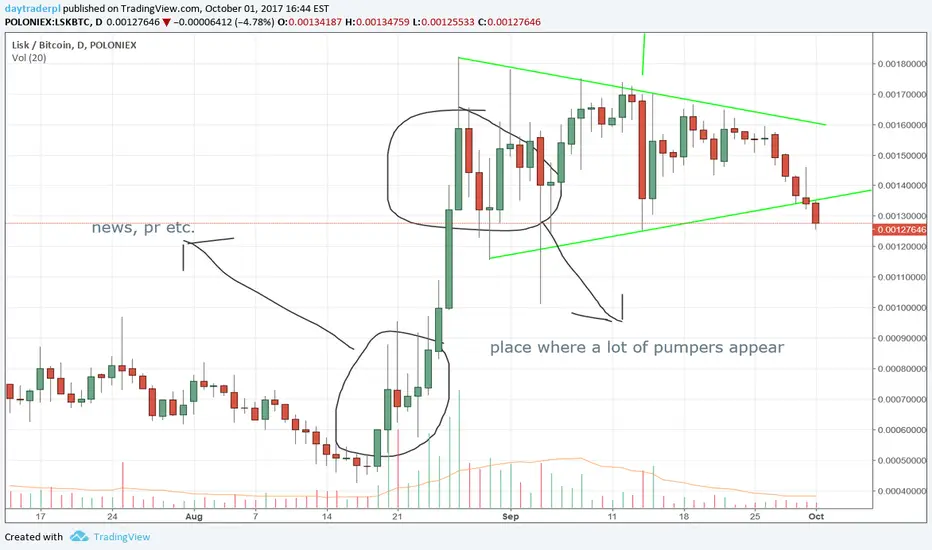
LSK/BTC set-up to move higher or set-up to break lower?
I had posted another chart that carried the idea that LSK would move higher after completing the current triangle... here:
After further examination, I realized that a similar pattern has appeared in the record where LSK broke lower...
Currently, there is a battle between supply and demand. Every time a crypto moves sideways, it is because supply and demand are near equilibrium. If demand overcomes supply, then we will certainly move up. If supply overcomes demand, then we will break lower.
The point of publishing this chart is to share that, as with everything crypto, there is justified uncertainty here.
Always use stops.
LSKBTC 1HR- Buy at 0.00152 - 0.00153 range SHORT at 0.00162050
- if taking a LONG position take profit at 0.00173 range
- for consideration: upcoming rebranding for LISK very soon

LSKBTC 1 HR- Buy at .00152 - .00154 range and SHORT at .00162050 (4.8 %)
- if going LONG, take profit at .00173050 (12%)
- one thing to consider ALSO is the upcoming LISK rebranding this quarter .

L-I-S-K is going big. Every single angle says yes! BITTREX:LSKBTC
Forget Hail Rodgers, This is Hail Lisk.
stock up now because as the final hour from October 16th to the 17th it looks like it will be huge. I hid like 50 other trend lines.
Countdown October 16th, Launch time October 17th. This will be so big it will have an aggressive pullback for bull trap like before. But you mine as well buy at dip if cheap like me and let it go cause this heat-seeking misle is gonna be deadly.
Or I could totally be wrong. This is Crypto.
-Rett Sloat 9,26,2017
-RSS-legacy


LISK: We are waiting for a break outLisk is providing a potential buy setup. We will only buy if this cyrpto decides to break out of the current flag it is in. Only then can we buy after a retest of the breakout. This will give us a confirmation that the breakout is not false. What are your thoughts?
Trade with care.

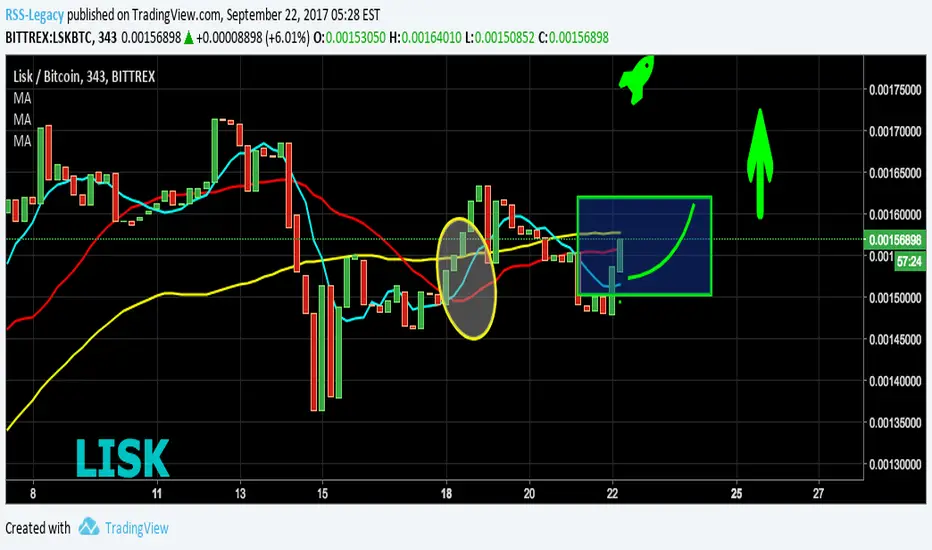
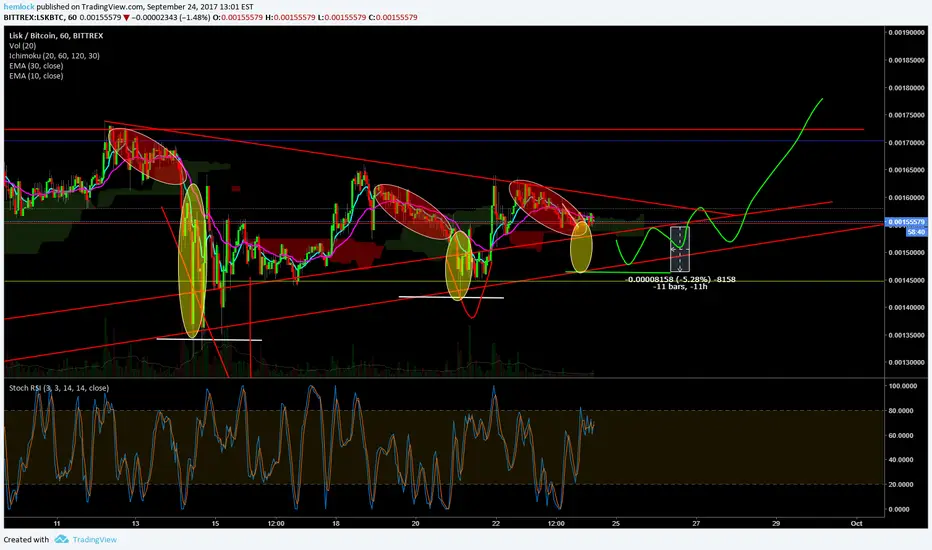
Lisk is ready for take off!Update. BITTREX:LSKBTC
The moving averages and the volume confirm that the moving averages in the next 12-16 hours till they connect and meet, then boom, Space X style.The 7 looks to have enough momentum to really go through the 21 and 77 fast making it scale much larger. Get in in the next 18 Hours because it should be one hell of a ride.
-Wolfy
Rett Sloat