LTCUSD reversed from resistance, potential drop!
LTCUSD reversed off its resistance at 110.30 where it could potentially drop further to 49.31.
Trading CFDs on margin carries high risk.
Losses can exceed the initial investment so please ensure you fully
understand the risks.
Ltcusdanalysis

LTCUSD approaching resistance, look out for potential reversal!
LTCUSD is approaching its resistance at 109.23 where it is could reverse down to its support at 49.31.
Trading CFDs on margin carries high risk.
Losses can exceed the initial investment so please ensure you fully
understand the risks.

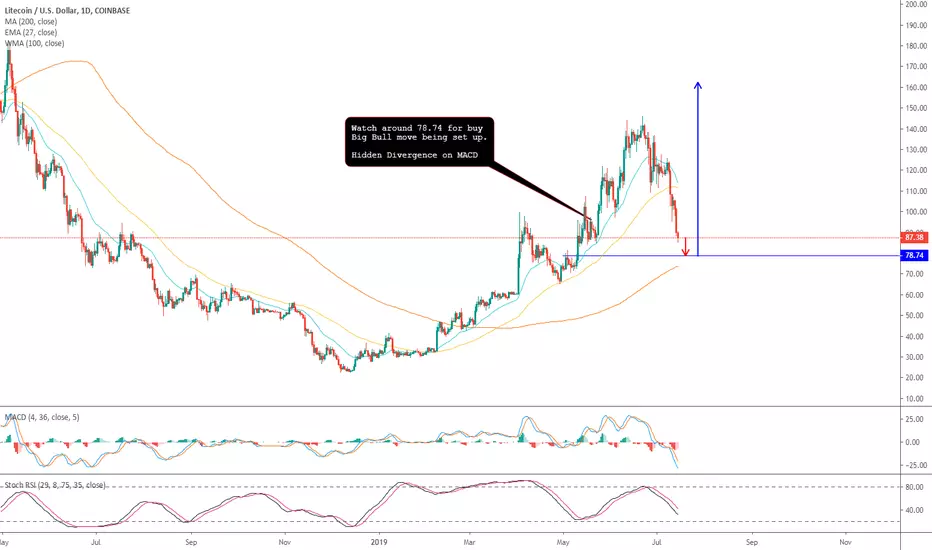
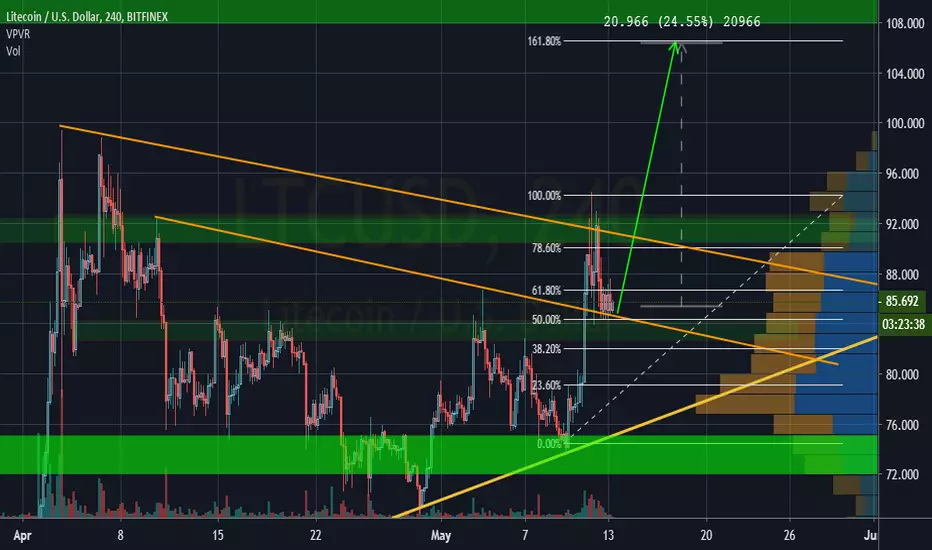
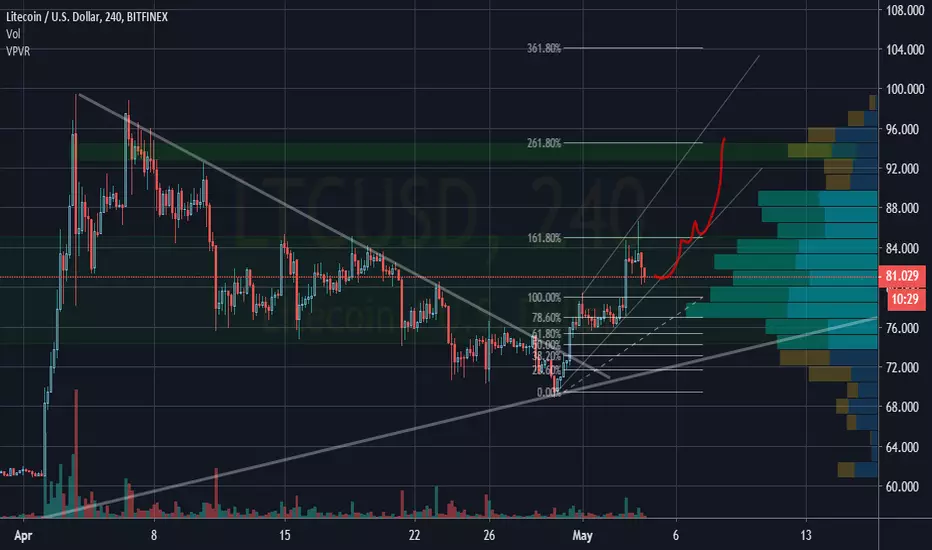
LTCUSD - LITECOIN - BIG BULL COMING SOONFREE ANALYSIS ON LTCUSD
Welcome to SiriusTrading (managed by Segunby), Check out my Free analysis on Forex and Crypto. Follow me for regular Analysis and don't forget to LIKE, LIKE, LIIIKKKEEE :)
Watch around 78.74 for buy
Big Bull move being set up.
Hidden Divergence on MACD
LTCUSD short & stop entry/exit -- following selloff; key sell ptFollowing massive selloff due to LTCUSD confirmations being much quicker than BTCUSD obv you'll see a consolidation on both coins yet for LTCUSD a short at $101.13 is viable & likely to occur within a 48-72 hour timeframe.
Safe trading all & Have a great evening.
Short @ $101.13
Stop listed as well.
Disclaimer
I've been wrong many times. This is my personal opinion. Do not listen to it. Though judging from my track record, you might believe otherwise. I've been right more than wrong but all that matters is that you make a wise investment decision based only off what you can afford and not solely off my opinion. You're presumably a grown man/woman and can make your own decisions.

An important crossroads to #Litecoin #LTCUSDThe first sign of a change in trend appeared 3 weeks ago in the form of a star candle (warning against a change in trend)
The positive point in this situation is the support of the solid Fibonacci retracement currently in place for Litecoin at the above price - $ 93.5
Scenario A-Because Litecoin at this moment touches the support above the next wave of rallies is on the way.
Scenario B-The recent gains were, in fact, a sign of the currency's demise, and the currency will continue to crash.

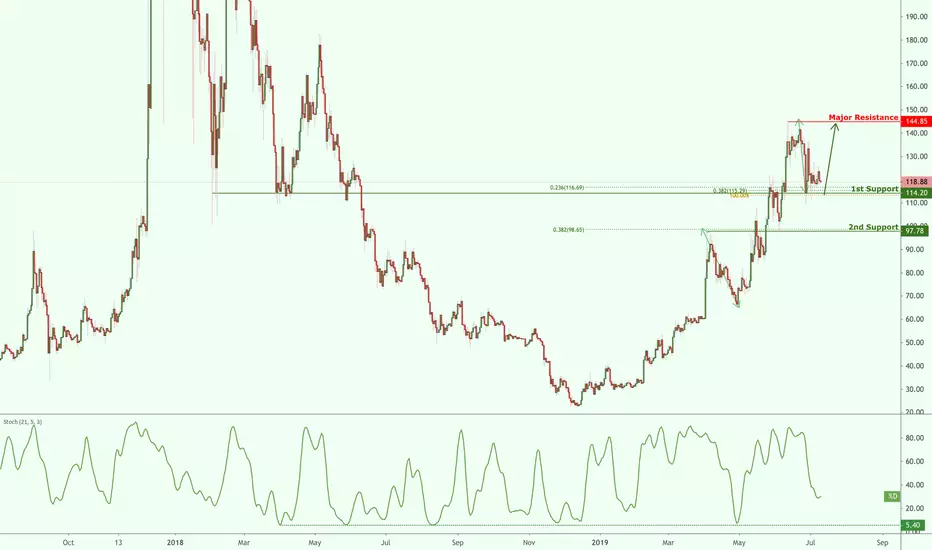
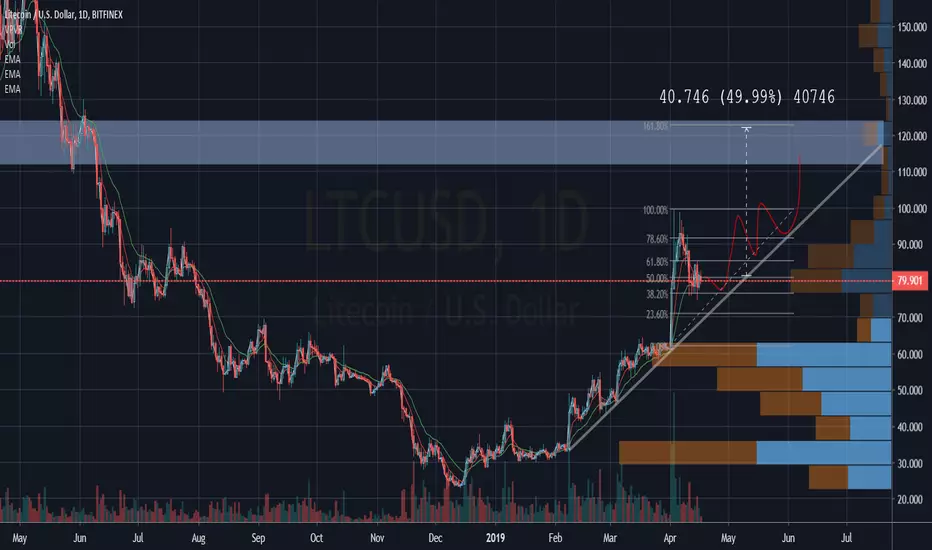
LTCUSD bounced from support, potential for a further rise!
LTCUSD bounced off its support at 114.20 where it could potentially rise further to 144.85.
Trading CFDs on margin carries high risk.
Losses can exceed the initial investment so please ensure you fully
understand the risks.
LTCUSD bounced from support, potential for a further rise!
LTCUSD bounced off its support at 114.20 where it could potentially rise further to 144.85.
Trading CFDs on margin carries high risk.
Losses can exceed the initial investment so please ensure you fully
understand the risks.

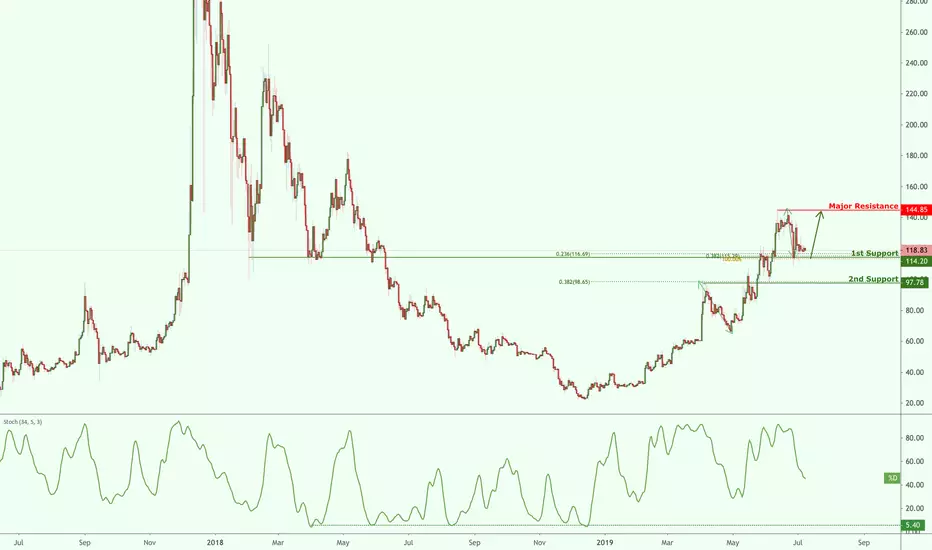
LTCUSD bounced from support, potential for a further rise!
LTCUSD bounced off its support at 114.20 where it could potentially rise further to 144.85.
Trading CFDs on margin carries high risk.
Losses can exceed the initial investment so please ensure you fully
understand the risks.
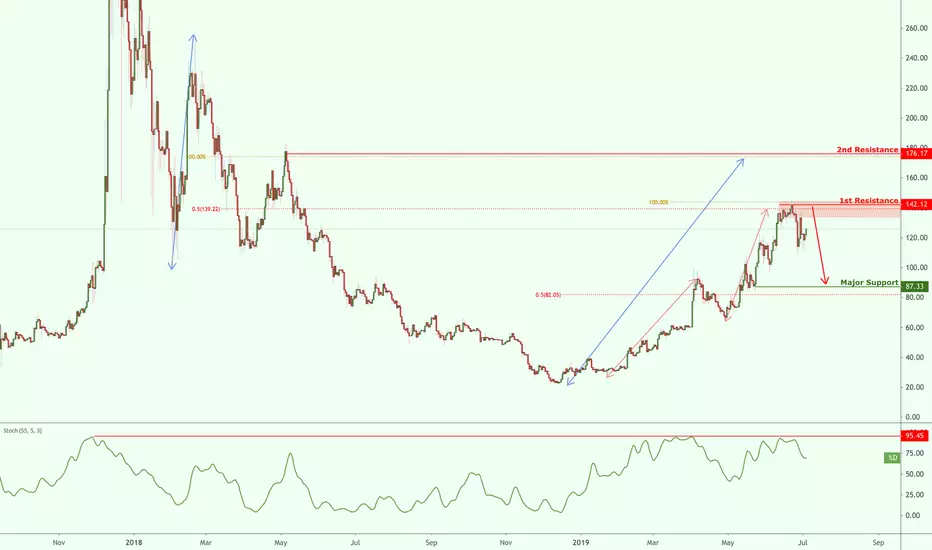
LTCUSD reversed from resistance, potential drop!
LTCUSD reversed off its resistance at 142.12 where it could potentially drop further to 87.33.
Trading CFDs on margin carries high risk.
Losses can exceed the initial investment so please ensure you fully
understand the risks.
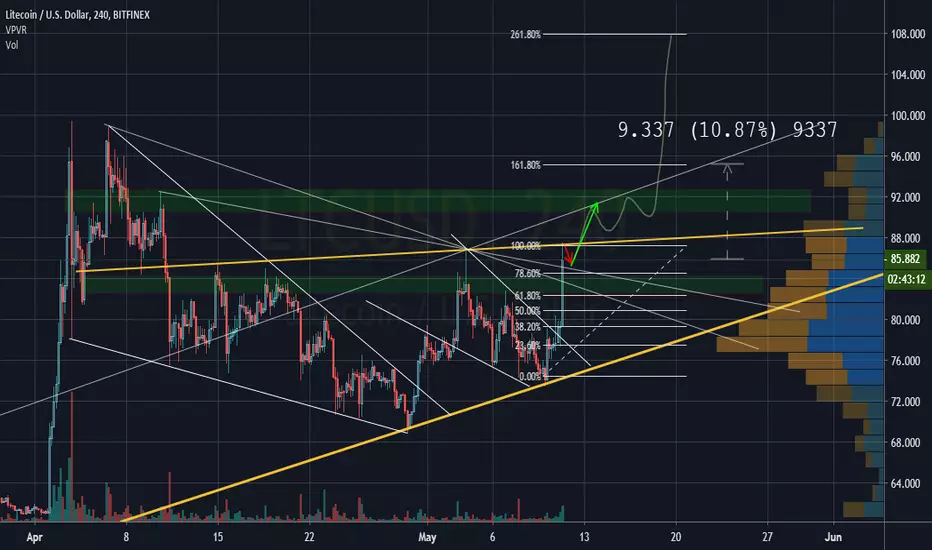
WHEN ALT-COIN SZN?! (LTC/USD) 4HRBTC has been killing the market lately hence the delay of Altcoin SZN.
I know I know tragic, However here is my analysis on LTC 4 HR chart. We are in a very interesting time in the market & there is many confidence in BTC right now!
What do you guys think?
LTCUSD reversed from resistance, potential drop!LTCUSD reversed off its resistance at 142.12 where it could potentially drop further to its 87.33.
Disclaimer:
Trading CFDs on margin carries high risk.
Losses can exceed the initial investment so please ensure you fully
understand the risks.

LTCUSD approaching resistance, look out for a potential reversalLTCUSD is approaching its resistance at 142.12 where it is could reverse down to its support at 87.33.
Disclaimer:
Trading CFDs on margin carries high risk.
Losses can exceed the initial investment so please ensure you fully
understand the risks.

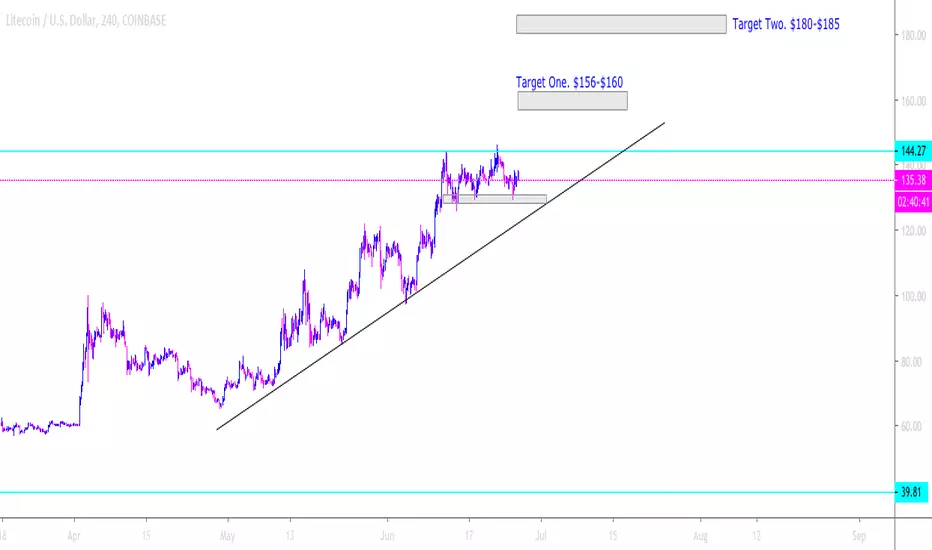
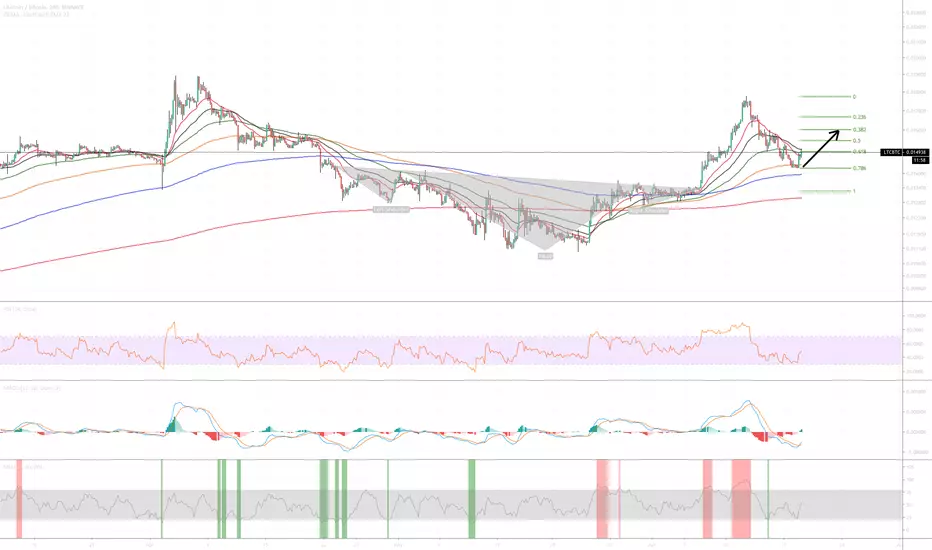
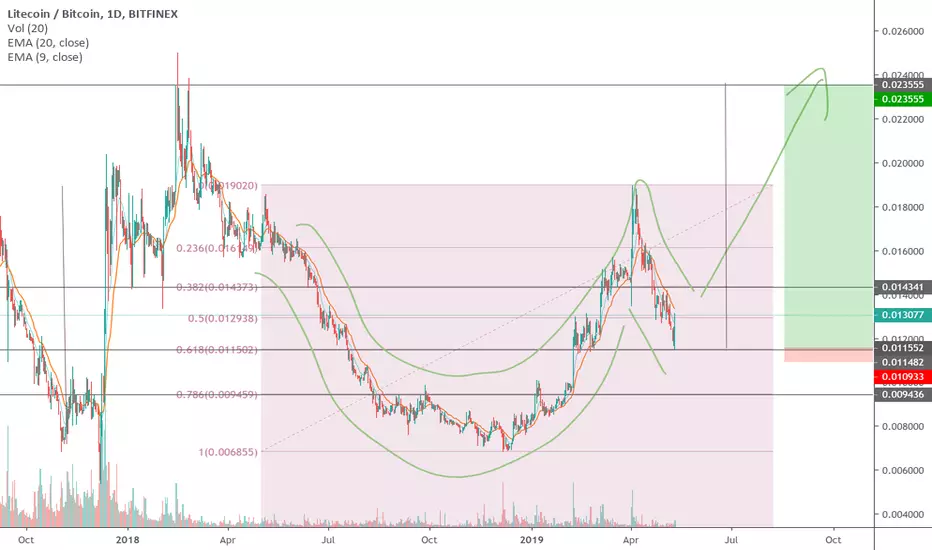
LTC/BTC Prj, P01E02. Nice pullback, go back inPrevious post
As you know, LTC has been one of the outstanding performers of 2019.
And as such, we must keep an eye out on it, due to the halving many believe has created the bullish trend + other factors as well, eg. BTC trend.
On the charts, LTC is looking good again, against USD\T and against BTC.
As per the chart, its hit a good level on the pullback.
One might be conservative and wait for another green candle on the 4 HRLY and pass a key resistance.
One should also track BTC, for now, its consolidating and we might have another day or two for LTC to shine (due to BTC dominance)
I will update the observations as time develops.
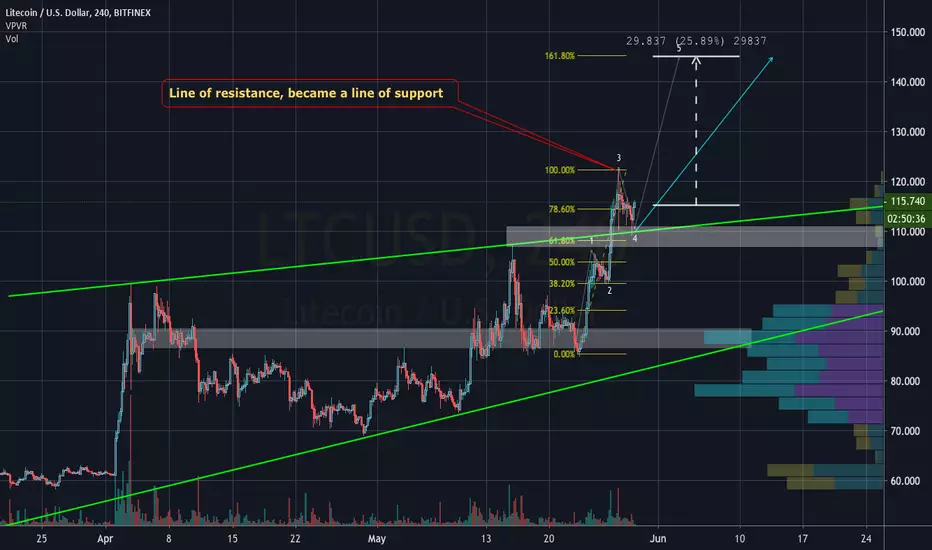
LTCUSDLine of resistance, became a line of support
Total books: $51,416,135.96
Global Bids: $26,632,851.52
Global Asks: $24,783,284.44
LTCUSD Waiting for his rocket !!!LTCUSD
Deal for 1 month for (45 %)
Bitfinex Bids $5,524,121.25 Asks $6,518,083.31
If you trade with leverage, determine the entry point or watch me, I will update if the situation changes.
I keep my hand on the pulse, put a pending order at a price of 77
LTCUSD Just the beginning.Just the beginning. Now bitcoin will find its resistance. And all I will go to the next altcoins. LIKE LITECOIN
Massive tea cup and handle pattern forming on LTCAfter retracing back to .618 fib level after having relatively healthy run for most of 2019, it looks like it has a lot more in store for the year.
I'd say to long the shit out of this but with equally tight stops. Havent seen anyone talking about this yet.
This would be invalidated on a break below support.
LTC - large degree running flat in the makingLTC has been leading BTC so far. Its correction started earlier and still in the making as running flat

LTC STILL HAS MORE ROOM TO PUSH UP!! (HOLD ON TO YOUR SHORTS)Hello friends , long time so see. LTC is finally getting some of the recognition it deserves, recently hitting .015 BTC on it’s way to it’s ATH at .02. I want to point out something many traders have been overlooking. As you can see on the hourly chart , we have some hidden bullish divergence. Notice the MACD going down while price, going up / staying steady… Same thing with the BTC chart. Market cap is growing while prices are being pushed down… Signs of accumulation. If the current trend continues , when the MACD pushes up the price will boost. I have some small sell orders around $59 and $63 USD hoping to maybe catch some wild price swings. If BTC can boost to 4200 we should see a pretty good upswing with LTC. I’m mostly a HODLer, finally back above water this month with the boost of ENJ coin. Hopefully some of my followers got in on that too. I really like LTC for a long-term pick. This is a very risky trade for the short term, but very solid in the long term. If BTC dumps , LTC will dump also, so please be aware of the downside. Please leave a like and subscribe , as I try to only post quality original content.
I am not a financial advisor and this is not financial advice.
LTC looking weak. Going to take this trade with some good RRreasons:
-bear div on lower timeframes and daily
-bear div on usd pair aswell
-pumping on poor volume
GL

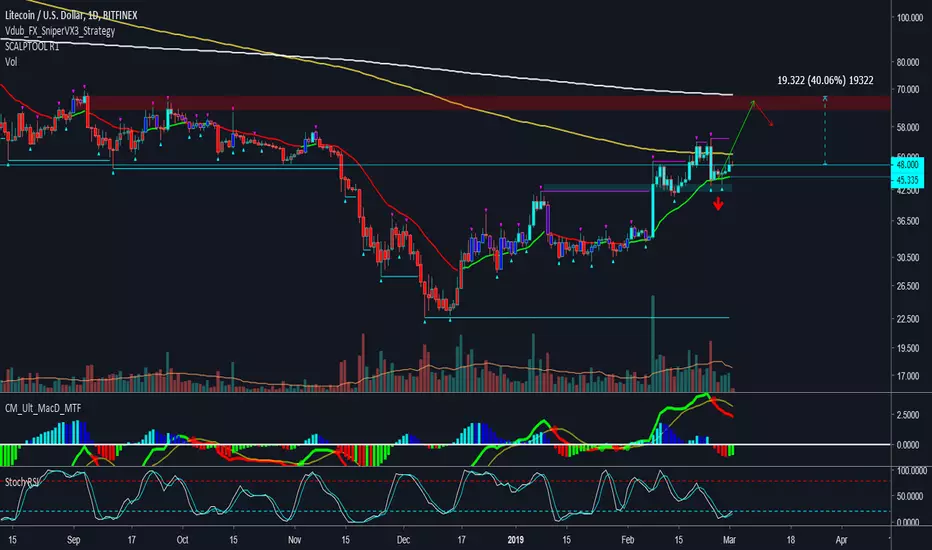
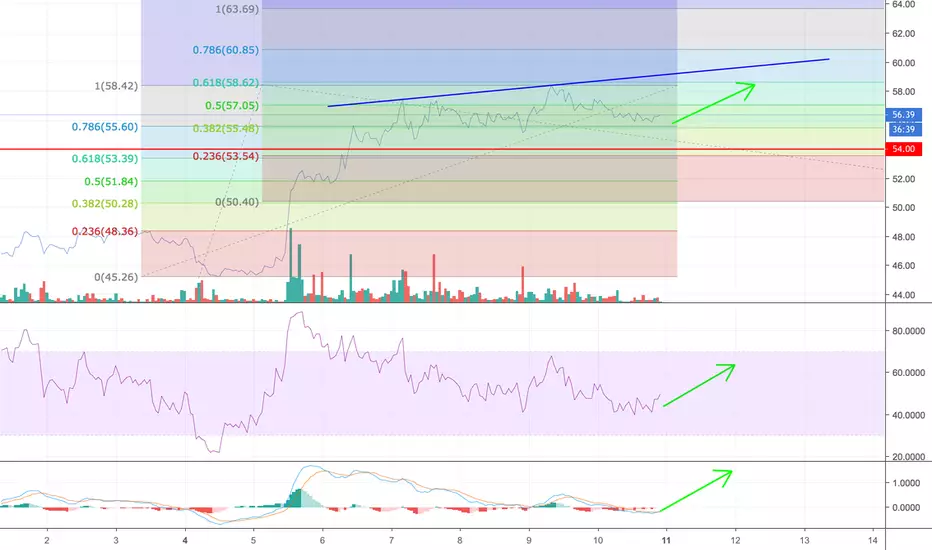
Is LTC Still Bullish Mode?? 1. As we can see 21 EMA daily is still green, which indicates we are still bullish (Green colour)
2. Support is around $ 43. Be careful if the price is under $ 43, it will turn 21 EMA daily to red. (Blue rectangle)
3. The closest resistance is at the 200 EMA daily around $ 51 (Yellow Colour)
4. This bullish trend target is around $ 63-70 (White Colour)
.
.
.
5. If you missed the train, you can place order around support price with tight stop loss.
Good luck to you :)