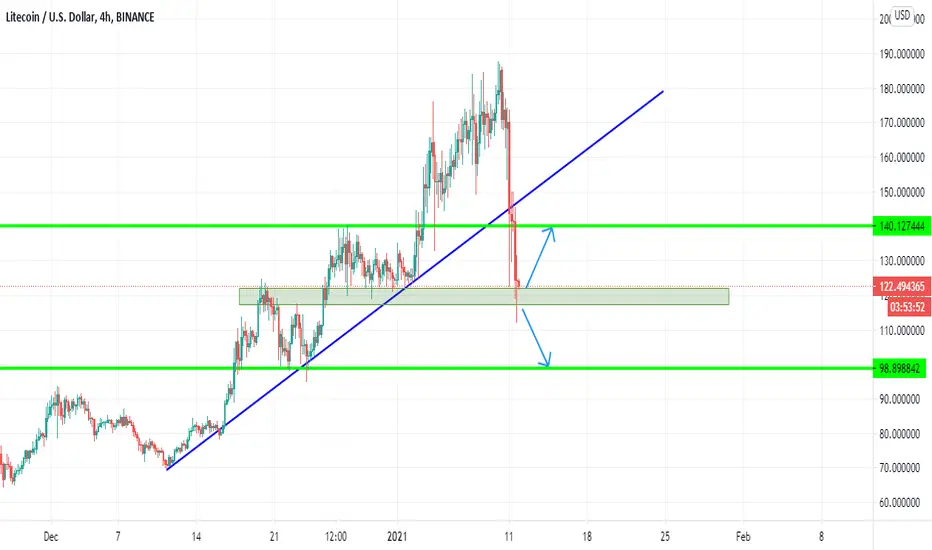
Litecoin LTC 4 hour vs 1 Day timeframeLTC Litecoin receives a sell signal on the 4 hours timeframe and another sell on the daily.
Please leave me a message if you want to test the buy and sell indicators that i am using.
Ltcusdidea

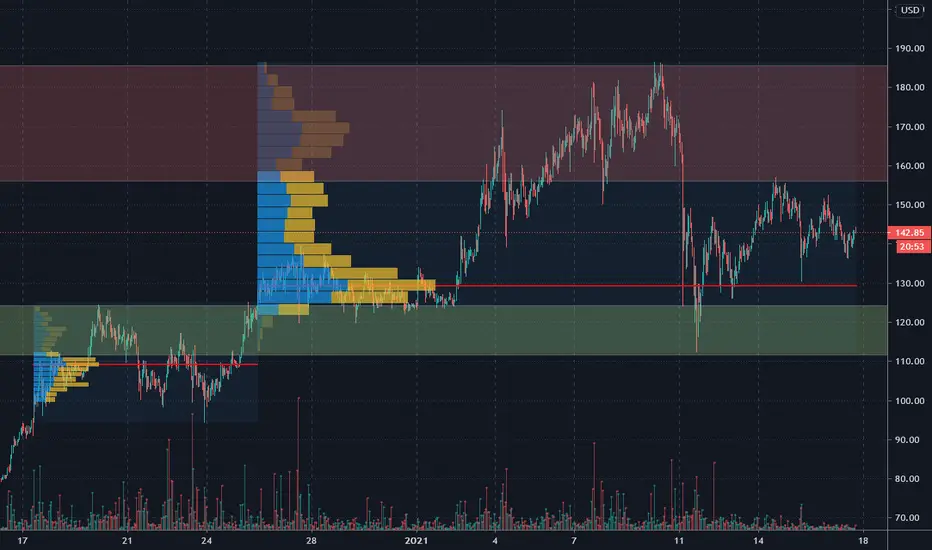
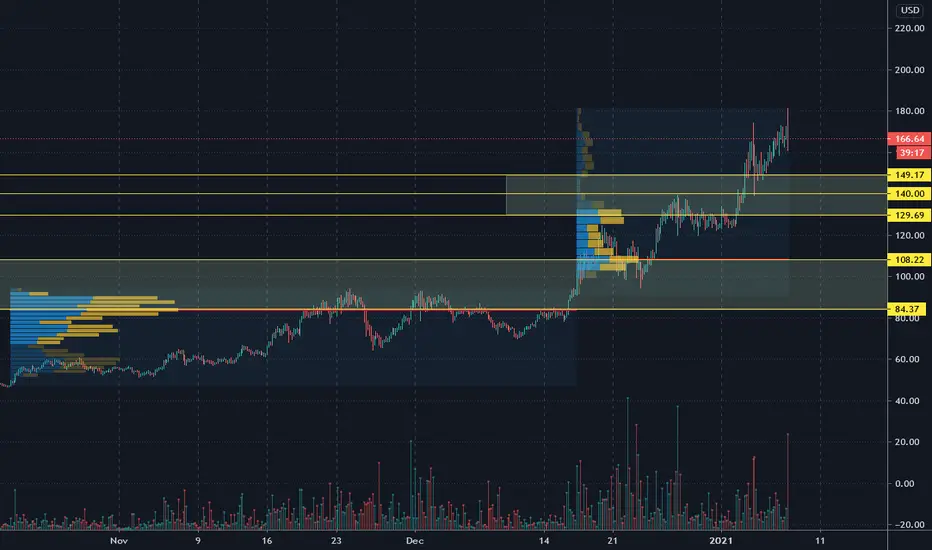
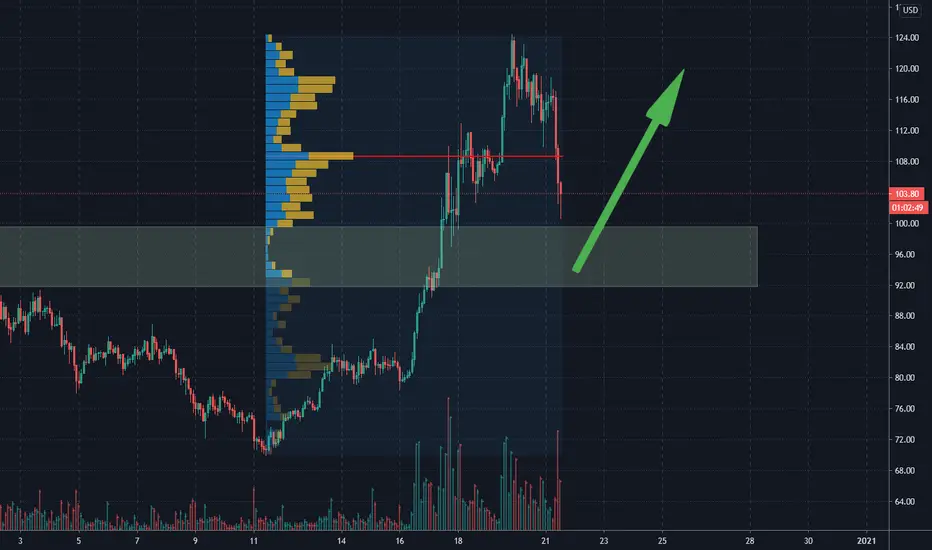
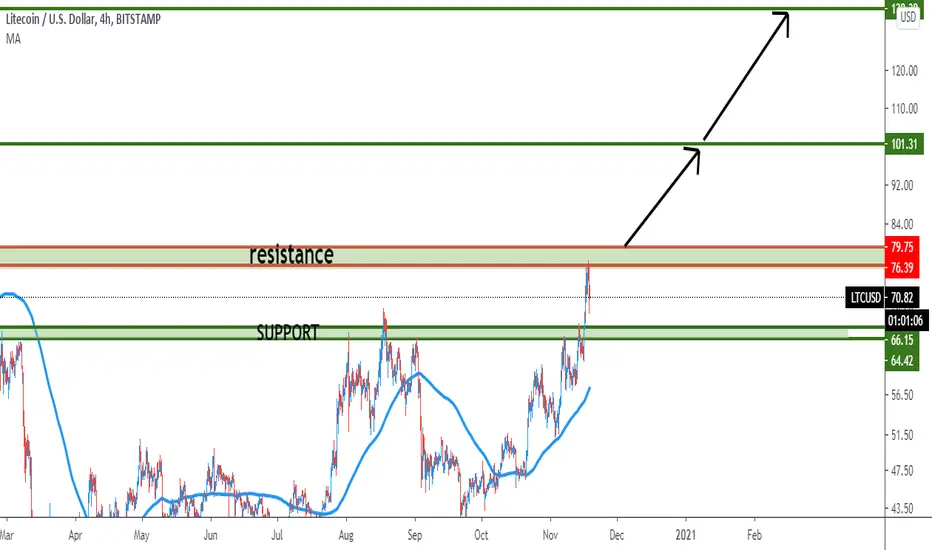
Litecoin (LTCUSD) support and resistance zonesLitecoin is now in neutral zone. We have to wait for support zone and build a long position.
check my proffile
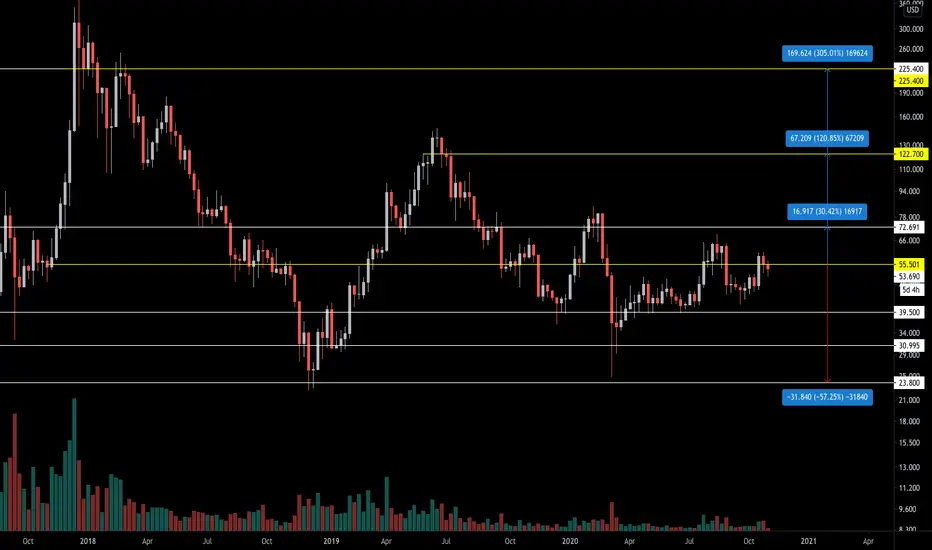
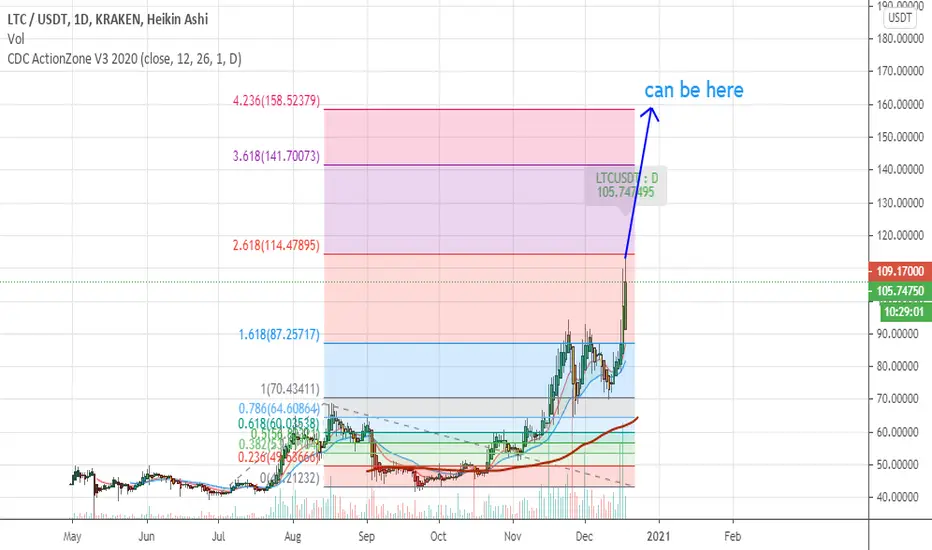
LITECOIN Parabolic move - Will it reach 330.00 level (.786 Fibo)LITECOIN
On December 2017 year end Litecoin has visited the high level around 430.00 And seen a rapid selling from that level and the earlier 2000% gains were wiped out entirely and it has started its upward journey In 2018 December as we can see
the cycle repeats itself during the year end as its pumped around 500% which is a 25% of the previous year end jump.
And from January month onwards its again started to falling towards 25.00 level. And we can see that 25.00 level has acted as strong support for the bull. Since end of 2019 this level has not breached and bear failed at this level.
From October 2020 the parabolic move has stared and its still running and its has managed to reach 2019 high level which is 145.00 level and even LTCUSD has managed to break this level and the retest has also happened and went above the .382 Fibonacci retracement level. The next major key testing ground was 0.50 Fibonacci level comes around 220.00.
From this level we can see a profit taking scenario might happen and we can expect short term fall back towards 0.382 Fibonacci. If that happened it would be a nice buying opportunity.
The 50,100,200 EMA's are acting as good support for the bull and Ichimoku cloud is also supporting the bullish trend . In Bollinger band it has reached around upper side of the band short term fall back towards middle band was expected.
Disclaimer!
This is not a financial advice

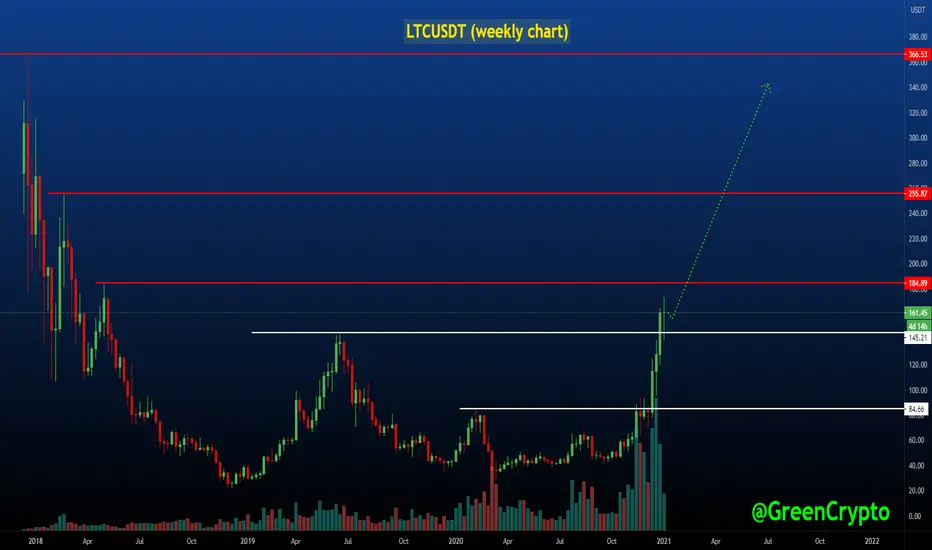
LTCUSDT (Litecoin) Next Target $365 ??#LTCUSDT Technical Analysis Update
Resistance breakout in weely chart
LTC/USDT currently trading at $160
Buy level: $150 to $160
STOP LOSS: Below 120
Resistance level 1: $184
Resistance level 2: $255
Resistance level 3: $365
Max leverage: 2X
ALWAYS KEEP STOP LOSS...
Follow our Tradingview Account for more Technical Analysis Update, | Like, Share and Comment your thoughts.
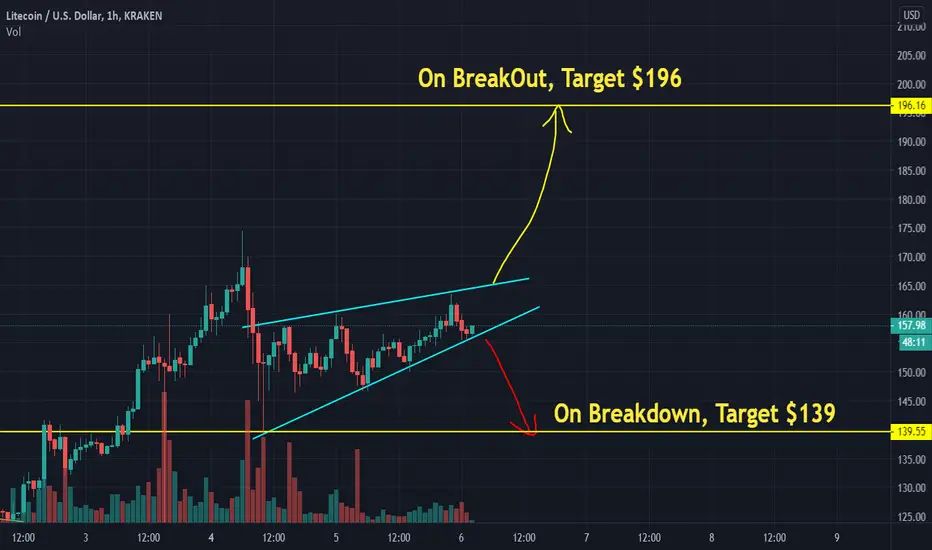
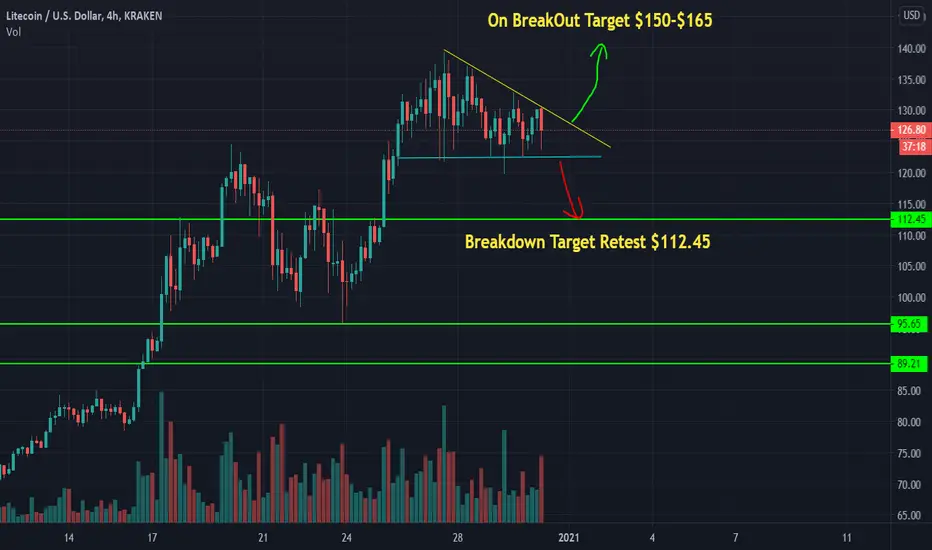
$LTC - Bull Target $196 & Bear Target $139 $LTC.X #LTCOn BreakOut, Target $196
On Breakdown, Target $139
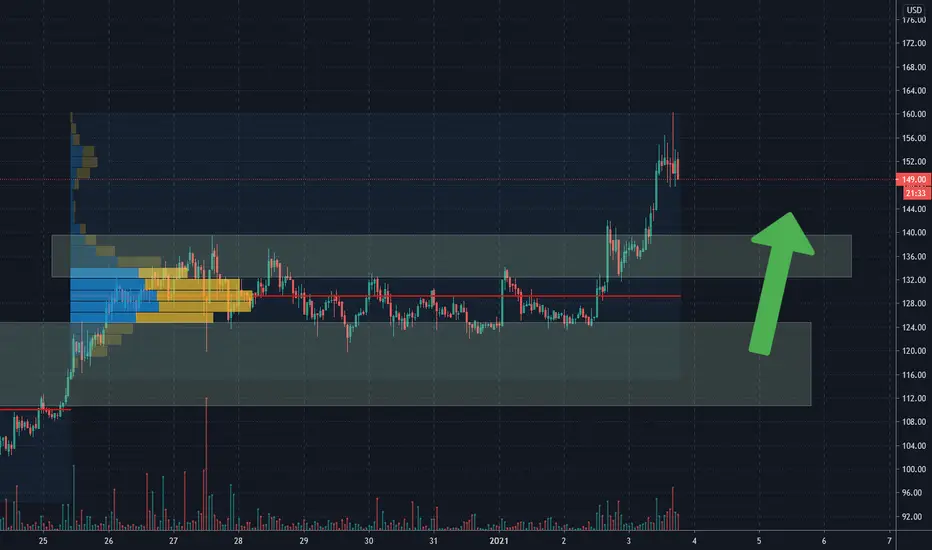

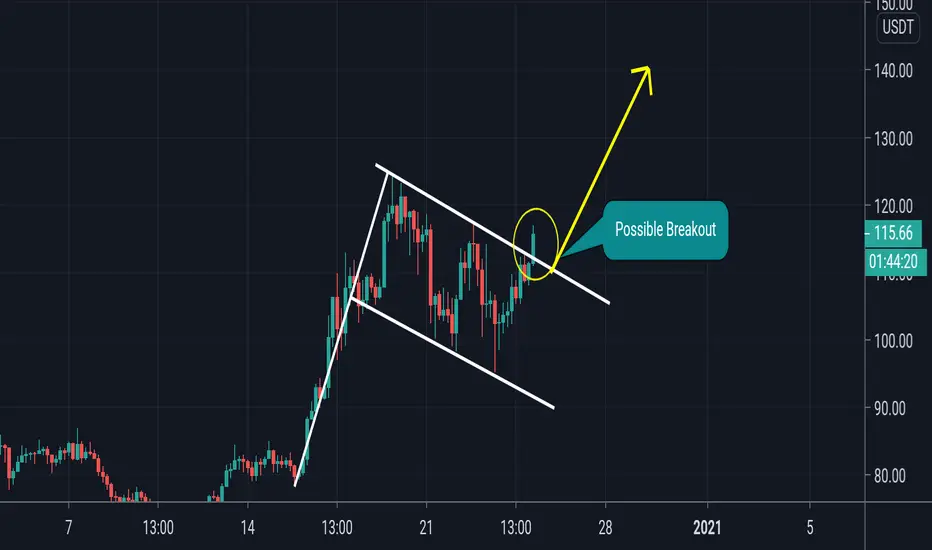
LTC (Litecoin) possible Breakout LTC / USDT
Possible Breakout from bullish pattern
If this pattern successed it will moon
I want to remind you that we already had signal about LTC in my channel and bought it early around 105$
Also you can check my last idea about LTC I told you to buy the pullback 👇👇:
Good luck 🤞


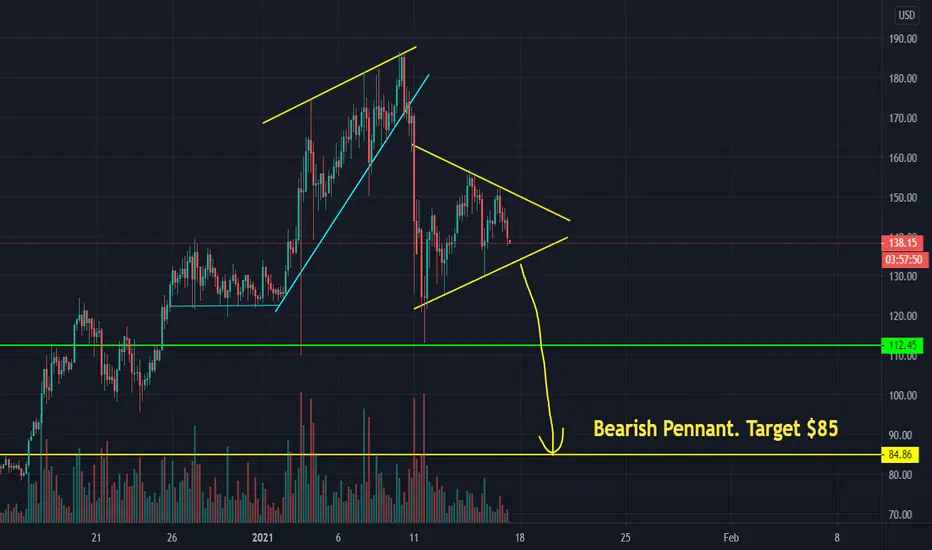
LTC target $70Hello Friends
Best time to short all ALTS , if BTC is going down all these will follow
Chart is self explainatory
Support idea And Provide Suggestions If Any!

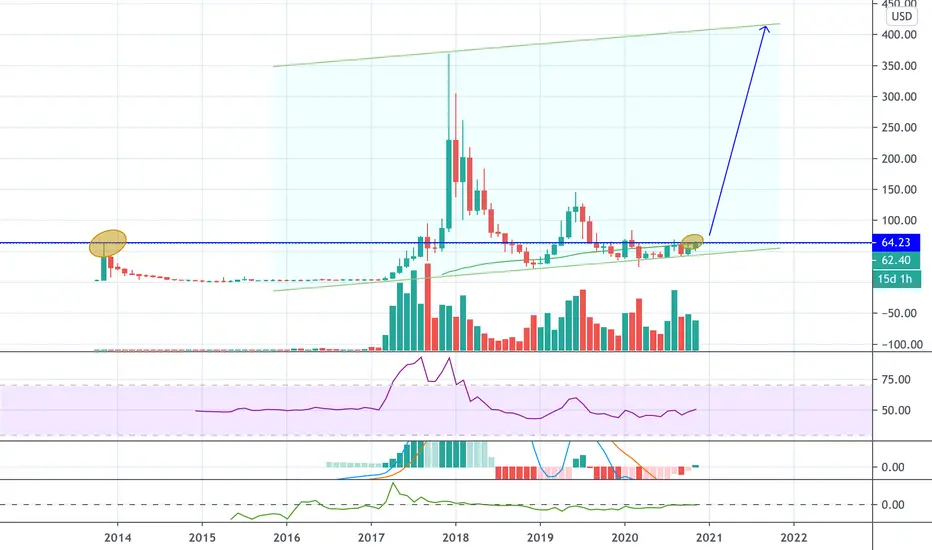
Litecoin 6 year chart - GOING TO $400! IF LTC breaks this blue line - lights out m0z3RFak3rs! Going to $400.00. In fact, Jerome Powell himself will proclaim LTC as a new reserve currency just because ya'll anal.ists don't know $h!t
Save this analysis on your home screen, download it in JPEG, print it and put on your wives windshield. Cosmic gates open only once...well sometimes twice. This is your second chance to F it up.
Good luck fellas. Dont do anything stupid like buy LTC and hope it shines moonlight on you.
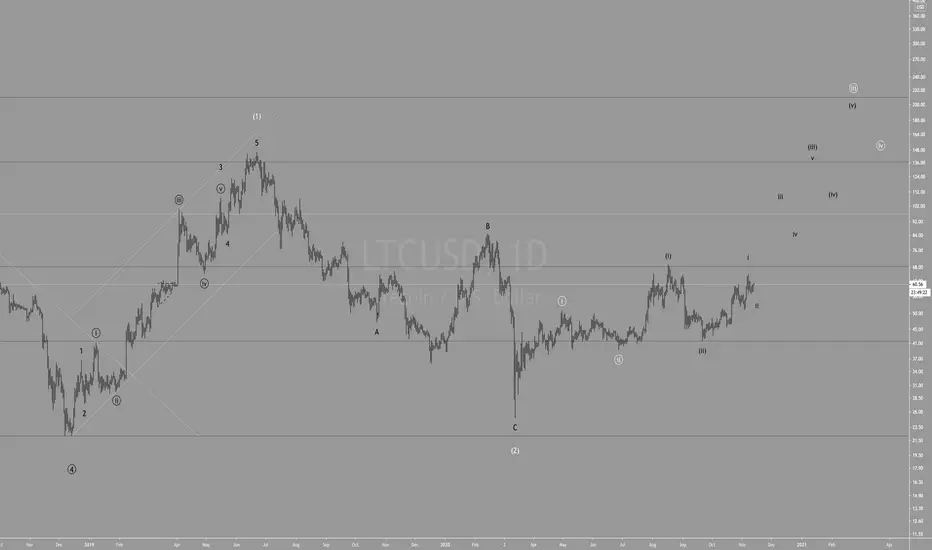
Litecoin - Daily UpdateLitecoin - Daily
Bottom Line: Higher in the subdivisions of wave (iii).
Key Levels: Below 42.38, 42.01, 43.67 Above 68.92, 84.13
Outlook: Against 42.38, the focus is on higher in a developing advance, wave (iii) of ((iii)).
Analysis: We're watching for evidence LTC ended its second wave correction at 57.17. A break above 61.98 would bolster that outlook and setup a challenge of the next key level at 64.74.
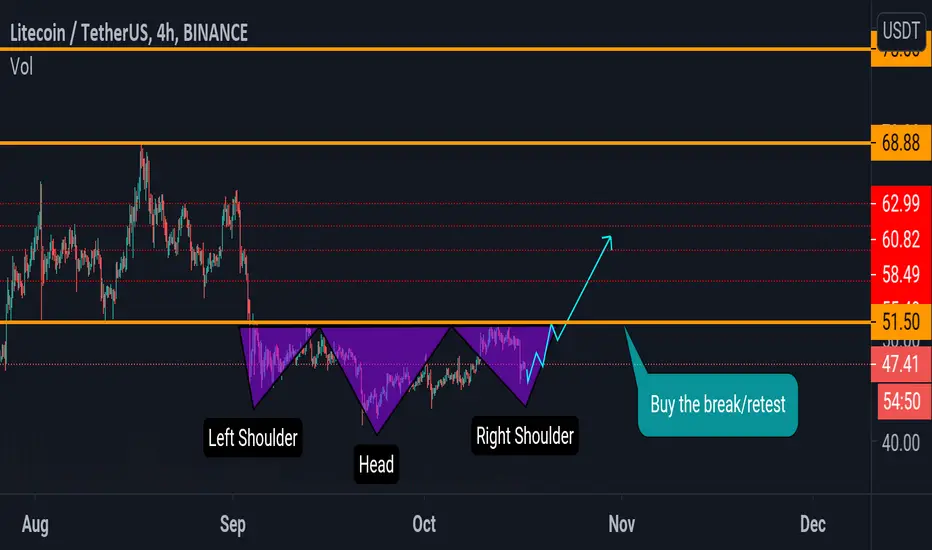
LTC/USDT possible inverse H&S Ltc/usdt
Possible inverse head and shoulder this pattern is bullish but not enough
I put analysis days ago about best buy area of LTC one of them after break of 52$
This pattern help and confirm past analysis
See here my previous idea about ltc :
We will buy ltc only if it break and closed above 52$ on 4h candel or daily candel
This trade is very low risk one because around 52$ is strong resistance multiple times rejected the price before ..once break I expect ltc will fly
And stop loss should be close again below 52$
If you search for low risk high reward trades this is one of them
Targets (take profit targets ) are shown in the chart
LTC/USD - Moon or DoomAt an important level, if we can reclaim 55.50ish on weekly I'll look for swings.