Ltcusdlong

Litecoin has massive pump potential LTCUSDon the LTCBTC chart the 1.618 fib level is a point of interest, where price will likely be rejected bullishly with aggression
As has been observed in the past
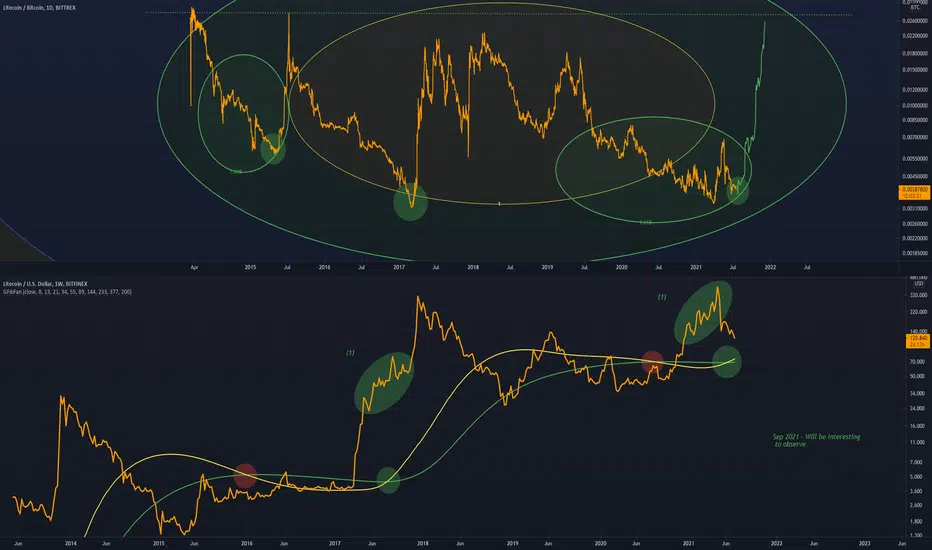
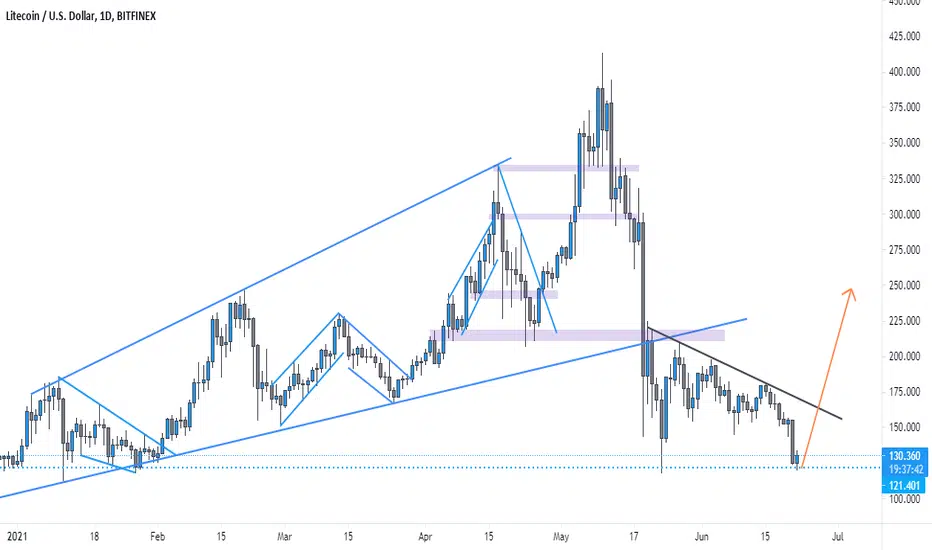
On the USD pair a Golden cross has been recently observed, the previous golden cross on LTCUSD led to the ATH
Will we see ATH this year? likely.
Deathcrosses in red, golden crosses in green
(1) is a comparison point of very similar price action
May be this happened weekend/ LTCUSDDon't Chase 125$
May be like this happened
Several times it will help to pick up
May be this weekend
Will soon
If u like push @ leave comment

LTCUSDTARGET 200
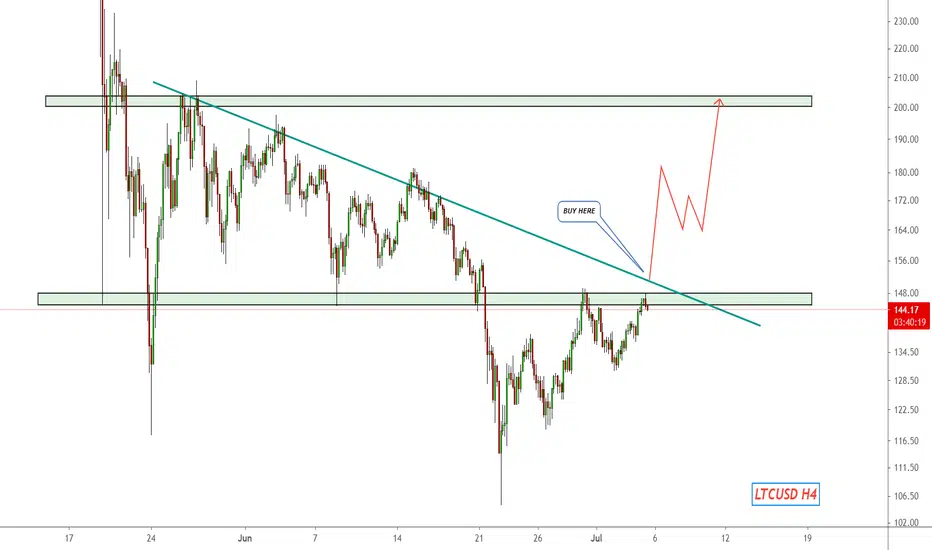
Wait for breakout
Please consider to put a like to my idea for supporting me & subscribe for more ideas.
Idea is not the financial advice!
Common Bullish Advancement StructureAIONUSD and LTCUSD are both sharing a similar bullish advancement structure.
This is a common one for Litecoin with a similar pattern appearing before the massive move to ~300 in 2017
I will link the chart below
I have seen this structure across many coins, a good sign?

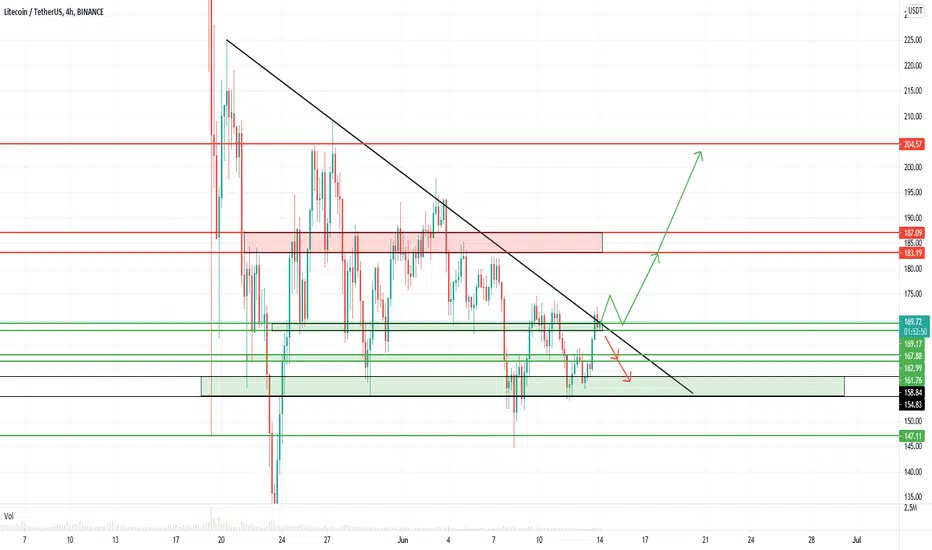
Litecoin LTC Bullish Trendline BreakoutThe cryptocurrency Litecoin LTC about to breakout of trendline pattern. Also notice bullish divergence created on Williams Vix Fix Indicator.
Similar pattern has happened before and a good move to the upside occured.

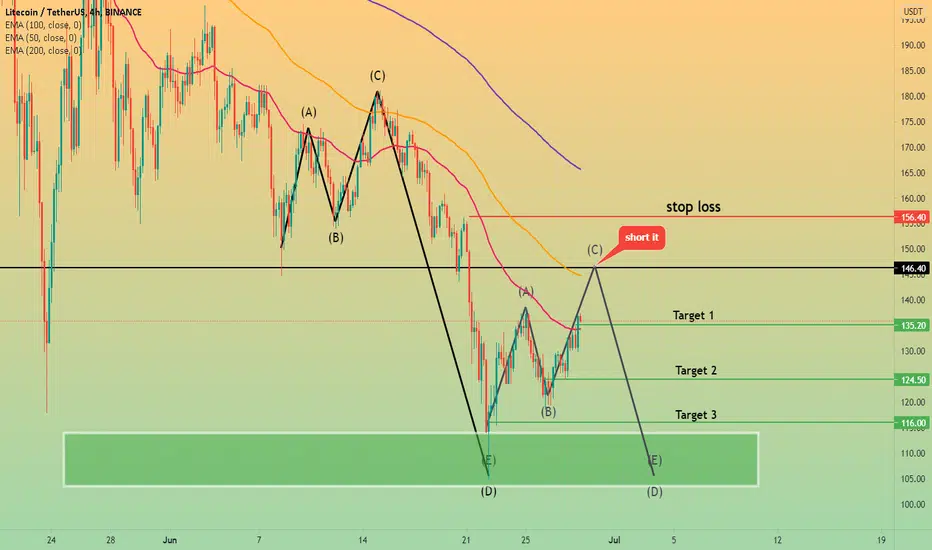
short litecoin ... safe 75% profits hereshort:✅ 146 - 148 ✅
🎯TARGETS:
1- 135.20
2- 124.50
3- 116.00
💵 Trade Size: 3% of Portfolio
🚫Invalidation(SL): 156.40
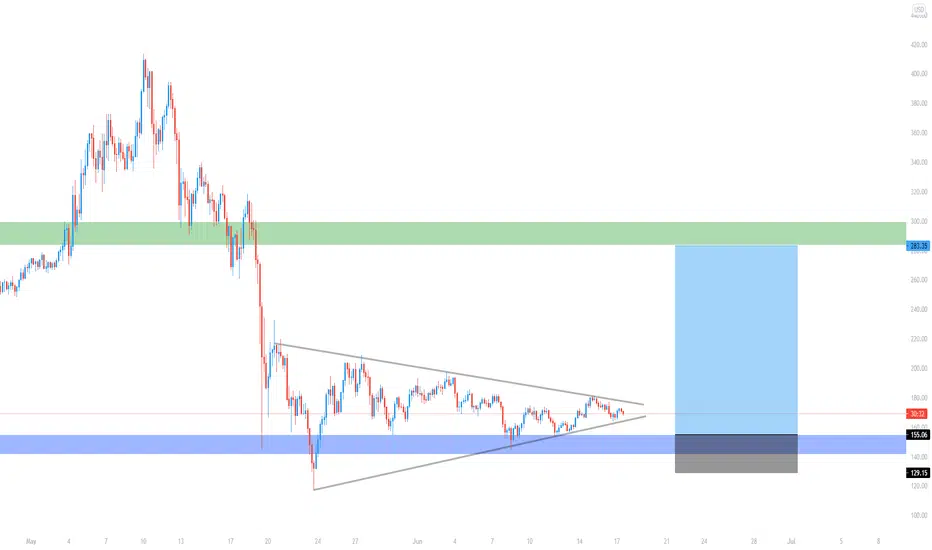
LTC SWING LONGI will be buying ltc in this zone for a bounce, I will average the entry if necessary to the invalidation point


LTCUSD Buying OpportunityDouble bottom formation, wait for a bullish pressure for your next trading opportunity.
👇 Follow for more daily forex content and education 💪
Good luck to you!
Don't forget to like and share, it really helps.
Stay tuned.
This is just an idea, not financial advice.

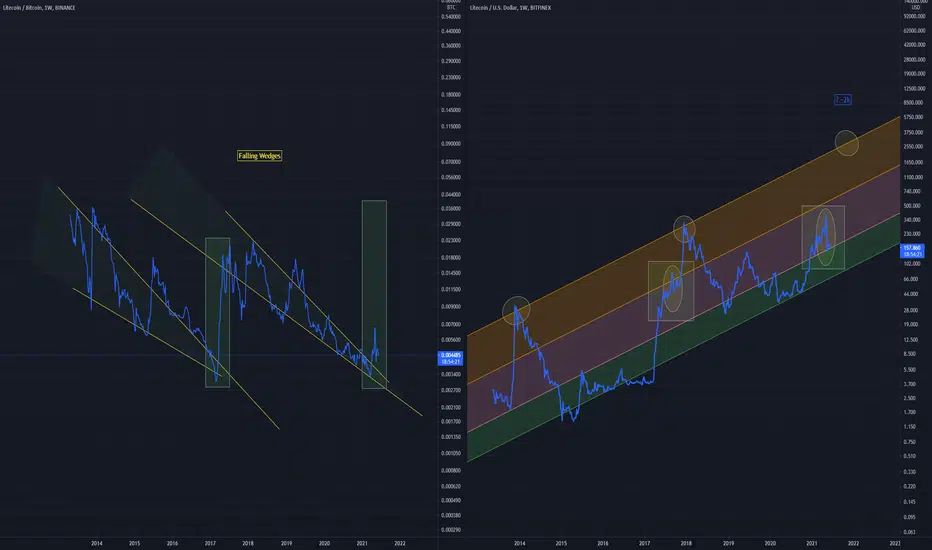
More Litecoin LTCUSD / LTCBTCLTC/BTC can be seen reaching a critical area within a falling wedge that has formed
while the USD pair can be seen forming a similar price pattern comparable to the 2017 booster that pushed the price to ~300
From this and the Fib Channel I draw the conclusion that Litecoin could hit ~2k by early - mid 2022
One of the first coins I ever owned, can't go wrong
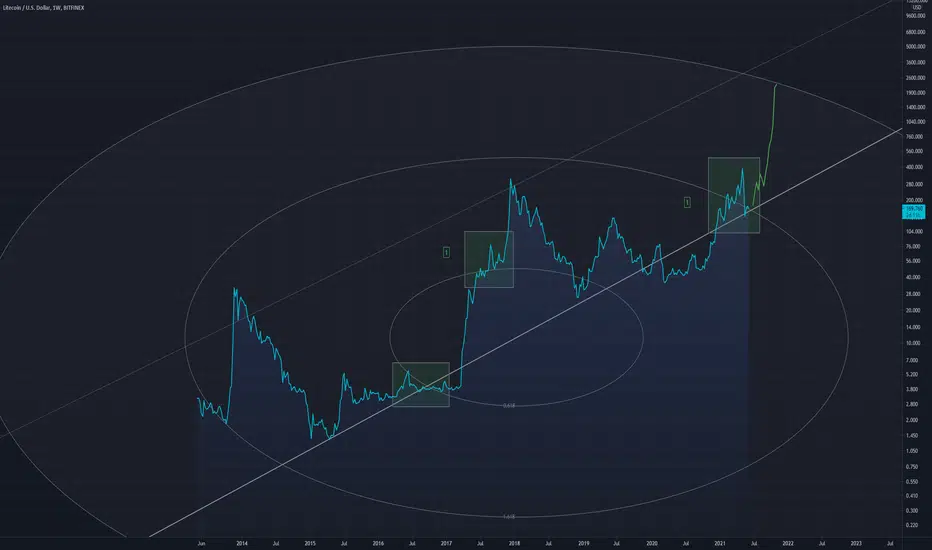
Litecoin Move to $2000I think a big move is coming for LTC
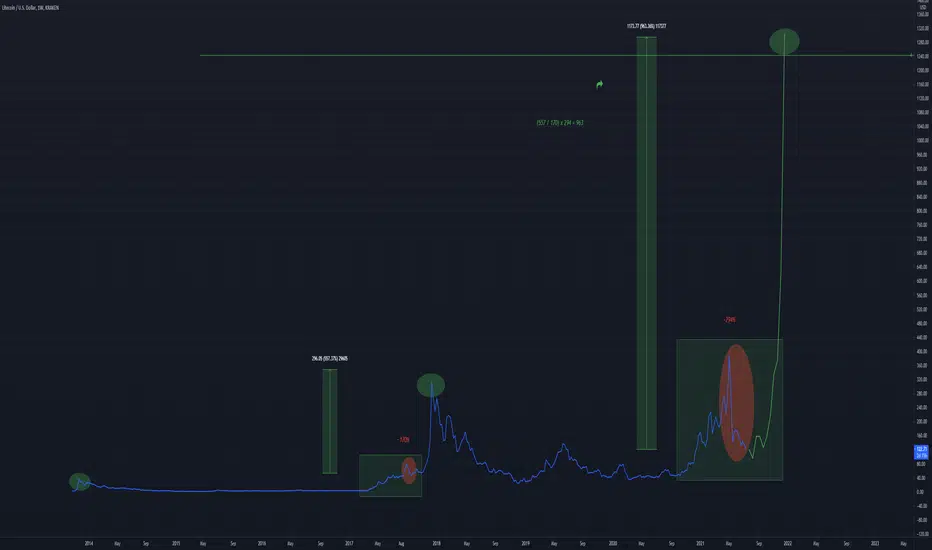
Just as happened at .618 (labelled 1), at 1.618 Price has climbed over the fib ring for that level, last time it led to an explosion in price
Is another explosion approaching?
Wishful thinking, but also a possible reality.
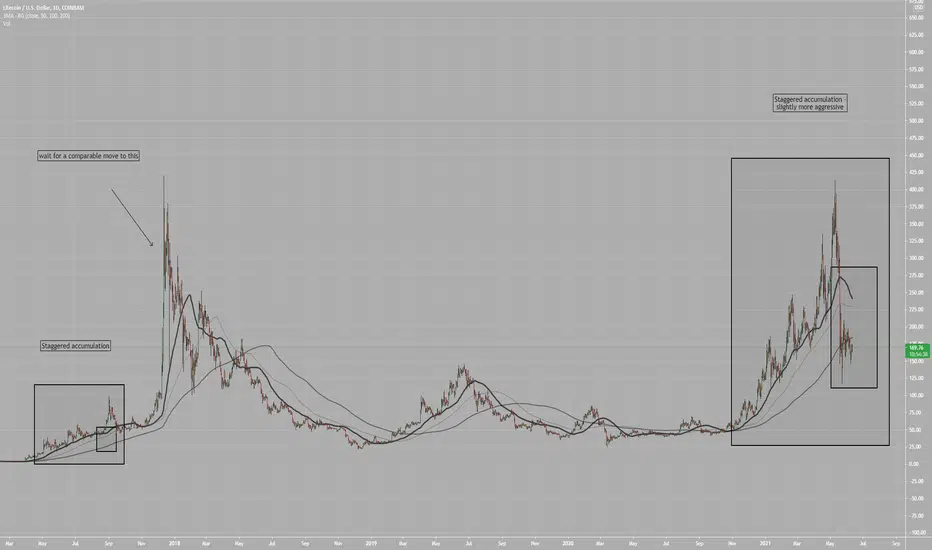
Litecoin Clear Similarities - BULLISH Litecoin has made some staggered moves upward
Similar scenario can be seen in 2017
This is a good sign for the bulls is all I can say
UP !
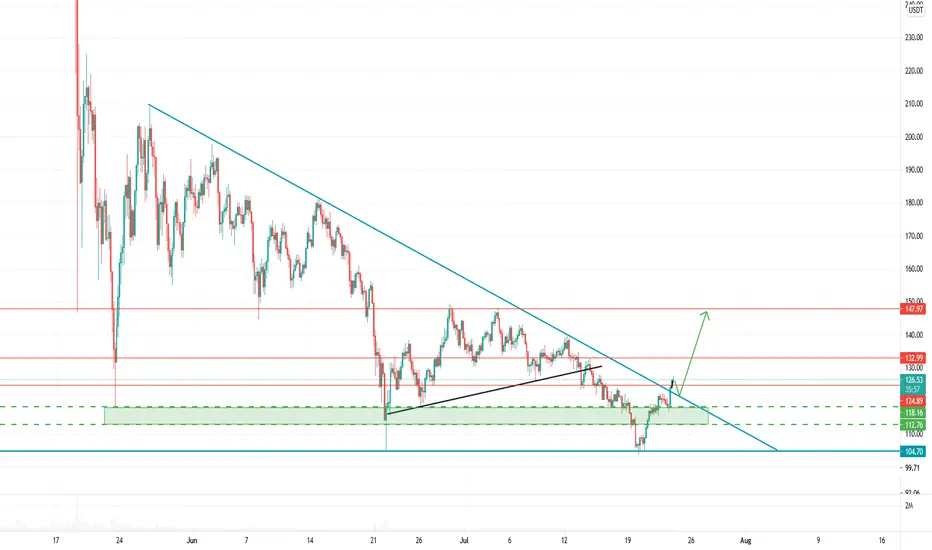
ltcusd ideaHeres what I'm thinking is going to play out.
A drop to the high 90s low 100s. At that point I expect a rsi divergence on the daily which should catapult us up to retest the top of the channel. Hopefully break upwards at that point and aim for 220 resistance.

LTCUSDT IchimokuBeen looking over this chart this morning. Really looks like a good setup.
Could see a little sideways action but looking to hunt some target soon.
Post pair request below. Thanks!


LTC Fibonacci RetracementLitecoin has bounced off .618 fib level
This is a good sign and will likely fully recover

$600 LITECOIN (BUY NOW!)If you feel you have missed the ride, then this is your only other chance to hop on this train!
