🔥LITECOIN FALLS WITH BTC: THE 2 BEST ENTRY POINT TO LONG!🔥 Hi friends! Litecoin has a halving in 140-160 days. That's why it was the top gainer of the last months. Now it makes a pullback and it's time to find good entry point because BTC still has the strength to grow and push such alts as Litecoin up. All the entry points and targets in idea!
📊 TRADING PLAN FOR LTC:
🔥 pullback to $75-78 value area and test it as the support
🔥 volume growth
🔥 bullish BTC
🚩 The high possibility that LTC makes a local shakeout below $85 and continues to grow. The main precondition is volume growth. So keep an eye on it during the upcoming days.
✅ MY TARGETS FOR LTC:
1. $98 - the key level
2. $105 - the key level and local high
3. $134 - the key level and local high
Friends, what is your most traded altcoin (or altcoins) last months? Write in the comments!
💻Friends, press the "boost"🚀 button, write comments, and share with your friends - it will be the best THANK YOU.
P.S. Personally, I open an entry if the price shows it according to my strategy.
Always do your analysis before making a trade.
LTCUSDT

LTCUSDT 1HLTCUSDT 1H
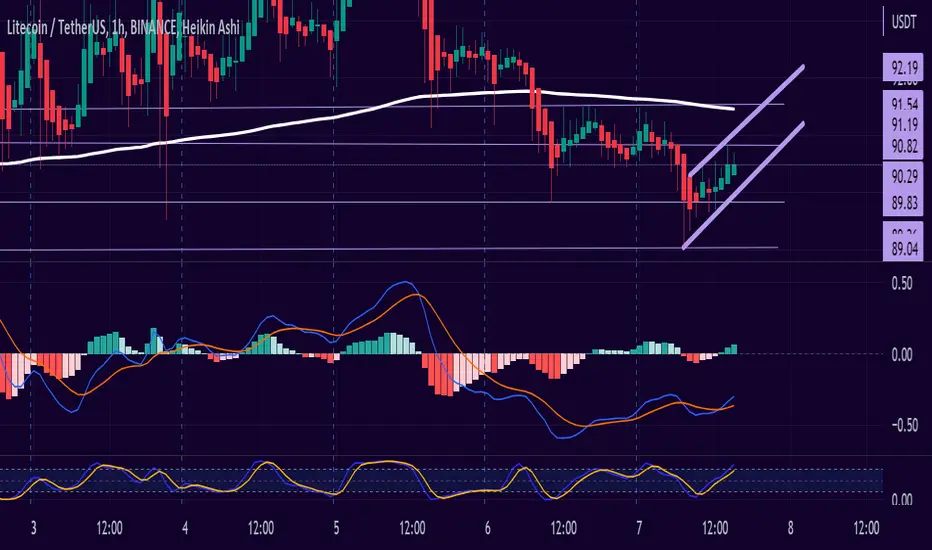
With ascending tops and ascending bottoms, LTc starts a discreet upward channel, in search of the MM200 at 91.54, however there may be a retreat due to the next week where unemployment or CPI data will be released next week, but, from the point of view technician, LTC is looking for the MM200
LTC halving is planned for July 2023, in previous halving cycles, there was a run before the event, it could happen again
Based on the chart, an entry around 85.54 is interesting. This is a strong support area that could be tested and pull back.
Here are the supports and resistances in the 1H timeframe:
Brackets 89.83 / 89.03
Resistances: 60.82 / 91.54
MM200: 91.54
RSI: Exhaustion of Buying Forces
MACD: Buyer
#Litecoin Prices inside a Bull Flag with Resistance at $95Past Performance of Litecoin
Litecoin prices, like BTC's, are consolidating. For LTC, the coin has resistance at $95 with support at $87, as defined by the bull bar of March 23. Besides $87, the middle BB is a dynamic support level defining the uptrend. Therefore, as prices move horizontally, the uptrend remains unless there are sharp losses confirming the losses of April 6.
#Litecoin Technical Analysis
From the daily chart, prices are inside a falling wedge with resistance and support shaped by the bar of March 23. The result is a bull flag, with traders still bullish from an effort versus result perspective. This is because prices are still within the bullish engulfing bar of March 23, a candlestick with high and wide-ranging trading volumes. As such, unless there is a breakout above $95, traders might look for entries on lower time frames, loading on dips above $87. Any loss below $87 may see LTC dip to $75 and even March 2023 lows.
What to Expect From #LTC?
The uptrend remains, but market participants are apprehensive despite the Litecoin halving event around the corner. For now, immediate support levels are critical, and how prices react will shape the short to medium-term price action.
Resistance level to watch out for: $95
Support level to watch out for: $87
Disclaimer: Opinions expressed are not investment advice. Do your research.

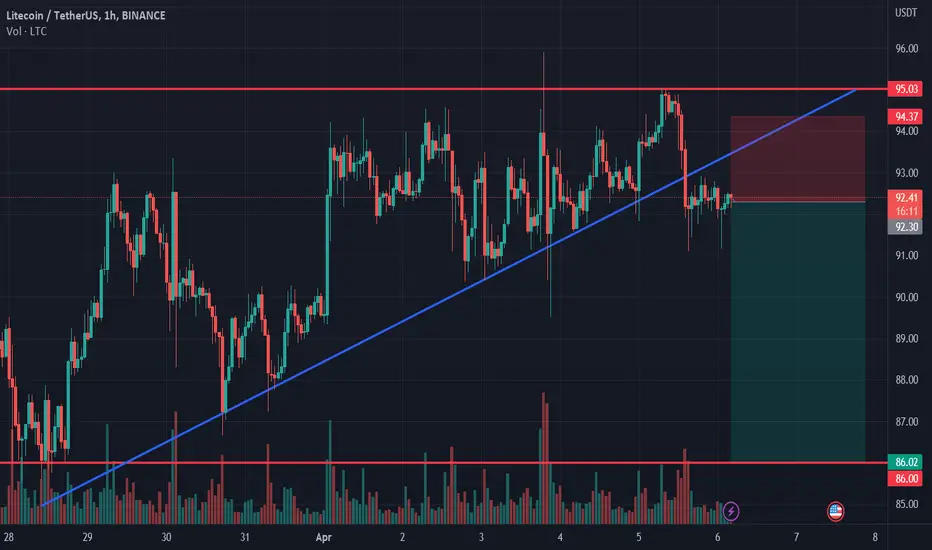
LTC USDT LONG IDEALTC/USDT has confirmed an ascending triangle pattern and if breakout it can touch 105.70 at least and maybe higher.
tp:105.7
sl:86.85

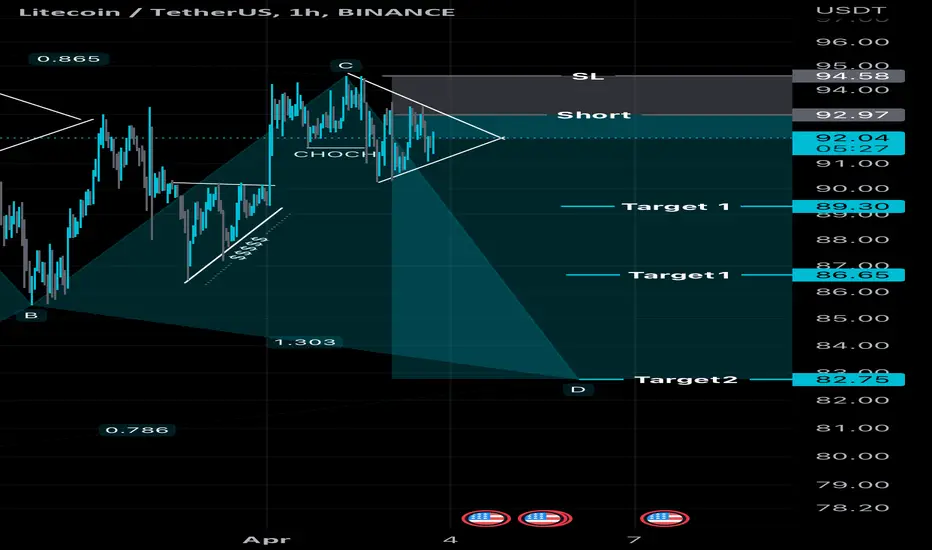
Litecoin shortLitecoin bounced off the resistance level. Asset broke trough off the ascending trendline. Bearish movement to support level at 86 is possible.

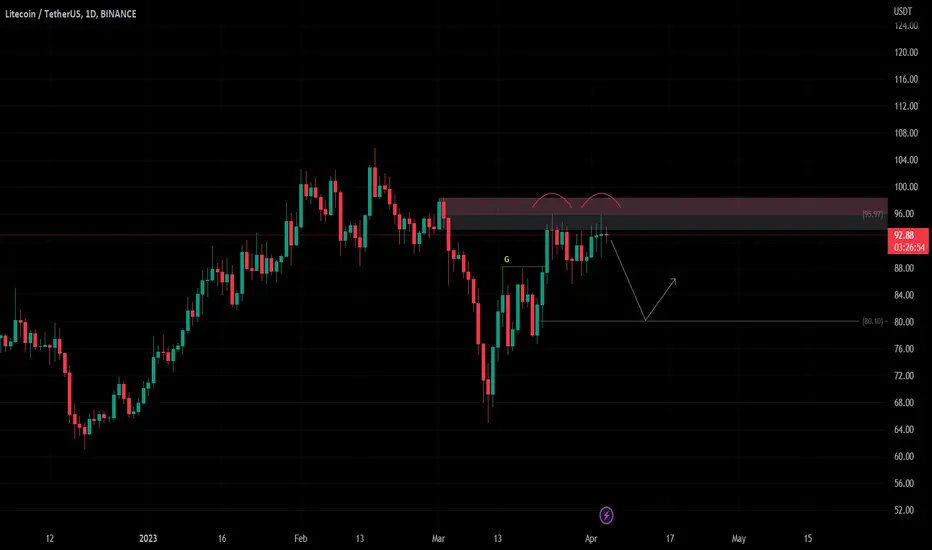
LTCUSDT Daily chartLTC after recovery now stuck below an order block .In the chart, we can see the double top pattern and it also seems that there are not many buyers for this range. I think the price will go back down to break the resistance.
Litecoin to break higher?Litecoin - 24h expiry - We look to Buy a break of 95.51 (stop at 92.51)
Posted a Double Top formation.
There is no clear indication that the upward move is coming to an end.
Daily signals are mildly bullish.
95.69 has been pivotal.
A break of yesterdays high would confirm bullish momentum.
Our profit targets will be 102.51 and 103.51
Resistance: 94.50 / 95.69 / 98.00
Support: 91.00 / 90.00 / 88.50
Please be advised that the information presented on TradingView is provided to Vantage (‘Vantage Global Limited’, ‘we’) by a third-party provider (‘Signal Centre’). Please be reminded that you are solely responsible for the trading decisions on your account. There is a very high degree of risk involved in trading. Any information and/or content is intended entirely for research, educational and informational purposes only and does not constitute investment or consultation advice or investment strategy. The information is not tailored to the investment needs of any specific person and therefore does not involve a consideration of any of the investment objectives, financial situation or needs of any viewer that may receive it. Kindly also note that past performance is not a reliable indicator of future results. Actual results may differ materially from those anticipated in forward-looking or past performance statements. We assume no liability as to the accuracy or completeness of any of the information and/or content provided herein and the Company cannot be held responsible for any omission, mistake nor for any loss or damage including without limitation to any loss of profit which may arise from reliance on any information supplied by Signal Centre.

Litcoin shows to many potential bullThe litcoin rise from 69 since 9th march to 96 levels it will rise more due to break out the trend line resistance i expect above pointed levels.

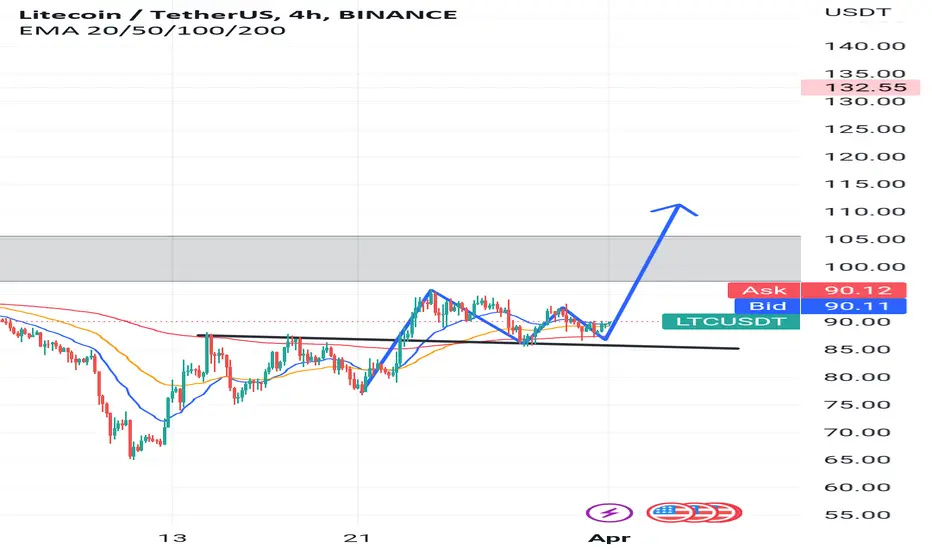
LTCUSDT heading for 4h support, long favorable from thereThe price is heading towards 4h support zone. Once the price reaches this zone, a long should be favorable at least to the 92.53 level.


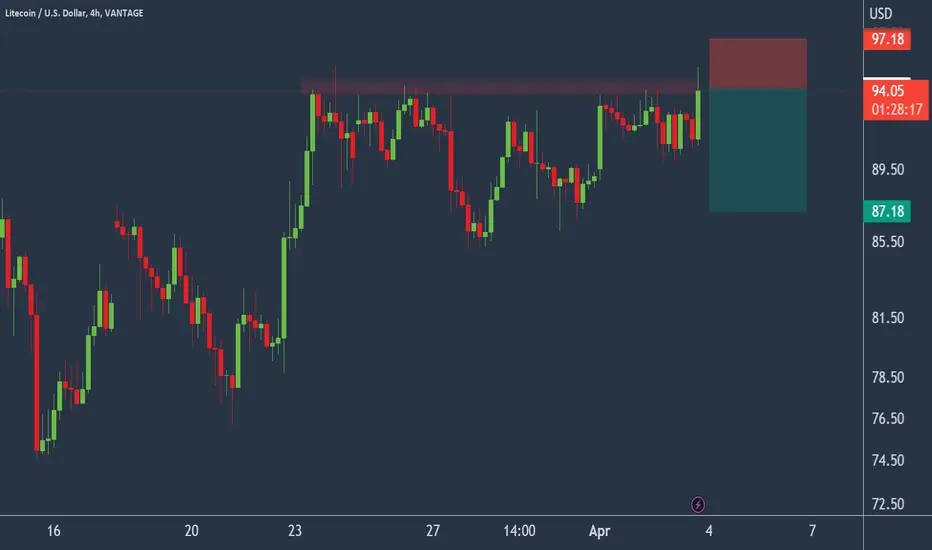
Litecoin being a good market sell?Litecoin - 24h expiry - We look to Sell at 94.18 (stop at 97.18)
94.50 continues to hold back the bulls.
94.52 has been pivotal.
Early optimism is likely to lead to gains although extended attempts higher are expected to fail.
Although buying has been posted overnight, the rally has been limited.
We look for a temporary move higher.
Our profit targets will be 87.18 and 85.79
Resistance: 93.00 / 94.50 / 95.69
Support: 90.00 / 88.50 / 87.00
Please be advised that the information presented on TradingView is provided to Vantage (‘Vantage Global Limited’, ‘we’) by a third-party provider (‘Signal Centre’). Please be reminded that you are solely responsible for the trading decisions on your account. There is a very high degree of risk involved in trading. Any information and/or content is intended entirely for research, educational and informational purposes only and does not constitute investment or consultation advice or investment strategy. The information is not tailored to the investment needs of any specific person and therefore does not involve a consideration of any of the investment objectives, financial situation or needs of any viewer that may receive it. Kindly also note that past performance is not a reliable indicator of future results. Actual results may differ materially from those anticipated in forward-looking or past performance statements. We assume no liability as to the accuracy or completeness of any of the information and/or content provided herein and the Company cannot be held responsible for any omission, mistake nor for any loss or damage including without limitation to any loss of profit which may arise from reliance on any information supplied by Signal Centre.
Gartley pattern detectedGartley pattern not activated yet . But can take a chance to take a trade from C to D with tight stop loss .

Gartley pattern detected Gartley pattern not activated yet but can take a chance for this trade with tight stop loss .
LTCYSDT LongAs I can see on the chart, an attempt to break through a strong sell zone should now begin.

LITECOIN Litecoin starting to pump?
Trade base on your own decissions
This is not Financial advice
Follow for more
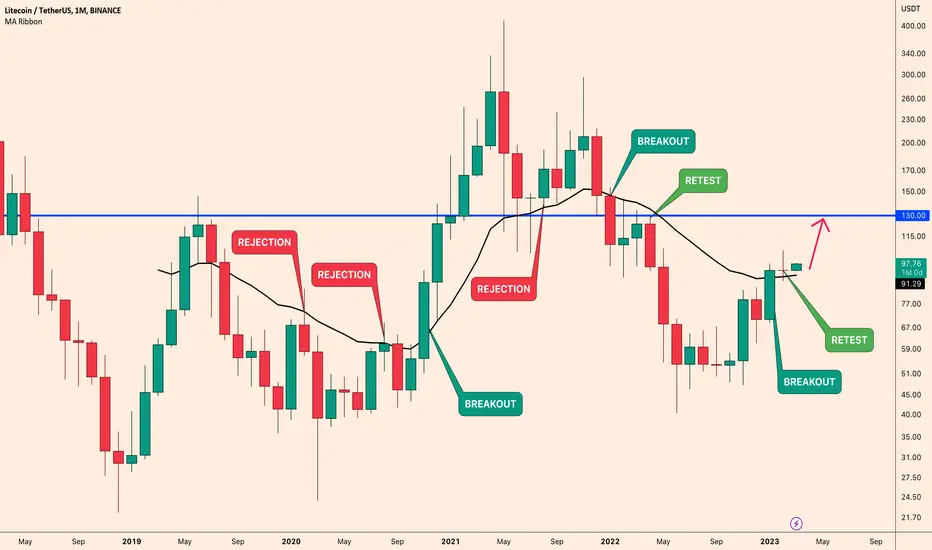
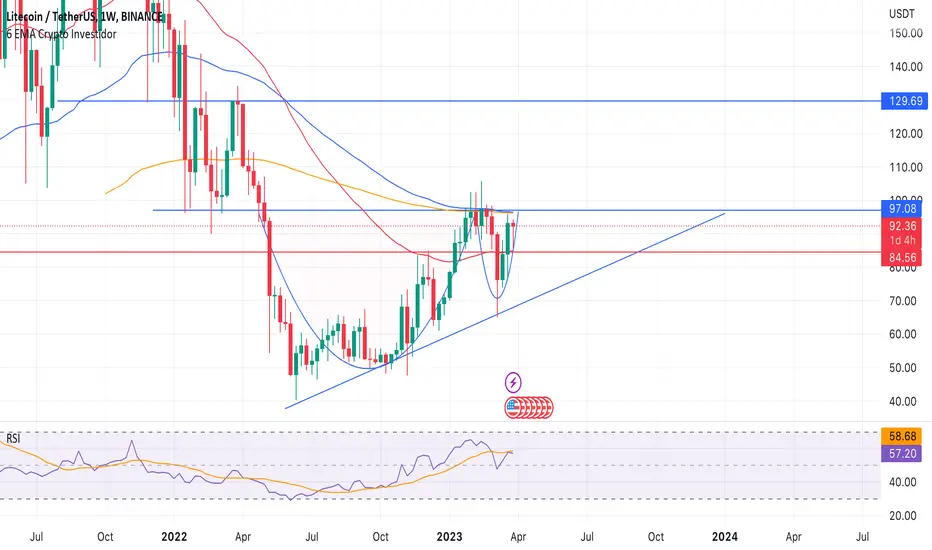
LTCUSDT 130? WHY NOT?Very strong coin LTC. So far it shows only its strength. right now very important price is 97.08 should close (WEEKLY TF) above to be bullish. Once it does i dont see any problem to go 130!
The rest you can see on my chart
LTC is going to be bearish soonLTC is going to create an Inverse Cup and handle pattern which means the price will be having a downfall pretty soon. The pattern has not formed completely but when it happens we shall expect a reaction from the resistance level and afterward we shall see a Dump .
_ _ _ _ _ _ _ _ _ _ _ _ _ _ _ _ _ _ _ _ _ _ _ _ _ _ _ _ _ _ _ _ _
🌍Thank you for seeing idea .
Have a nice day and Good luck.

LITECOIN BullishLitecoin creates continious pattern falling wedge
Buyers come into market and support it many times
LTC is Ready to fly
A pullback is expected before start to up
LTC/USDT 4HInterval Resistance and SupportAs the second chart in today's review, we'll be looking at LTC against USDT, also on a four-hour timeframe. First of all, using the yellow line, we can mark the downtrend line from which the price went up, while locally, we can mark the uptrend channel in which the price is currently holding with blue lines.
Now let's move on to marking the places of support. We will use the Fib Retracement tool to mark the support, and as you can see, we have the first support at $88.69, then we can mark the support zone from $86 to $84, however, when the price falls below this zone, we can see a drop around the support at $76.77.
Looking the other way, we can also mark the places where the price should encounter resistance on the way to increases. And here, the first resistance that LTC is fighting is at $90.09, the next resistance is at $96.98, and then the third resistance at $105.58.
The CHOP index indicates that the energy is slowly gaining strength. The MACD indicator indicates a local downtrend. On the other hand, on the RSI, after a slight rebound, we have room for growth, when the price breaks the current resistance, we can see an attack on the second resistance.

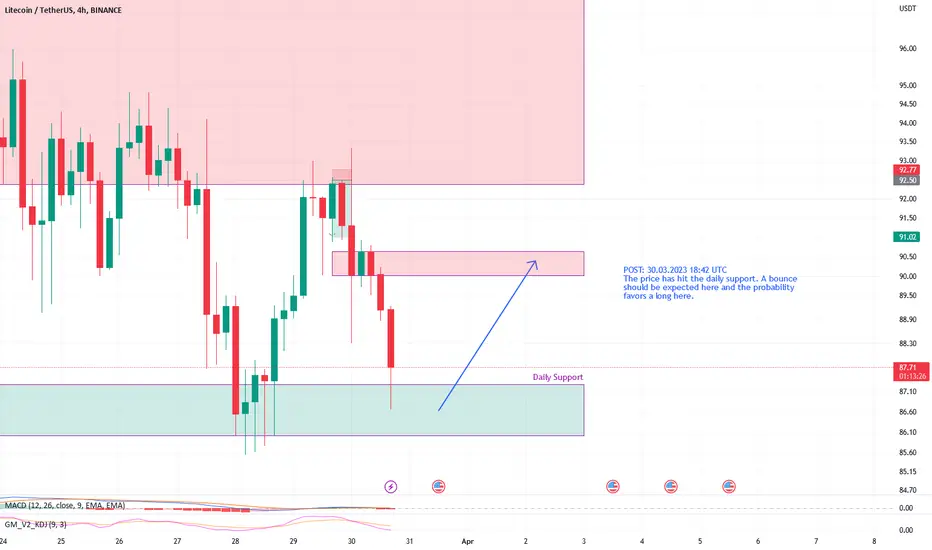
LTCUSDT at daily support, long favorableThe price has hit the daily support. A bounce should be expected here and the probability favors a long here.
Litecoin to breakdown?Litecoin - 24h expiry - We look to Sell a break of 84.98 (stop at 88.08)
Broken out of the triangle formation to the downside.
Trading has been mixed and volatile.
Daily momentum has stalled and our bias is now neutral.
A break of the recent low at 85.33 should result in a further move lower.
85.33 has been pivotal.
Our profit targets will be 77.48 and 76.48
Resistance: 90.00 / 93.00 / 94.50
Support: 89.00 / 87.50 / 85.30
Please be advised that the information presented on TradingView is provided to Vantage (‘Vantage Global Limited’, ‘we’) by a third-party provider (‘Signal Centre’). Please be reminded that you are solely responsible for the trading decisions on your account. There is a very high degree of risk involved in trading. Any information and/or content is intended entirely for research, educational and informational purposes only and does not constitute investment or consultation advice or investment strategy. The information is not tailored to the investment needs of any specific person and therefore does not involve a consideration of any of the investment objectives, financial situation or needs of any viewer that may receive it. Kindly also note that past performance is not a reliable indicator of future results. Actual results may differ materially from those anticipated in forward-looking or past performance statements. We assume no liability as to the accuracy or completeness of any of the information and/or content provided herein and the Company cannot be held responsible for any omission, mistake nor for any loss or damage including without limitation to any loss of profit which may arise from reliance on any information supplied by Signal Centre.

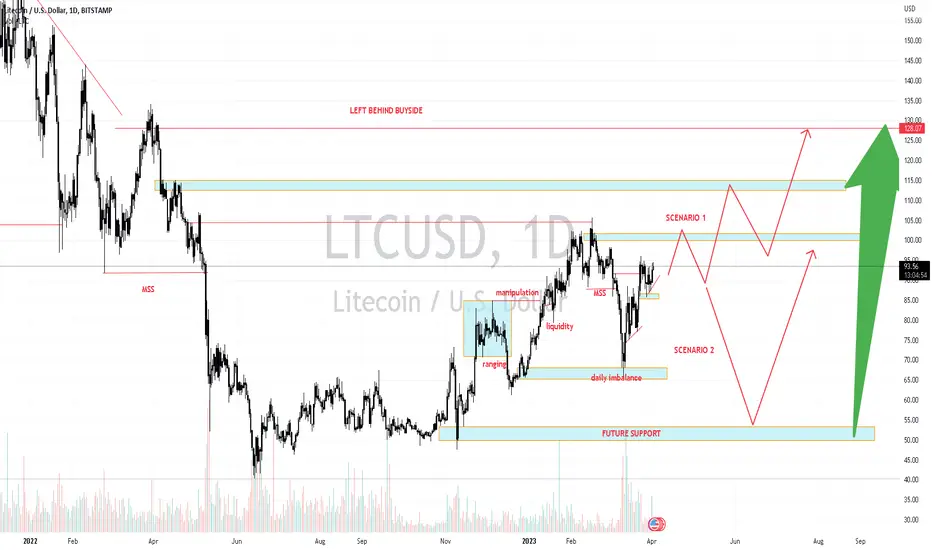
Litecoin Long Term AnalysisLitecoin breaking the moving average in the monthly timeframe indicates a bull market. $130 is seen as the target first, but higher levels can be seen if this is broken.