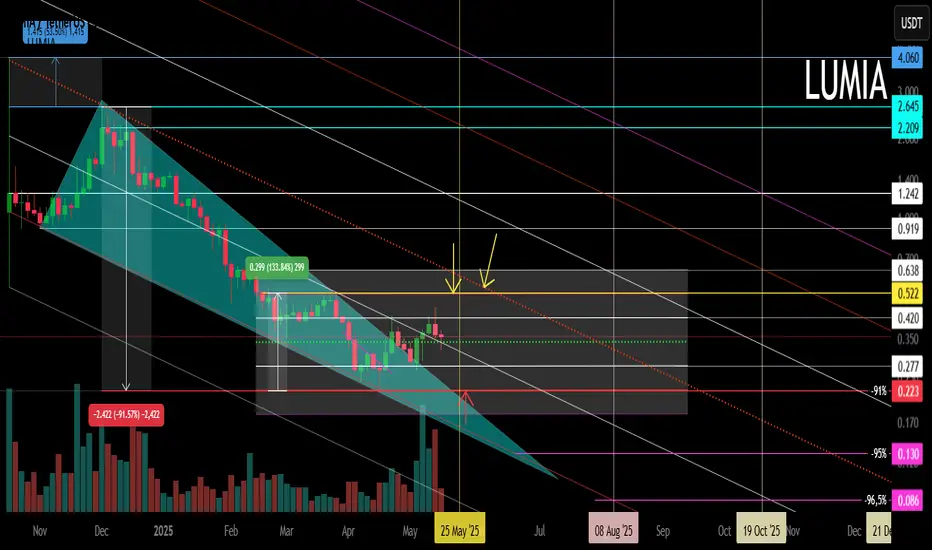
LUMIA Main trend -91% Low/high zones 01/18/2025Logarithm. Time frame 3 days. Fresh cryptocurrency. This main trend of this cryptocurrency itself (the entire history of trades) acts as a secondary trend in meaning.
The legend of the utility-imitation of this cryptocurrency is the tokenization of assets. A very good idea for the future hype of this kind, especially if they will continue to hype the "American" HBAR.
The chart shows the zones (support/resistance horizontal and dynamic) of maximums and minimums for work.
Now, after breaking the logic of the descending wedge (all the price drop), the price went into sideways consolidation. The channel step and local levels are shown. If they draw an inverted head and shoulders with the price in the channel canvas (part is already there), then there will be an exit to % of its base up, just to one of the following designated resistance zones. If the market as a whole is negative, then from this consolidation there may be another wave of decline. The zones are shown in the idea.
The asset itself was dumped after a local listing pump by -91%, these are not the minimum values for assets of such liquidity. But, sometimes if the market as a whole looks bullish, then the trend of the wrapper is reversed, this is an acceptable decline, but not minimal. Consider this in your money management and work tactics.
LUMIAUSD
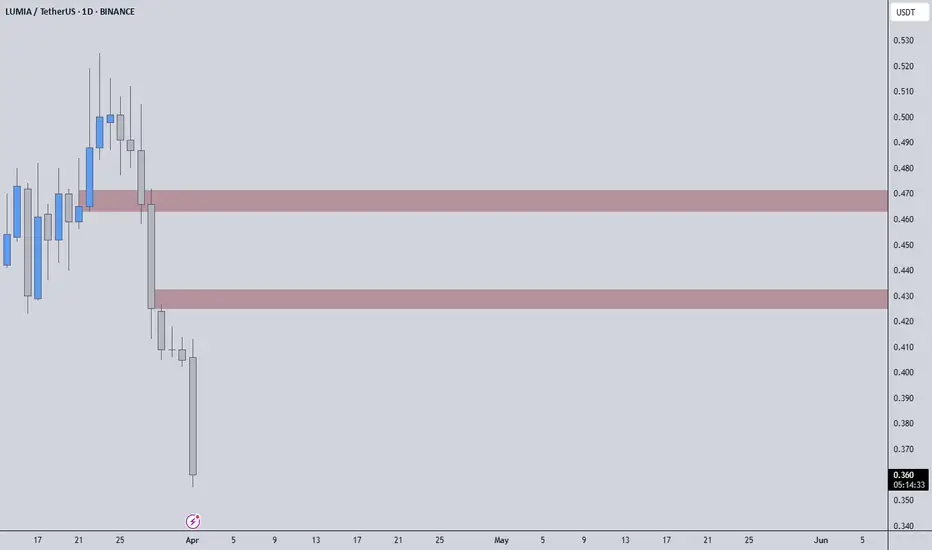
LUMIAUSDT – Highest Volume Gainer, but Bearish Setup?LUMIAUSDT is showing clear bearish momentum, and I won't be considering longs unless the key red resistance zones are reclaimed. Until that happens, the path of least resistance remains to the downside.
🔎 What’s the Smart Move?
Right now, short opportunities are present, especially if we see low-timeframe breakouts to the downside. The key is waiting for confirmation—I don’t insist on a short idea if market structure flips bullish, but as long as volume supports this decline, I see no reason to fight it.
📌 Key Takeaways:
✅ Red boxes must be regained before I consider bullish scenarios.
✅ Shorting from here makes sense, as long as we get clear LTF breakdowns.
✅ Professional precision is key—this is not a game of guessing but a strategy backed by high-probability setups.
🔹 My high success rate speaks for itself, those who follow my insights know the edge I provide. Stay sharp, and don’t chase weak moves.
📌I keep my charts clean and simple because I believe clarity leads to better decisions.
📌My approach is built on years of experience and a solid track record. I don’t claim to know it all but I’m confident in my ability to spot high-probability setups.
📌If you would like to learn how to use the heatmap, cumulative volume delta and volume footprint techniques that I use below to determine very accurate demand regions, you can send me a private message. I help anyone who wants it completely free of charge.
🔑I have a long list of my proven technique below:
🎯 ZENUSDT.P: Patience & Profitability | %230 Reaction from the Sniper Entry
🐶 DOGEUSDT.P: Next Move
🎨 RENDERUSDT.P: Opportunity of the Month
💎 ETHUSDT.P: Where to Retrace
🟢 BNBUSDT.P: Potential Surge
📊 BTC Dominance: Reaction Zone
🌊 WAVESUSDT.P: Demand Zone Potential
🟣 UNIUSDT.P: Long-Term Trade
🔵 XRPUSDT.P: Entry Zones
🔗 LINKUSDT.P: Follow The River
📈 BTCUSDT.P: Two Key Demand Zones
🟩 POLUSDT: Bullish Momentum
🌟 PENDLEUSDT.P: Where Opportunity Meets Precision
🔥 BTCUSDT.P: Liquidation of Highly Leveraged Longs
🌊 SOLUSDT.P: SOL's Dip - Your Opportunity
🐸 1000PEPEUSDT.P: Prime Bounce Zone Unlocked
🚀 ETHUSDT.P: Set to Explode - Don't Miss This Game Changer
🤖 IQUSDT: Smart Plan
⚡️ PONDUSDT: A Trade Not Taken Is Better Than a Losing One
💼 STMXUSDT: 2 Buying Areas
🐢 TURBOUSDT: Buy Zones and Buyer Presence
🌍 ICPUSDT.P: Massive Upside Potential | Check the Trade Update For Seeing Results
🟠 IDEXUSDT: Spot Buy Area | %26 Profit if You Trade with MSB
📌 USUALUSDT: Buyers Are Active + %70 Profit in Total
🌟 FORTHUSDT: Sniper Entry +%26 Reaction
🐳 QKCUSDT: Sniper Entry +%57 Reaction
📊 BTC.D: Retest of Key Area Highly Likely
📊 XNOUSDT %80 Reaction with a Simple Blue Box!
📊 BELUSDT Amazing %120 Reaction!
I stopped adding to the list because it's kinda tiring to add 5-10 charts in every move but you can check my profile and see that it goes on..
LUMIA Buy/Long Setup (2H)A bullish iCH has formed on the lower timeframes, and there is a liquidity pool above the chart.
The main supply zone is marked on the chart.
We are looking for buy/long positions from the demand zone.
Touching the invalidation level will invalidate this analysis.
Do not enter the position without capital management and stop setting
Comment if you have any questions
thank you
