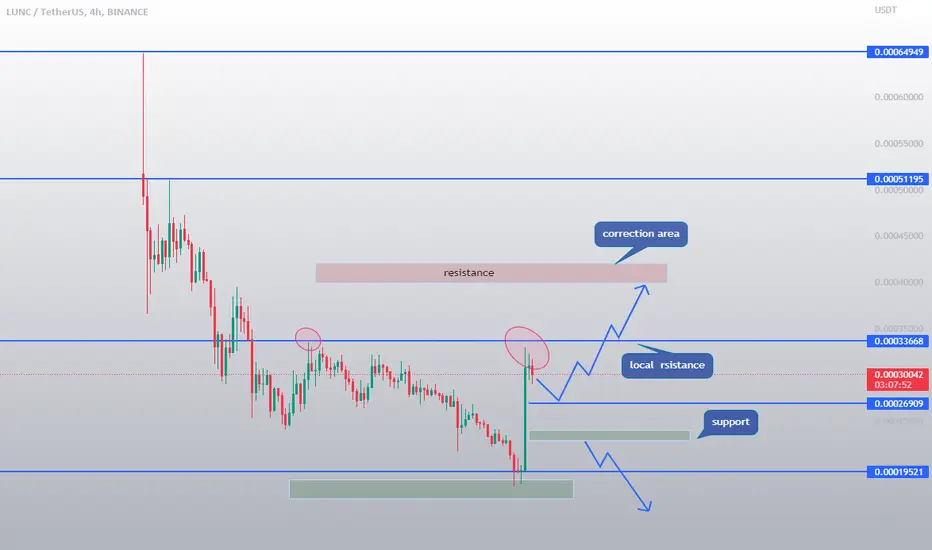
luncusdt 4h updatelunc token currently cannot brok his its resistance but i am expecting soon its broke now its local resistance.
but at this buying of this token is not so good its dengerouse so waite for confirmation its support or resistancce area.
if it broke its local resistance then possible we see another pump under lunc token.
LUNCUSDT

TERROR LUNA CLASSIC In Freefall Down to .00013 Wicks to .000088LUNA classic has been in free-fall since reaching its high. It broken through all major support and the downtrend continues. There is a drive of hidden bullish divergence on the hourly so a bounce today and tomorrow up to .00026-.000275 is possible and likely before being rejected at resistance again and continuing its downward journey. There is no real support after .0002, so once .0002 breaks and we get into the .0001's then the panic selling will occur and we will drop fast down to the next major support around .000144. I don't think .000144 will hold for long before LUNA slams down to really strong support around .00011. A stray wick could push down to as far as .000095-.000089.
This is not trading or financial advice this is just my opinions and speculations based on TA and FA of my own.
MACD ON THE DAILY : STRAIGHT DOWN
RSI ON THE DAILY : STRAIGHT DOWN

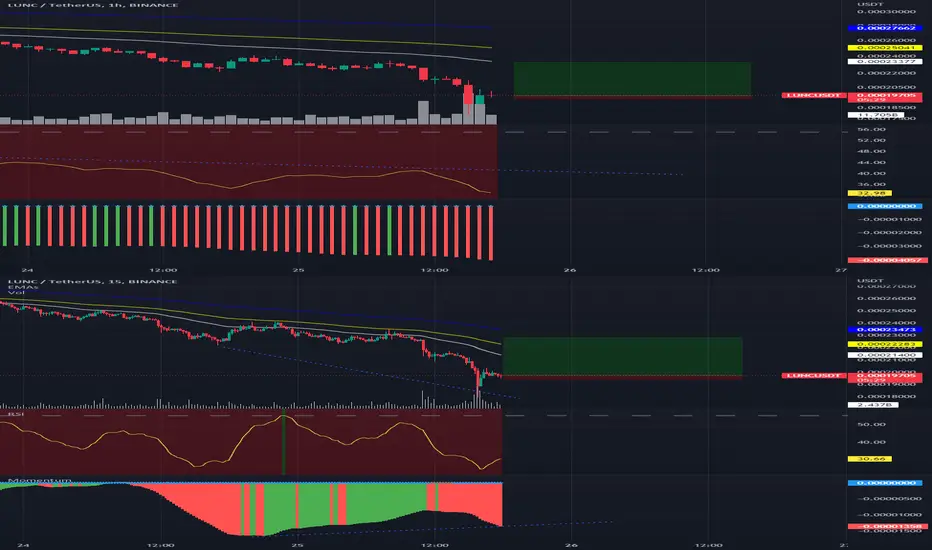
Quick Long LUNCUSDT 10:1 RRQuick Long LUNCUSDT 10:1 RR to EMA 200 on 15 minutes timeframe , divergence on Momentum LB and high volume spike
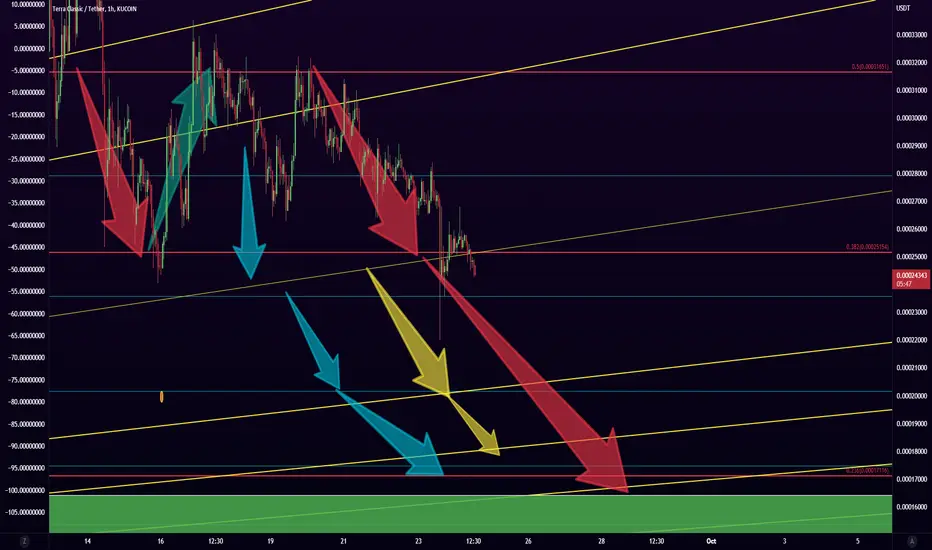
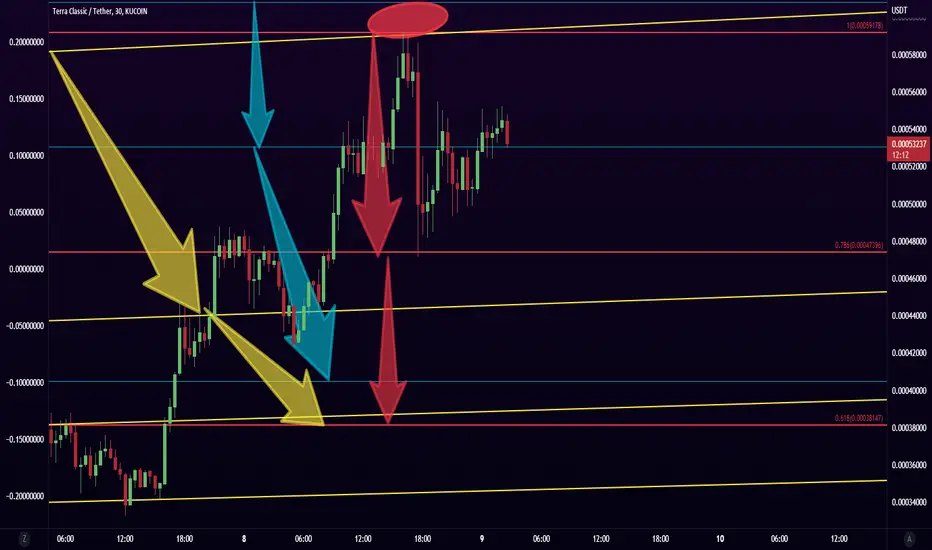
luncusdt updatehey traders
Lets take a look at luuna classic with math
Red lvls belongs to the sellers
Green lvls blongs to the buyers
And yellow line is my dynamic lvl for trend confirmations
What you. Think,share ur chart and leave a comment
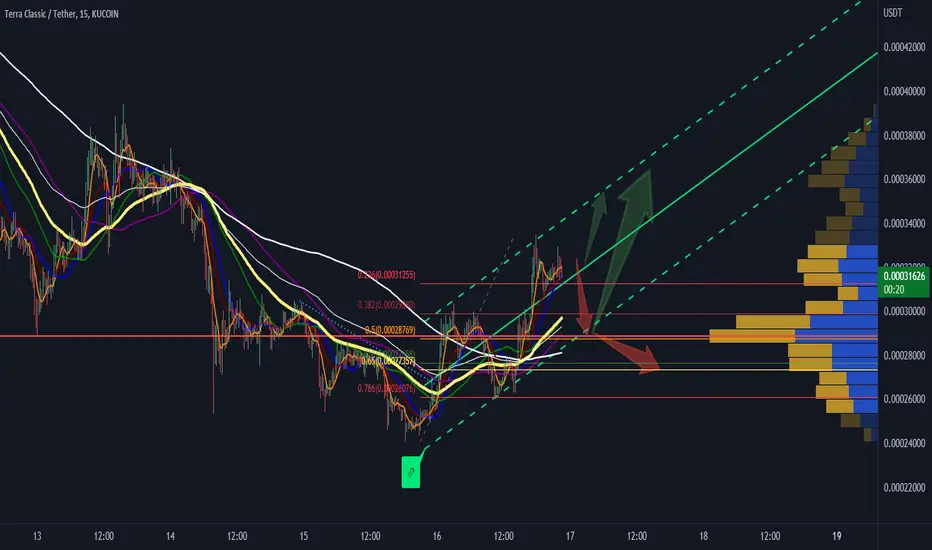
LUNCUSDThey traders
If u look at LUNC with math, u will see this
all if them telling me were going touch golden ratio at 0.00038
share ur chart and leave a comment
Lunc will go the moon (2000%+)Everything we saw was a script, Binance has 40% lunc, and cz will support off-burn later.
Everything is for hype. Who has more Lunc, and who has the motivation to increase the price of lunc.
When the party will start ? Maybe tomorrow or later, when most people donot believe lunc.
When the party will end ? When most cex support Lunc burn off-chain ( maybe 3 or 4 weeks later).
Lunc price will touch $0.006+(2000%+).
Hold is never easy, Good luck.
LUNC ON SUPPORT. WILL WE SEE A REVERSAL?Check out the trade plan for LUNC today based on the technical analysis. Hope this analysis is useful, make sure to hit the thumbs and also follow my tradingview profile for future updates. Thank you!
LUNC on important support where we should keep an eye on this level to identify if the price is looking for a bullish reversal or a bearish breakout. I am expecting a decent pullback to happen in this area as we have seen some buying interest formed in previous price action.
I have pinned some important levels where we can keep our take-profit limits on a bullish reversal in the short-term base. We have seen a nice correction so far with my previous analysis as mentioned with the 5 wave theory.

Terra Classic LUNC Bearish Sentiment Friday the S&P reached its 52 week low, $3636. There is a strong correlation between the S&P and the crypto world. Many stock investors diversified their portfolio into cryptos, especially in BTC Bitcoin and ETH Ethereum .
With a bearish stock market in the worst month for stocks and cryptos, i expect most of the cryptocurrencies to trade lower this week.
LUNC/USDT short
Entry Range: $0.0002300 - 0.0002500
Take Profit 1: $0.0001700
Take Profit 2: $0.0001330
Take Profit 3: $0.0001120
Stop Loss: $0.0002820
previews short signal

LUNC 30 min bullish dragonWe have a possible bullish dragon for LUNC on the 30 minutes chart at the bottom of a range. We got the head, body, spine, and two legs. Let's hope this breaks out

It is ready to grow with strong community supportWhat can be seen in the chart:
Decrease in transaction volume
The position of the Williams %R oscillator is in the minimum position( daily time frame)
The effect of token burning news is reduced
Therefore, with the new news about token burning, it is quite susceptible to significant growth

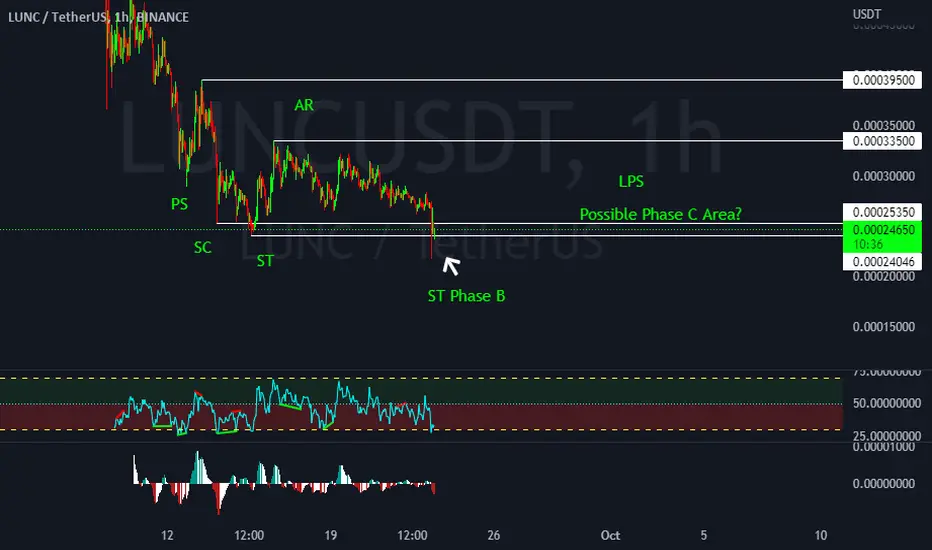
Readjusted Possible Wyckoff Accumulation range on LUNCTracking this possible range of accumulation a bit early but it looks like we've hit a secondary test (ST) in phase B and possibly going into phase C with the last point of supply ( LPS ) being accumulated by holders and market makers. It goes with the narrative that everyone just jumping onboard with staking and becoming a validator node for the network.
Lunc
#lunc/USDT
Exchanges: Binance
Signal Type: Regular (Long)
Amount: 2.0%
💎 Entry Targets:
1) 25660- 22848
Take-Profit Targets:
Target 1: 28988
Target 2: 36688
Target 3: 48143
Target 4: 52606
Target 5:
Target 6:
Target 7:
Target 8:
🚫 Stop loss:
21200

Possible Wyckoff Accumulation range on LUNCTracking this possible range of accumulation a bit early but it looks like we've hit a secondary test (ST) in phase B and possibly going into phase C with the last point of supply (LPS) being accumulated by holders and market makers. It goes with the narrative that everyone just jumping onboard with staking and becoming a validator node for the network.

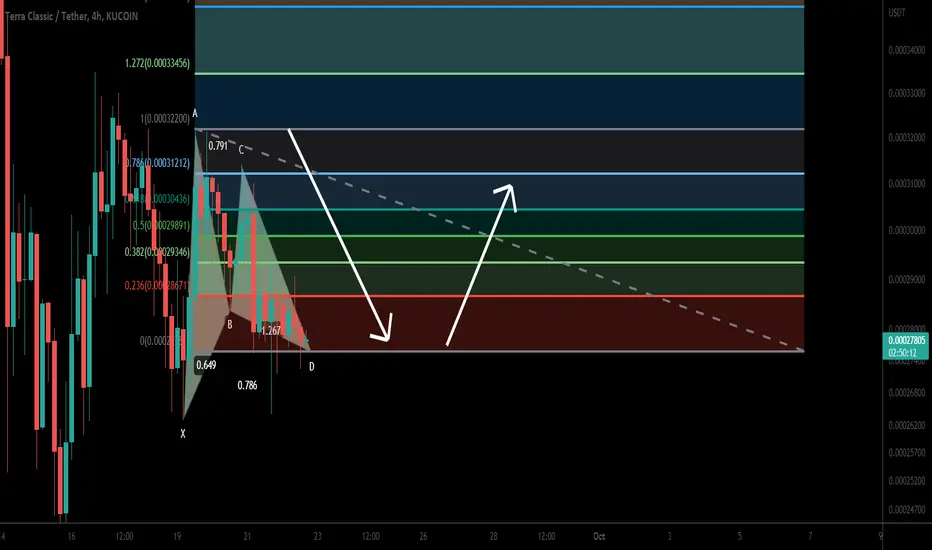
Terra Classic (LUNC) formed bullish Gartley for upto 18.50% moveHi dear friends, hope you are well, and welcome to the new update on Terra Classic (LUNC) with US Dollar pair.
Previously LUNC reversed bullish without completing the final leg:
This time on a 4-hr time frame, LUNC has completed a bullish Gartley pattern.
Note: Above idea is for educational purpose only. It is advised to diversify and strictly follow the stop loss, and don't get stuck with trade
CRYPTO MARKET UPDATE!! CRYPTO COOLS OFF!Hi Snipers,
Please refer to the recording for the next price levels and scenarios.
Thanks
MS

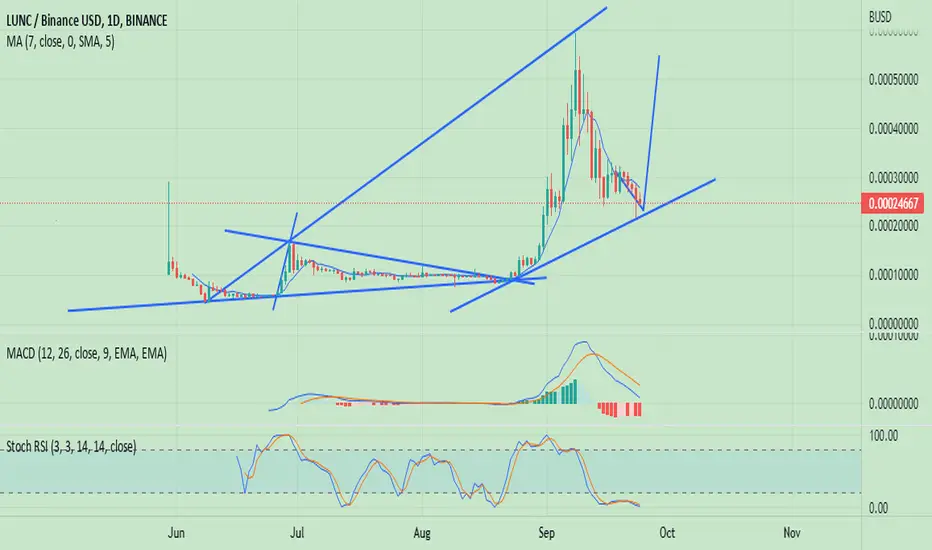
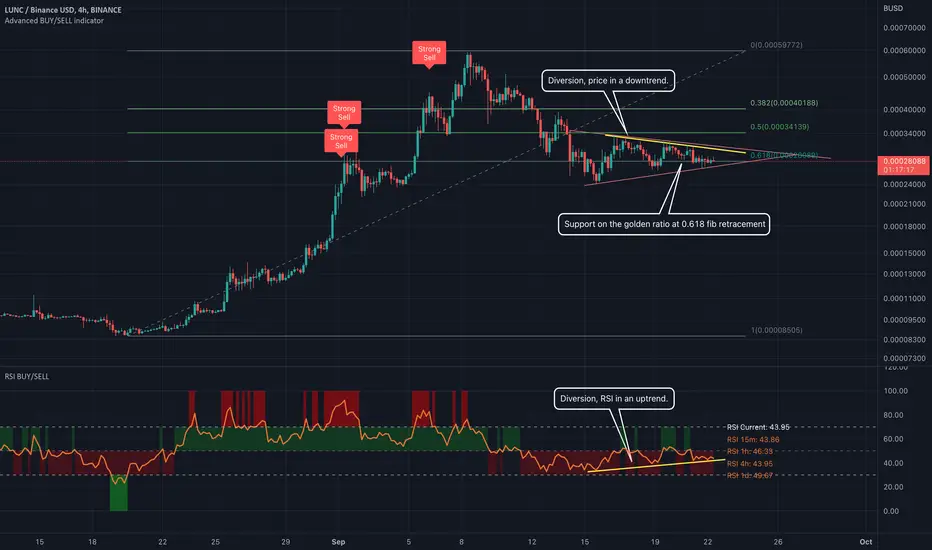
LUNC 4h diversion on RSI versus PriceLUNC drops more than 50% from the big parabolic move it made over the last few weeks.
1) When we use the Fib Retracement tool we can see that LUNC sits on the 0.618 golden ratio which is a perfect trace back from this parabolic swing.
2) When we look at the 4h LUNC-BUSD chart we can see that LUNC sits in a symmetrical triangle which most of the time breaks out to the top.
3) We also see on the 4h candles a diversion on the RSI versus Price. RSI goes up, price goes down which indicates that the price will go up.
4) Not visible on this chart but LUNC finds almost support on the 4h 200 moving average. Also a positive indication.
Now that the 1.2% burn tax is in place we see some low burning values. A lot of people expected more of it and started to selling their LUNC.
As long Binance did not published an announcement if they will support or not support the 1.2% tax burn on their spot and leverage trading I will hold my LUNC.
Be aware, when the announcement is negative we could see a big dump. When the announcement is positive all other CEX will follow and we will see a big pump.
Personally I will hold, but I have some stop losses in place in case of the negative outcome.
!!! Don't forget to get profit in time or set alerts/stop losses.
You can always buy it back when it is tracing back up. The chart will not go up in one straight line.
Cheers and have fun.
° Be Patient – Don’t panic – Trade Emotionless.
° Never lose a winning trade. You can always get back in later.
LUNC Major Triangle FormingLUNC has been consolidating over several days, seemingly forming this longer-term triangle (purple). Would love to see price retest the triangle support and bounce up, and if so, would confirm the triangle for me, with a deadline of several days and a large price movement in either a bullish or bearish direction.


1.2% Tax Burn is Livewhat i See is Whales Manipulation. we will see the rise once whales sweep the stoplost #DYOR #NFA

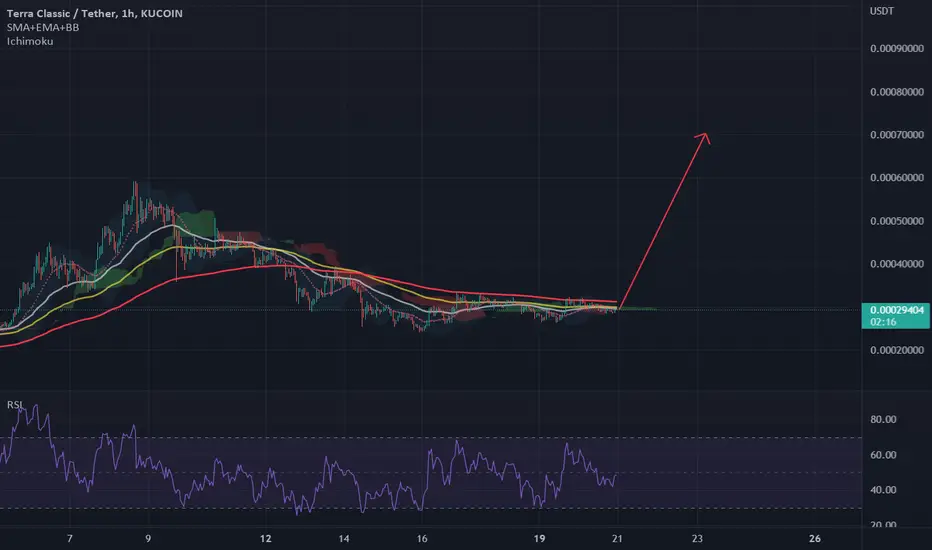
#LUNC/USDTLUNC Buy Time . nothing can stop it . TA : SMA 200 1h break out soon . FA : on chain soon .
Inverse head and shoulders with breakout confirmation LUNCUSDInverse head and shoulders with breakout confirmation also known as break hook and go LUNCUSD. Just in time for the 1.2% burn tax

Lunatics 15m analyze Seeing a potential short term play for LUNC.
Posted two paths I could see playing out today.
Let me know your thoughts!