AMGEN who knows what they do, but it has to do with moneyInteresting compare to the crash off in money supply velocity to Amgen’s delayed bull run
Maybe something to do with their business model.
Also compares to money supply and seems to correlate with increase in money supply dollars finding their new homes as we can see as the money supply velocity drops off drastically.
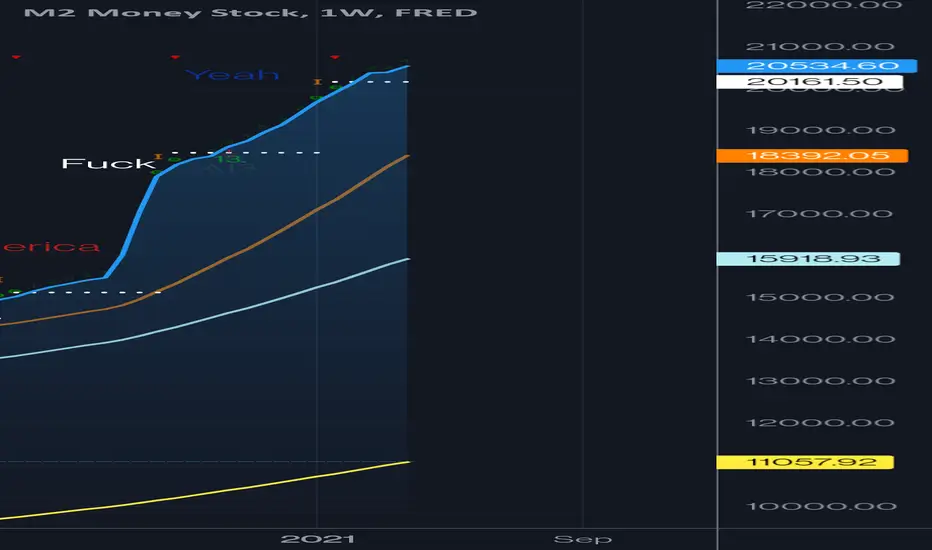
M2

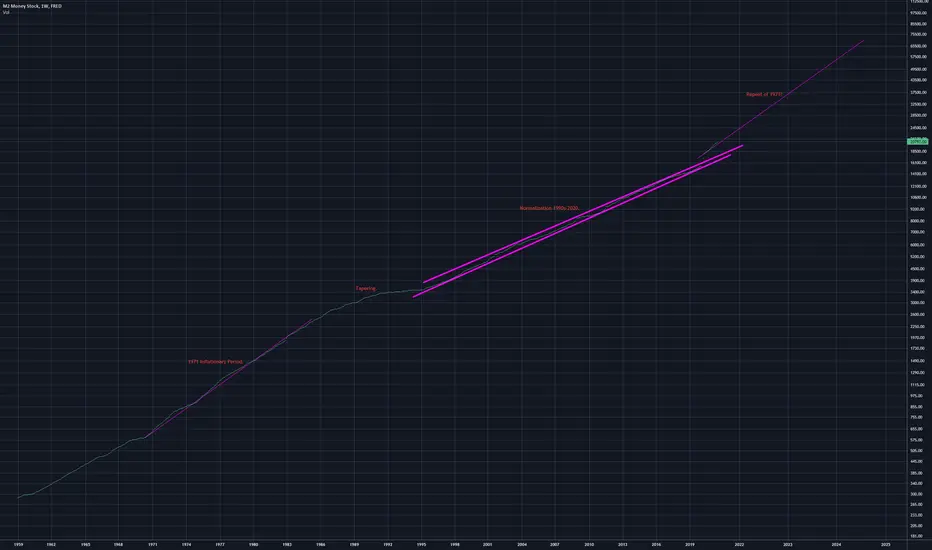
Growth Cycle Analysis of USD Supply.This is not entirely about a trade, moreso a thought experiment of the future to come.
After the great 2020 coof liquidity crisis a brief and severe expansion of the monetary supply occurred in order to bail out the entire economy. This seems to be followed by an equivalent expansion rate mirrored by the 1971 expansion. The marked difference this time is that the interest rate is 0. To reign this in would require negative rates, or capital controls, AND a major collapse (which I do not think will be permitted).
VVIX - 105s - * VERY Important for 30 Calendar Days to 11/21/21The VVIX was cornered to the 105s, as soon as this Level was violated the
100 Level.
Gaps were filled on the VIX M1 October as we began to Settle November.
This left a lower Gap for the settled Front Month / M1 - November.
The HIgh Low Close - 16.10 / 14.70 / 15.35 for October Settelement.
The HIgh Low Close - 19.70 / 19.30 / 19.325 for November Settlement.
This occurred October 19th - Wednesday.
Spread on Close = 400 Ticks - this is the present Gap Fill for the M1 / November VIX.
It is quite large...
and the ALGOs will fully lever this spread into November... which means the
potential for Higher Equities Complex.
They have set this up perfectly.
Be aware - Higher Prices can exceed the ATH's, it is not only Possible but Probable
given the Roll Yields.
Weekly Indicators remain Bearish, but this is subject to change.
______________________________________________________________________
Patience into Settle was suggested, as we now know the Game.

M2 VelocityThe squeeze is on, as M@V declines, there will be a Point of Recognition
when the average consumer sees Food Prices as a RISK.
At that time in the not too distant future, they will begin to spend and hoard
forward.
We are approaching the point at which on a percentage basis - this has occurred
Historically speaking.
The panic Point throughout History has been 35% per annum.
We are getting close as most food princes have risen in excess of 22% in 2021.
A great many items, significantly more.
Commodity Prices for basic materials as well, see Cotton.
Scarcity eventually gives way to Panic.

VIX - Roll Yield ImportanceImportant Note, the Roll Yield is important for the VXX.
I have heard countless YouTube and Forum Gurus dismiss
the VXX as a Junk Derivative. A Scam...
Nothing is further from the Truth.
That statement demonstrates how there are far too many
"Gurus" with no understanding of Volatility itself.
The VXX is comprised of the 30 day Short Term Rolling Maturity
outline in the prior 2 Posts.
We simply laid the groundwork for how this all comes together
to show how "balance" is achieved for the VXX Instrument....
it is constantly moving from M1 to M2 the Day it Settles.
Hopefully, this was clear enough for those unfamiliar with how
Volatility works in the Futures Markets and how it impacts
ALL Markets.
The Methodology is known, it is based upon VIX Futures in relation
to the Spot VIX >>> SPOT VIX & M1 @ Settle "Converge" then to become
equal in Price @ PAR.
Roll Yield is how the VXX Derives its Price.
VXX is not a STOCK, it is an Index based upon M1/M2.
It simply is a Wash Rinse Repeat cycle Index for M1 / M2 in Constant Maturity.
I received a message asking me to explain this, Hopefully, it is clear now.

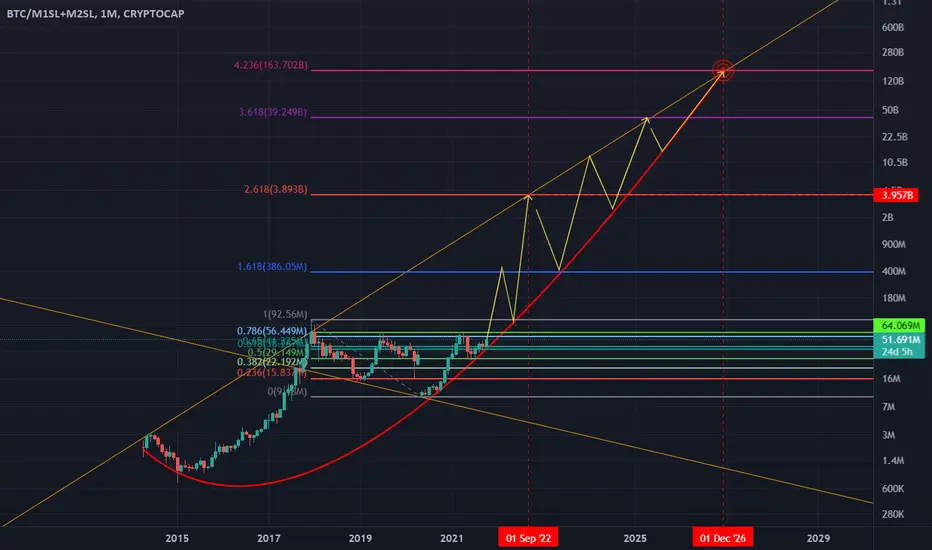
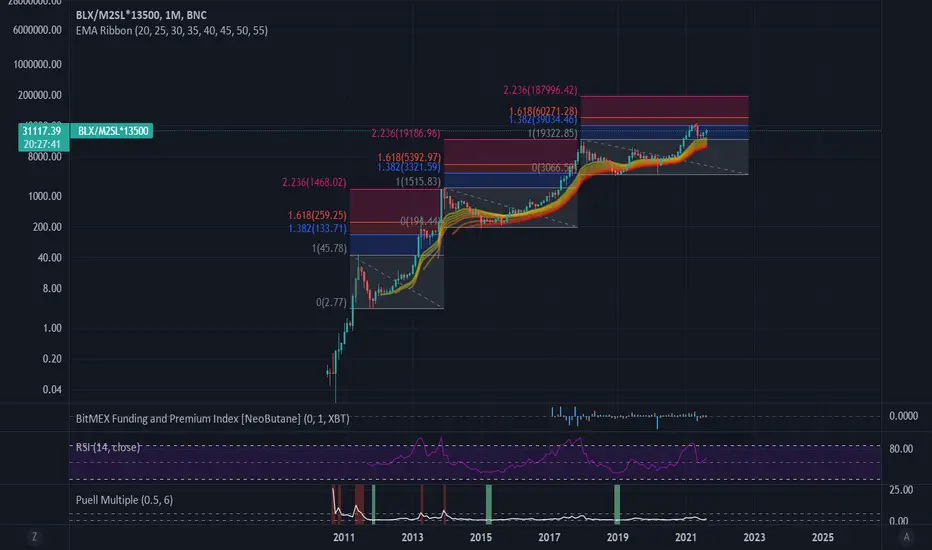
This is what hyperinflation looks likeBTC / M1SL+M2SL
Bitcoin price to ~164 million dollars per coin after the next cycle. As high as ~4 million this cycle.
Ask me how crazy I am.
Yes.
Divergence Between Bitcoin and Bitcoin priced against M2Just a Theory that bitcoin price should push higher depending on how fast M2 increases. I'm thinking bitcoin goes 54% higher than it normally would have give or take a couple percentage points. And that percentage isn't even set in stone, the number could be lower or way higher by the end of the market cycle. I'm thinking the top could be anywhere in between 200-350k for bitcoin.

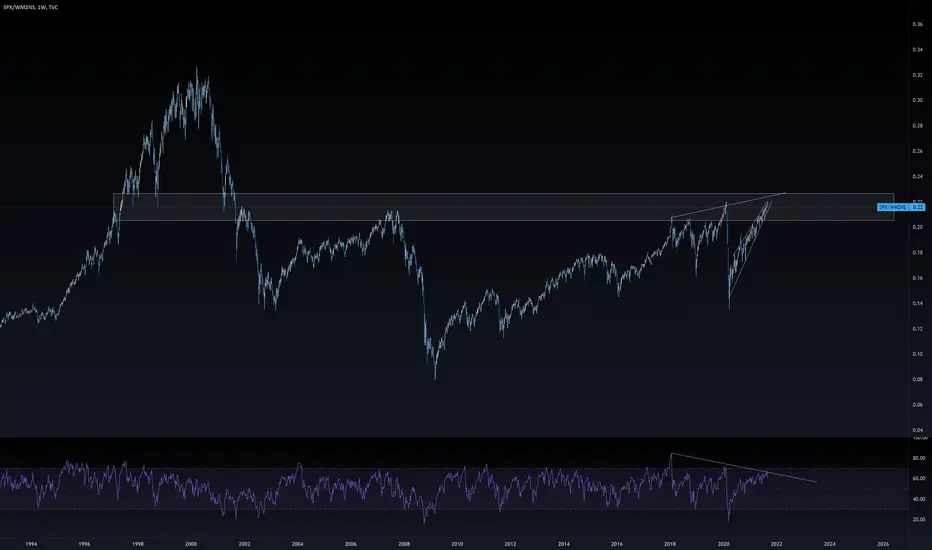
SPX Divided by M2 Money SupplyDouble top & trend break.
Removing the effect of M2 is a way to view the market without the manipulation of extreme money printing.

The market is talking. Can YOU hear it?Pareto's law says that roughly the top 20% of the market constituents should roughly represent 80% roughly of the overall market cap, and vice versa: the bottom 80% of constituents will represent 20% of the overall market cap.
When price seems irrational, and higher cap stocks start to represent more of the market than previous decades, and thus are given a higher weight in the major indices, it can be very useful to look at a large portion of the bottom 80% to get a more rational prospect of market value.
Russell 2000 represents many small and mid cap stocks, which are mostly given low weights in large portfolios and indices, compared to larger cap stocks such as TSLA or the FAANG stocks.
We get an interesting peek at the overall market value if we look at these companies in the median of the market, in addition to accounting for money supply expansion.
We can see that if we account for inflation, the relativity of the money supply in relation to the Russell 2000 has always topped out at about where it is now, in the past 20 years.
The price seems to be disconnected from value at the moment, off by a factor of 2 or 3. For the larger caps that are not included in this index, this overpriced factor is probably larger, maybe 5 or 10, given the current conditions of an irrationally large-cap dominated market.
Let me know what you think.
Do you think the dip of 1200 in 2020 was a valid retest?
Or was it just forced participation, coercion by the FED?
Do you think that, given such coercion, we're in for a further lower retest when said coercion becomes less effective?
Cheers

SPX Divided by Money Supply SPX back in the resistance / distribution zone for the SPX over money supply on a bearish divergence. September / October will be interesting
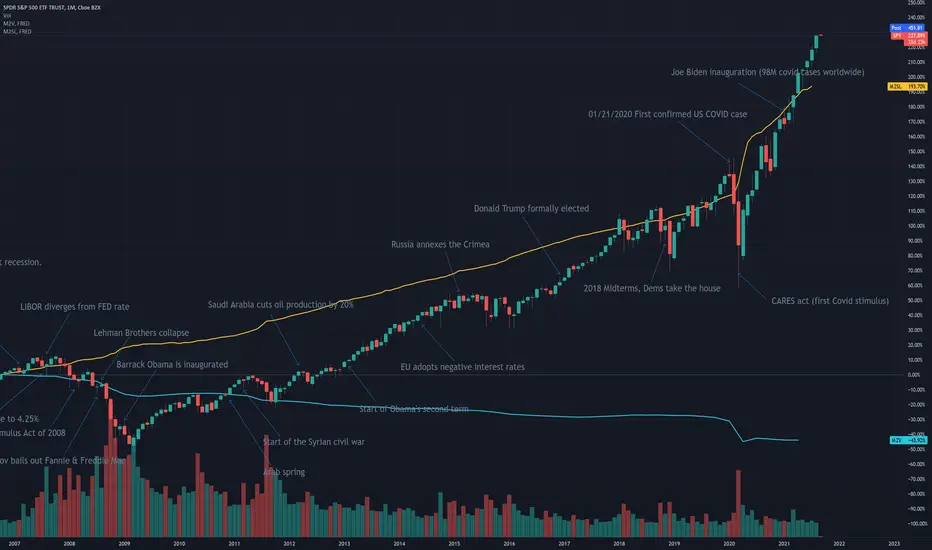
SPY vs Money Supply 2000-2021Pivotal events of the last two decades compared with the S&P and the money supply. M2 is a broad indicator that includes cash, checkings, and liquid assets such as money market securities and cash equivalents. Although M2 exploded 42% during the COVID pandemic, much of this money is locked up in FED REPO agreements and artificially inflated on the Fed balance sheet as indicated by the velocity. Velocity is an indicator of the speed at which a unit of currency is exchanged in the broader economy.
Bitcoin should be charted against M2If the m2 money supply increased by 40% within 1 year, wouldn't make sense that the bitcoin price would be 40% higher than it normally would be. This chart shows a macro price target of around 188k priced against m2, which would give a normally priced bitcoin target around 250k.
SPX SPY ES - Throw Over - SPX/M2 Money Stock For HK, this is the most important Chart we follow and obey.
The larger TF here - Daily - perfectly illustrates how Price moves
along a trend range... Until it snaps and collapses quickly.
This is precisely what we believe will occur in the next few weeks
or perhaps sooner.
We will see a sharp reversal with 2 distinct thrusts down as primaries.
Time is running out for the Buy Side.
What took months to build will be taken out quickly.

S&P 500 / M2SL testing ATH.M2SL growth was approximately linear before the COVID dump last year. Money printing has increased since and thus it makes sense to divide the market by this increase in money production to view approximately how the market would be performing pre-COVID.
We can see that by doing so, the S&P 500 is about to retest the ATH from before the COVID dump. A rejection from this level could be disastrous for the markets.

How Central Banks Are Stealing Your MoneySince the merger between the Fed and the Treasury (kidding, kind of), I've had so many conversations with individuals outside of the financial industry who struggle to fully grasp how central banks are stealing their money. Today, I'm going to share a short and simple post which I hope will help explain the direct effect of "money printing," on the working class. Let's jump right into it.
When interest rates remain low for an extended period of time (historically), risk assets become more prone to rampant speculation (lucky for those holding assets outside of cash), leading to massive distortions in the underlying fundamentals of those assets, and historical valuation deviations from the mean (which is mathematically unsustainable). The rapidily rising prices of both assets, and goods & services, which is not being stimulated by an actual increase in the velocity of money, but rather from central banks artificially flooding the monetary system with liquidity (while interest rates are near zero), contributes to a lower standard of living for those holding cash as their primary asset.
For example:
If you have $100 in your bank account, and perhaps this is your only asset, then the central bank increases the money supply by 25%, what they've just done is increase the denominator which underpins the value of that $100.
Here's a simple logical demonstration:
100/100 = 1 (baseline purchasing power.)
100/125 = 0.80 (a 25% increase in the money supply in this example, as a result of central bank money printing, results in a 20% loss in purchasing power.)
In essence, in this hypothetical situation, you've just lost 20% of your purchasing power. With CPI in the US running at 5.4% YoY vs the Fed's 2% "target," we're currently looking at an inflation rate almost triple the Fed's goal. The US10Y yield trades at 1.25% while CPI is 5.4%, and the Fed continues to print $1.44 Trillion on an annualized basis, with no end in sight. Welcome to the wonderfully horrific world of Modern Monetary Theory (MMT). Anyone looking for a hedge?

Probably Nothing...Looks like the bond market knows something stocks don't (again). Same divergence here that we saw running up to the March 2020 crash. We're looking at SPY/M2 compared to the US10Y yield (in white). The last time the 10Y yield was in free fall, stocks continued to climb, ignoring the signal, only to crash a couple months after the divernegce began. Let's see what happens this time...

Time to have some downside protection?While I wouldn't short the S&P500, I nonetheless would be cautious if I invested in this index, as it has rarely been that expensive, once adjusted for monetary growth. The time might have come to focus on undervalued sectors (such as commodity producers) or countries (like Russia or Singapore), rather than investing passively.
Shorter-term investors might also consider long-short strategies or simple hedging, in order to reduce the downside risk.

QQQ/M2 Long Term ResistanceNext week is critical to see if we break out of this long term channel. The last several times we have reached this resistance, the reaction has been muted, but the momentum structure in particular is nost most similar to February of 2020 which warrants paying closer attention.

Liquidity - Macro PerspectivveIn additional to Wells Fargo - more than one dozen additional Banks have
reduced Lines of Credit (LOCs) - the prior contraction in Personal Credit
occurred two weeks before the previous Retracement South.
We anticipate the Net Effect will be Negative with an abrupt reduction in
M2 into the end of August.

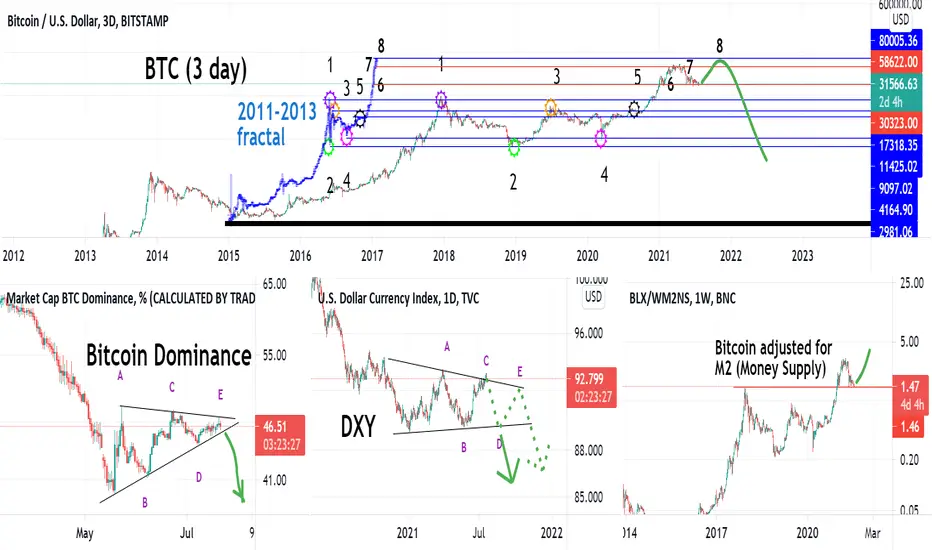
BTC - BTC.D, DXY, M2, 2013 fractalI created this combo chart to get more overall view on how BTC is ready to continue bull run to the market top.
1) 2013 fractal had 50% dip (Nov 2013) just before the last leg up. Fractal matches this dip.
2) Bitcoin Dominance completing triangle. So now it should drop for the final BTC capitulation to altcoins.
BTC will rise in price as well.
3) Dollar Index peaked above trend line. I suspect fakeout. DXY drops, good for BTC.
4) Bitcoin adjusted for M2 money supply came back and tested the top. Classic pattern.

S&P500 Futures/M2: Breakout or Rejection?We're either seeing a breakout here on the S&P500 Futures/M2 chart, or this resistance level, which has held up since 2001, is about to spoil the bulls party. Look at the last impulse wave toward the resistance line in yellow. We're stretched, but we're seeing the same pattern, folks. Trade accordingly...
