just an ideafind it interesting, this is the sum of all commodities divided by the money supply.
probably doesn't mean anything, anyway interesting.
Looking at the parabolic route of m2 and the commodities basket divided by it didn't move as expected because of it's rally the rally. lot's of money still in the markets.
give me your perspective and ideas
M2

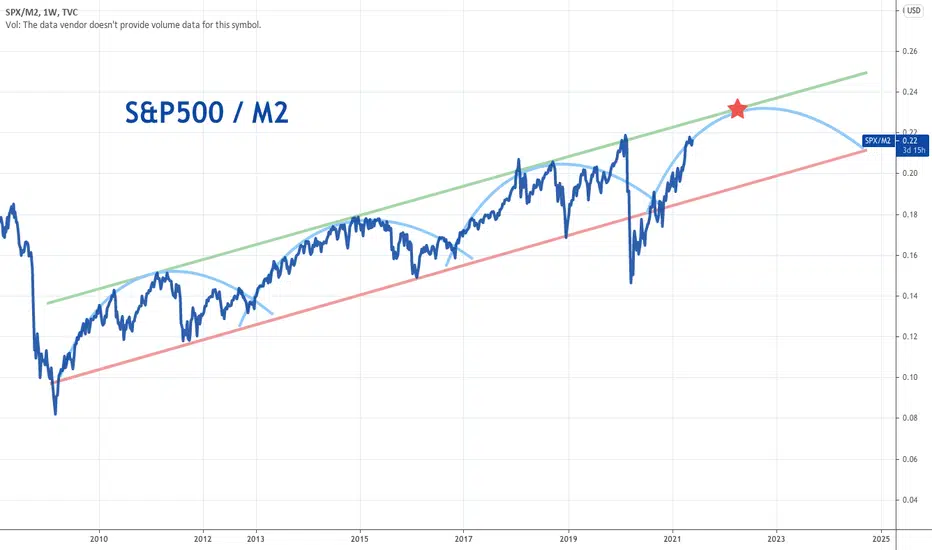
SPX/M2 Money Supply comparison is eye openingThis is a VERY long term outlook on the market. Shown is from pre-DotCom bubble. This is relationship of SPX to M2 money supply. There isn't a more straightforward relationship than this. People comparing the current market to the DotCom bubble are actually only halfway there in this respect. We might be disconnected from reality right now but in this figure its no where near turn of the century. So the question is if this is a exhausted breakup from the trend and it reverts or it keeps up the northern trend? Fed is continuing its QE and SPX keeps going up. How much longer can this go on?

S&P500/M2 Shows Major Resistance OverheadWe're at a major resistence level here on the S&P when M2 is taken in to consideration, going back to 2002. We're looking at S&P Futures divided by M2, and as you can see, this looks like the end of the road, folks. One thing is certain, whatever happens next for markets is going to be epic...

SPX at Critical Price LevelWe are close to historic Price Levels for the SPX/M2. If we break above this level, this will give the SPX much room to grow even further in relation to expanding M2 in the coming years.
Exciting to watch!

[UPDATE BTC] NOBODY IS TALKING ABOUT THIS BITCOIN CHART!!Let's focus on the BTC / M2 ratio.
We just hit a crazy support!!!
Ready to pump.

#Macro #economics how you need to #invest (imo)#Inflation is cool if you are close to the money printers.
I am directly attached to crypto money printers
(a form of mining)
by buying #HEX shares in the savings pool.
No need to #trade
(but you could with a small % of your stack)

S&P 500: The Big Picture IIDividing SPX by the money supply (M2) removes distortions caused by changes in the supply of money (dollars). (1) Now, suddenly the skyrocketing SPX surge following the Covid crater isn't so insane, in fact, it has yet to recover to pre-Covid levels! Dividing by M2 arguably gives a more realistic view of equities, revealing the % of money out there that people are willing to invest in equities. That's a meaningful measure of how much society values such investment.
By SPX/M2, the SPX has not overshot its post-Great Recession channel and further upward movement appears plausible within that time-tested channel. This is in contrast to the same big-picture analysis I last posted. (2) I'm not sure which is more plausible, but I'm a bit enchanted by /M2 and so am inclined to suspect this might be the better predictive model.
SPX/M2 also seems to clarify a four-year-wave cycle that corresponds conspicuously to US Presidential terms. In this model I propose a continuity of that pattern. All of course highly speculative, but with *apparent* plausibility.
(1) fred.stlouisfed.org
(2)
Silver to M2 Money Supply and the roadmap aheadLooking at the Silver to M2 Money Supply you can clearly see when the ratio bottomed and subsequently broke the preceding downtrend the silver price broke out and had significant booms.
If you take a calculated and measured move from silver's previously significant breakout and overlay to today's market you could conceivably see $60 silver by end 2023, and $200 silver by 2026.
What are your thoughts?

#gold vs #FED #M2 ... a wall of #dollars should Push #metals UPPLENTY of ROOM to the upside measure Money stock

A differnt perspective on the value of the randAccurately and reliably forecasting a currency is near impossible, however, its easy to have an opinion. The question is, what do you base your opinion on?
As a South African, I follow the rand closely, particularly against the US dollar and the pound. One can use a purchasing power parity (PPP) or real effective exchange rate (REER) chart to calculate a "fair value" through analyzing the numbers. But the rand has everything to do with sentiment and the global economy and very little to do with the South Africa economy.
I put this chart together to try and understand the rand from a global context.
Assumption: there is a high correlation between the price of gold in US dollars and the M2 money supply.
The chart shows the M2 money supply in orange compared to the price of gold in rand terms which is shown by the blue line. We can see that the two lines have significantly diverged from each other over the last 8 months. If we assume that the M2 line will only ever go up and can never revert down, then we can assume that the price of gold in rand terms must also go up over time, all else being equal.
It would therefore stand to reason that the price of gold in rand terms is in a cyclical low and may suggest an attractive entry point.
What about the correlation between the price of gold in rand terms vs the rand dollar exchange rate?
The green line shows the rand dollar exchange rate in comparison to the price of gold in rand terms. It's evident that there is a high correlation between the two however, the the divergence between the two particularly over the last 2 years, shows the real appreciation in the price of gold.
So where does that leave us?
The assumption that the price of gold in rand terms is correlated to that of the M2 money supply, suggests that the price of gold in rand terms needs to increase. The correlation between the price of gold in rand terms and the rand dollar exchange rate suggests that the rand needs to weaken or depreciate over time. Makes sense?
I therefore ask the question as to whether the denominator that one should also follow over time is actually the direction of the M2 money supply in relation to the rand?
This also backs into monetary policy in the largest economies and the US in particular.
It stands to reason that the rand is far to strong at these levels if the world continues to print money? Its not sustainable!
Thoughts?
Please like and follow for daily posts on various asset classes. Please also share your views on the trading ideas and whether or not you find them to be of any value to you as a trader.
Please note, this idea is shared for educational and discussion purposes only and should not result in speculative investment decisions in any asset class.

SP500 vs M2 money supplyIt seems like the stock market in the long run is just a proxy for the M2 money supply.
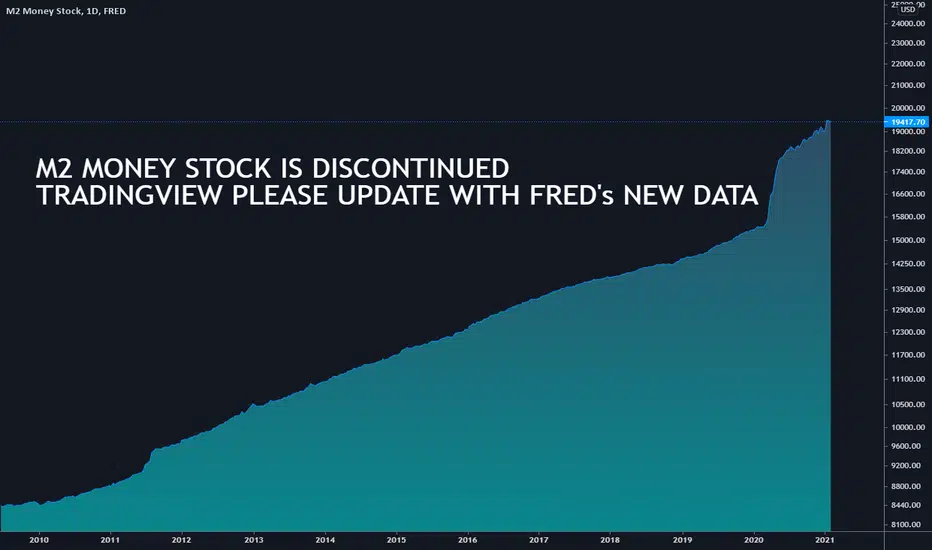
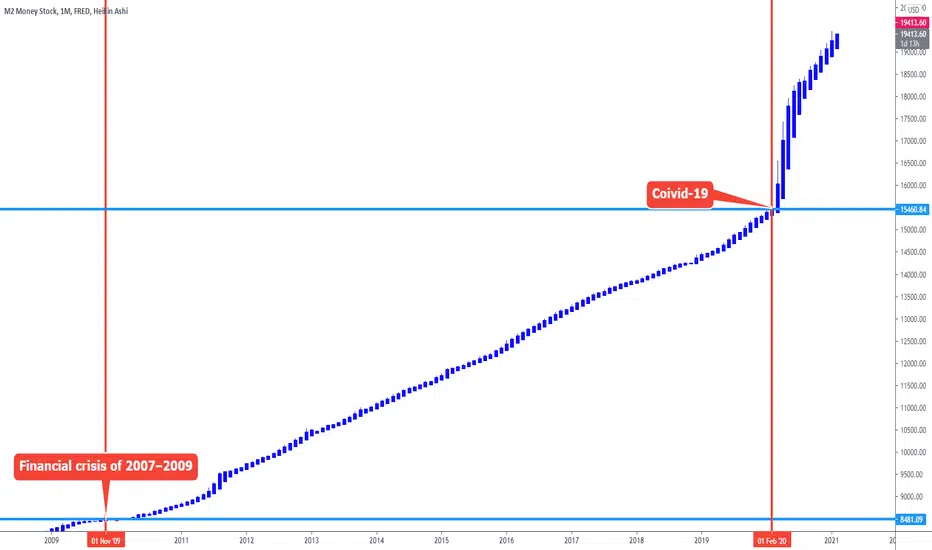
Don't use current M2 data, it has been discontinued.If you're a analyst that has been using M2, I'm here to let you know the data has been discontinued. However, FRED is still updating the data under a new ticker "M2SL" and "WM2NS". Hopefully tradingview updates M2 with the "WM2NS" data from FRED as that one updates weekly now. Thanks for interacting with the post as it'll be more likely for tradingview to see this post and update the data accordingly. Also thank you tradingview for the hard work and consistent updates to the website and app.
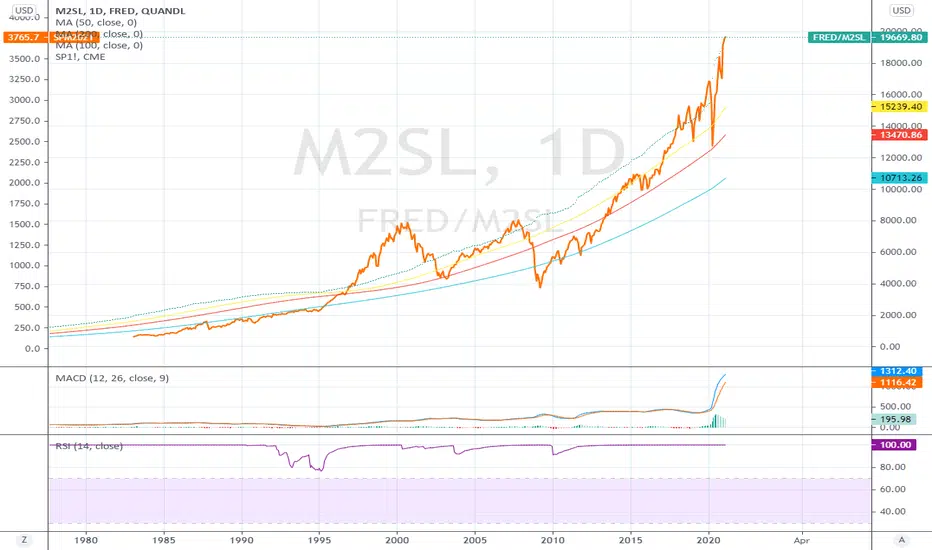
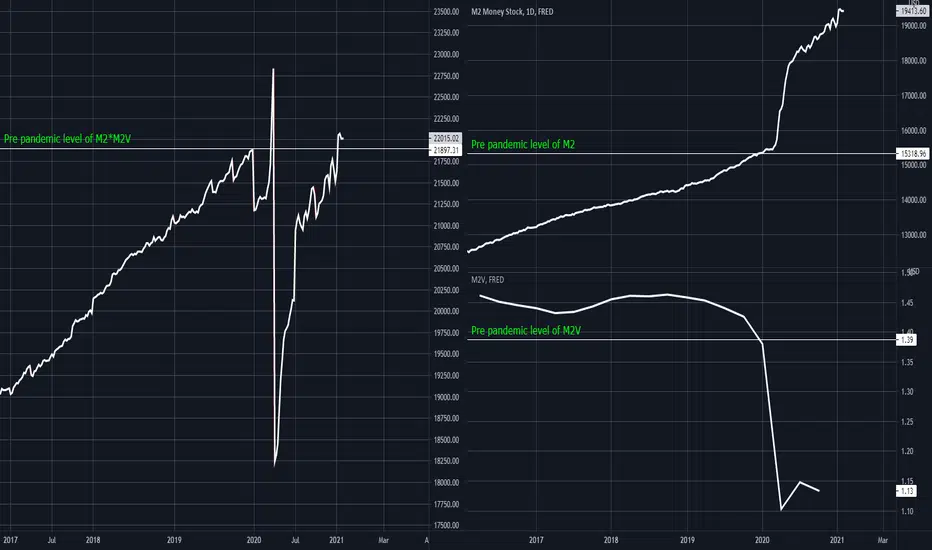
Don't just look at M2, look at M2 relative to the Velocity of M2Looking at M2 it looks incredibly Inflationary but where exactly is that Inflation? So I had to dig deeper, if you look at M2V, the Velocity of M2 or in easier terms, the number of times that the average unit of currency is used to purchase goods and services within a given time period, you will notice a sharp decline in M2V accelerated by the pandemic crisis. Now if you look at the amount of M2 you have to consider for it to be inflationary, it also has to have a high velocity, or productiveness inside the economy. So if you now look at M2*M2V, the amount of M2 multiplied with it's velocity, the chart on the left, you see that relative to it's velocity M2 by far has not increased as dramatically as it seems if you just look at the amount. So if the amount of liquidity in the system increases but the realitve productivity of that money goes down it most likely is not as inflationary as you might think by only seeing the increased amount of liquidity. The crucial thing to watch is now if the increased amount of liquidity will increase in velocity which then very well can lead to a much higher inflation in cosumer goods. But keep in mind that there is a good chance a lot of the realitvely inactive money might has been inactive because it has positioned in equities and commodities, so if the economy now reopens some of that investments might be liquidated to consume rather than staying invested in financial assets, that not only concernes households but also small and medium businesses. So it is mostly crucial to keep a close eye on the M2V to see if actual consumer good inflation is to come or if this amount of liquidity will just keep raising the market to even more all time highs. This also coincides with yields which eventually can be very harmful for governments in huge debt, and as the fed has to rely on private banks to buy treasuries, which won't do that in the current extent, if real inflation is on the horizon, soly because they would loose a lot of money holding most liquid assets like treasuries or reserves, the fed won't be able to continue buying so much of the government debt causing the government to find someone else to buy it or to force public savings institutions into buying it by else going bankrupt out of inability to service it's debt.
🔥BREAKING: House passes $1.9 trillion Covid relief bill .The House passed its $1.9 trillion coronavirus relief package, which will head to the Senate.
Democrats in both chambers aim to have the legislation passed and to President Joe Biden’s desk before March 14, when unemployment aid programs expire.
The party is likely to pass the plan on its own, as Republicans have questioned the need for another massive spending package.
We are not registered or licensed in any jurisdiction whatsoever to provide investing advice or anything of an advisory or consultancy nature,
and are therefore are unqualified to give investment recommendations.
Always do your own research and consult with a licensed investment professional before investing.
This communication is never to be used as the basis of making investment decisions, and it is for entertainment purposes only.
BITCOIN WILL DEFEAT THE DOLLARMonetary base is now at 18T. The FED just modified about a year of historical data to reflect something new. Bitcoin will be the new reserve currency.
Thoughts?
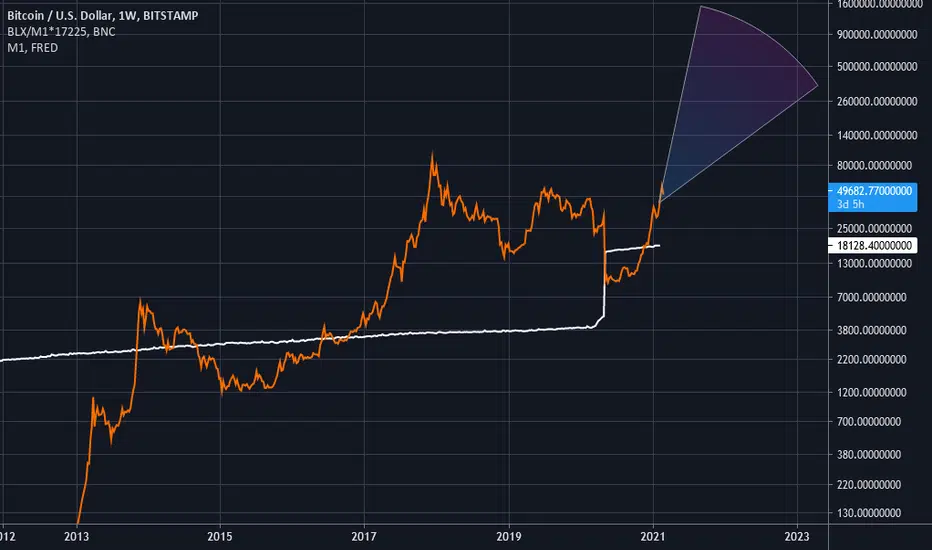

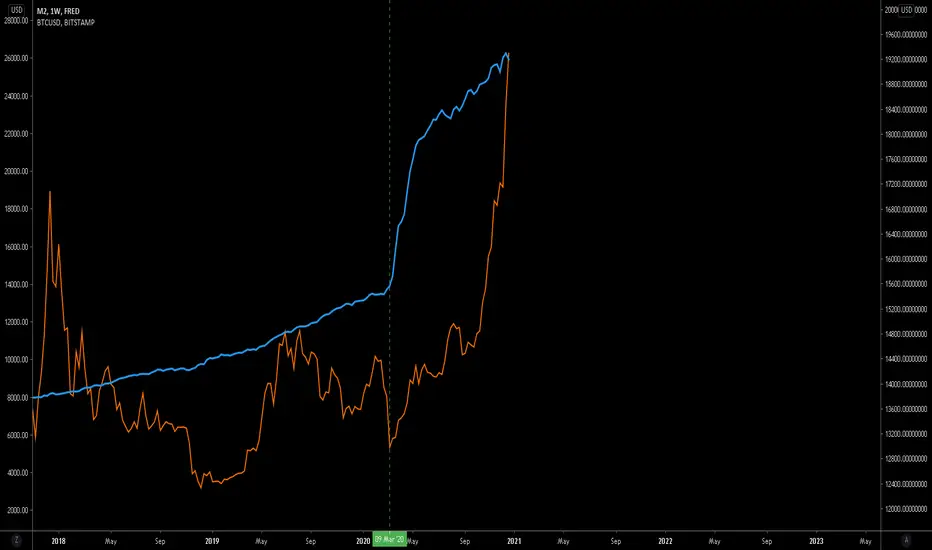
Ad the M2 money supply to your BTC chart to see where we are ...BNC:BLX
... and where we should be :)

Total Market Index Significantly Outpaced the Money SupplyIt seems like good deals are to be had when the total stock market increase is below the increase in the overall money supply.
The green is the M2 money supply and the yellow line is the VTI total stock market index.
You can see you got a good deal in March when stock prices fell below the increase in the money supply. The same for 2019 and 2016.
There might be something of a bubble as current prices significantly outpaced the growth in the money supply.

The US Dollar and the Future of the Asset MarketsIn this analysis, I'll take a look at the US Dollar Index (DXY), analyze it from both a technical and fundamental aspect, and look at what this could imply for the asset markets this year.
DXY Technical Analysis
- To begin with, we can take a look at the monthly chart for the dollar index
- Since 2001, it has been on a downtrend, and ever since 2008, it has been trading within an ascending parallel channel, creating higher lows and higher highs
- We are currently testing the bottom of the channel support, which aligns with the 0.382 fibonacci retracement level
- Should we see a technical bounce, we could expect huge resistance at 101.7
- If the structure breaks down without a dead cat bounce, we could expect some support at 82.5
DXY Fundamental Analysis
- Despite potentially bullish signs from a technical perspective, all fundamental aspects suggest otherwise:
- Due to the Covid Pandemic, we have seen quantitative easing take place at an unprecedented rate
- Biden proposed a $11T spending plan. Regardless of whether he can enact it, this is certainly bad news for the dollar
- Talks of a $2,000 stimulus is taking place, and it's very likely that it could pass
- When the Fedd raises rates, the USD rallies strongly against assets.
- However, it was said that the Fed would keep the near-zero rates at least until 2023.
So what does this imply for the asset markets? How can we capitalize on this opportunity?
- The chart above demonstrates the following: US Dollar Index (DXY), Nasdaq Composite Index (IXIC), Bitcoin (BTC), and M2 Money Stock (M2)
- We can see the clear change in trend after the Covid shock in March
- The Covid outbreak began around late November in China, but it was only in March that the global financial markets were hit
- Ever since March 2020, M2 has grown at an exponential rate, and with this, the dollar has fallen dramatically while asset and security prices have risen significantly
- As fundamental factors may drive the DXY further downwards, it's reasonable to expect asset/securities prices to rally upwards.
- As such, it's important to understand that the returns you made in 2020, and will make in 2021, is a byproduct of strange macroeconomic situations, in which your cash is becoming trash.
- It may seem like you're earning money, but in reality, most of it is asset/security prices being inflated.
Does this mean we are in a bubble?
No one can predict the future, but in my humble opinion, it's hard to confirm that this is indeed a bubble.
To understand my perspective in depth, check out my previous analysis below:
For us to not undergo another bubble that'll be written down in history, it's important that we see the real economy catch up with the rather hyped-up financial markets. Of course, we'd have to see the majority of the world's population get vaccinated, and have the Covid pandemic settled to an extent, where people can have their normal lives back.
It's important that capital be invested into medium-small businesses, which serve as real jobmakers, and have individuals consume goods and services, rather than save their money, or invest in financial markets.
Conclusion
In conclusion, it's important that retail investors and traders focus on improving their sharpe ratio this year. We may, or may not be in the middle of a bubble. Only time will tell. What we can do, is meticulously manage risk, and focus on maximizing returns while reducing the chances of losing it all, in case this market does turn out to be a bubble.
If you like this educational post, please make sure to like, and follow for more quality content!
If you have any questions or comments, feel free to comment below! :)

SPX's Correlation with M2 since 1980.Definition
Correlation Coefficient (CC) is used in statistics
to measure the correlation between two sets of
data. In the trading world, the data sets would
be stocks, etf's or any other financial
instrument. The correlation between two
financial instruments, simply put, is the degree
in which they are related. Correlation is based
on a scale of 1 to -1. The closer the Correlation
Coefficient is to 1, the higher their positive
correlation. The instruments will move up and
down together. The higher the Correlation
efficient is to -1, the more they move in
opposite directions. A value at 0 indicates that
there is no correlation.
----------------------
M2 is a measure of the money supply that includes
cash, checking deposits, and easily convertible
near money.
M2 is a broader measure of the money supply
than M1, which just includes cash and checking
deposits.
M2 is closely watched as an indicator of money
supply and future inflation, and as a target of
central bank monetary policy.
-------------------

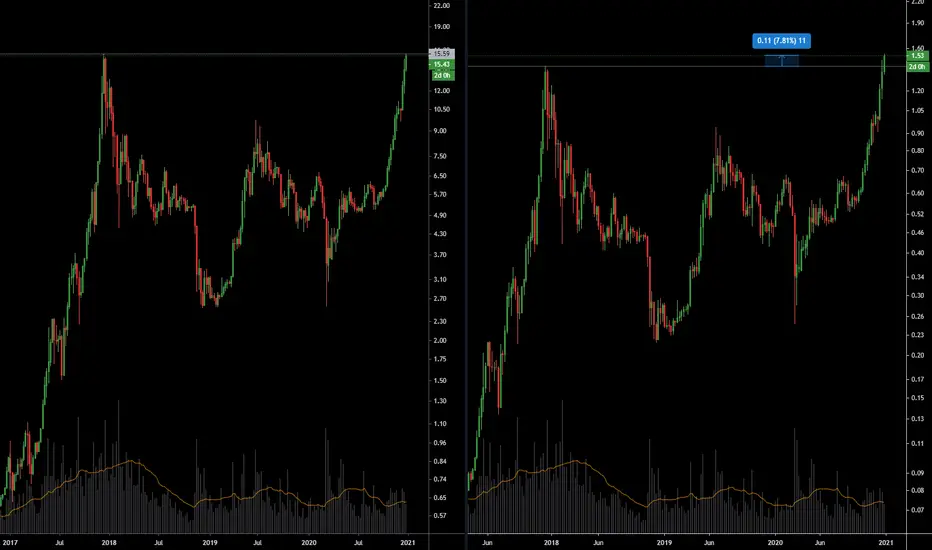
BTC/GOLD & BTC/M2 near 2017 ATHI have been plotting BTC against GOLD (left) and M2 (right) to try and look at the value adjusted for inflation and buying power (using gold to measure buying power).
M2 is the amount of money in the world (to simplify it) and BTC / M2 has already broken the 2017 ATH by 7.81%. This is a good sign as it shows that we have surpassed the previous cycle high when adjusted for the money printing that has happened since then. If we only look at BTC /USD we do not take into account the devaluation of the dollar over time, and the loss of purchasing power caused by this. It is not perfect as we are simply adjusting for the money printed but not for the change in prices of all assets (and stuff in general), so we look at gold too.
Gold is commonly used as a hedge against inflation and a stable store of value (this paradigm may change soon) and BTC is slowly becoming seen as gold 2.0. Looking at the price versus gold is useful as it adjusts for inflation (in a way) but more importantly buying power. Gold is not a perfect inflation hedge as studies have shown it does not necessarily correlate well to inflation . It does however have a good record of holding its purchasing power over a long time, but not perfectly (see "The Golden Dilemma" paper from National Bureau of Economic Research). Looking at BTC / GOLD shows us that BTC has not yet broken ATH but is close. Meaning that to buy 1 Bitcoin , it will cost you roughly the same purchasing power as it would have back in 2017, not more as the BTC /USD chart would have you believe. I'm using this chart since we are in a blue sky breakout right now, and there is no real way to tell where we may top out. This chart can help with spotting with potential danger zones and reversal areas.
If we do not break the ATH vs GOLD to me that shows that BTC does not have the confidence behind that you may think it has when reading the news. However I think we will break through at some point soon, hopefully after a pullback so I can buy more spot. I'm not making a call on which way this will go. I'm just sharing some charts that people often over look, but can be very useful in times with no historic price action to help make sense of.
I'm very interested to hear peoples thoughts on this in the comments.
ps. HAPPY NEW YEAR