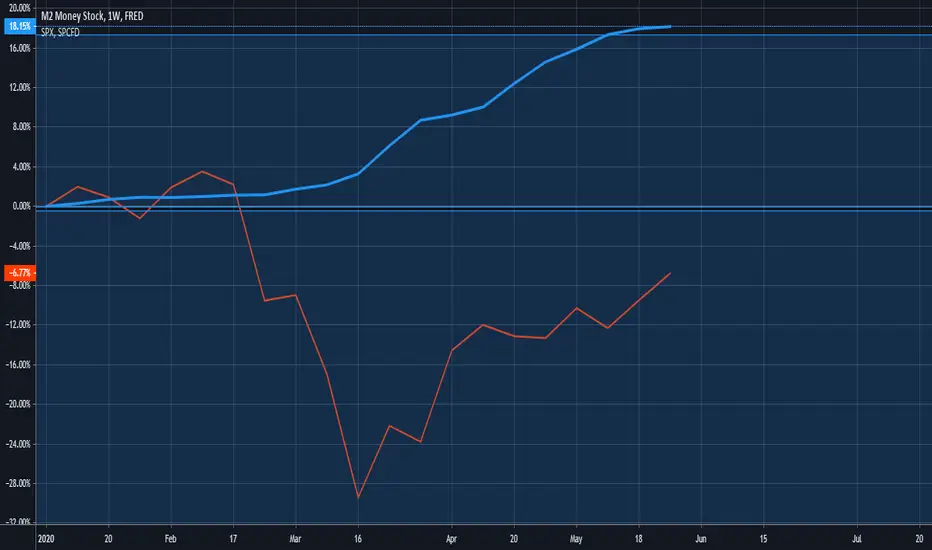
Explain why M2 Money and DXY shrank while SPX remained high?An interesting thing happened in the last 2 weeks of November.
Money Supply: United States people fled to cash by converting M2 money stock (savings, investments, money market) into M1 (checking and cash).
Dollar: Foreign investors presumably sold off dollar assets bringing DXY down around 2% in the month.
To recap: The money supply indicates that US people sold stocks and bonds. The Dollar decrease indicates that foreign investors sold stock and bonds.
Explain to me, then, how SPX remained elevated? How is it doing that?
M2

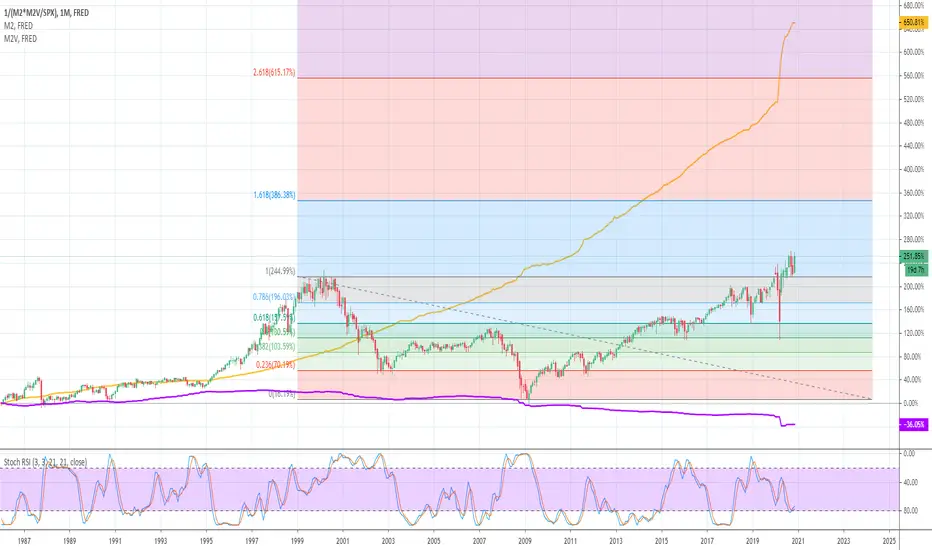
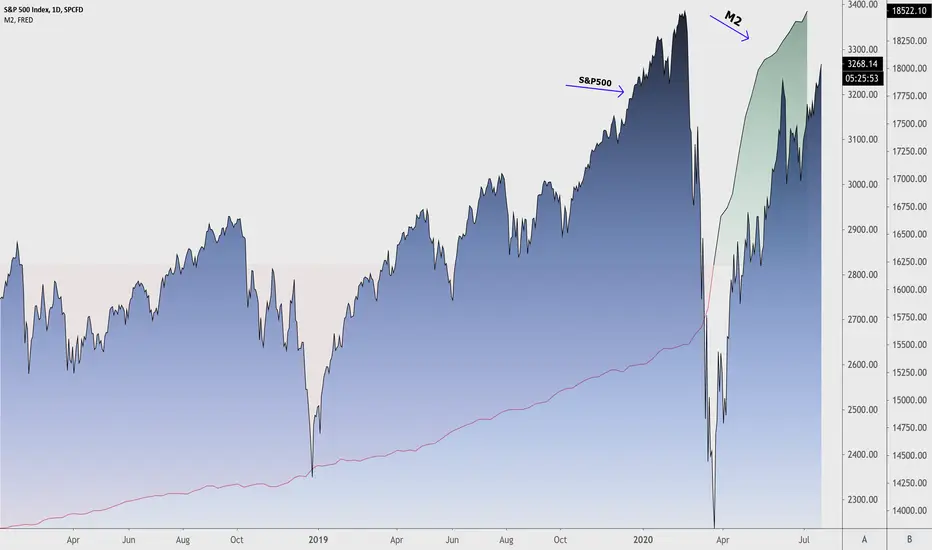
SPX via Equation of ExchangeHi everyone, I am doing some self study and have created the graph above.
using the equation of exchange M*V=P*Y I have calculated 1/Y.
M = Money Supply
V = Money Velocity
P = Price (S&P index value)
Y = Real Output/Value
Keeping the above in mind I calculate 1/Y (inverse because chart is easier to look at)
1/Y = 1/(M*V/P)
Adjusted Value = 1/(M2*M2V/SPX)
With the math listed here we can see that the recent volatility (past 2 years) may have been the result reaching the previous dotcom peak.
We are now resting on top of that peak as support. The trend is consistent and the Fiscal/Monetary response is firmly in control of the market.
If we were to break down from here this chart could be interesting to gauge where the bottom is without as much noise.
Please leave your comments and correct me if you see anything I can improve upon. I am still learning and not a financial advisor/professional so please do not make any trades on my advice.
If you do not look at this as 1/Y and instead just Y it could indicate that real output is falling over time however I would like to discuss this further if anyone has opinions.
Personally I am interested in Asain markets and Gold going forward.
- Salty
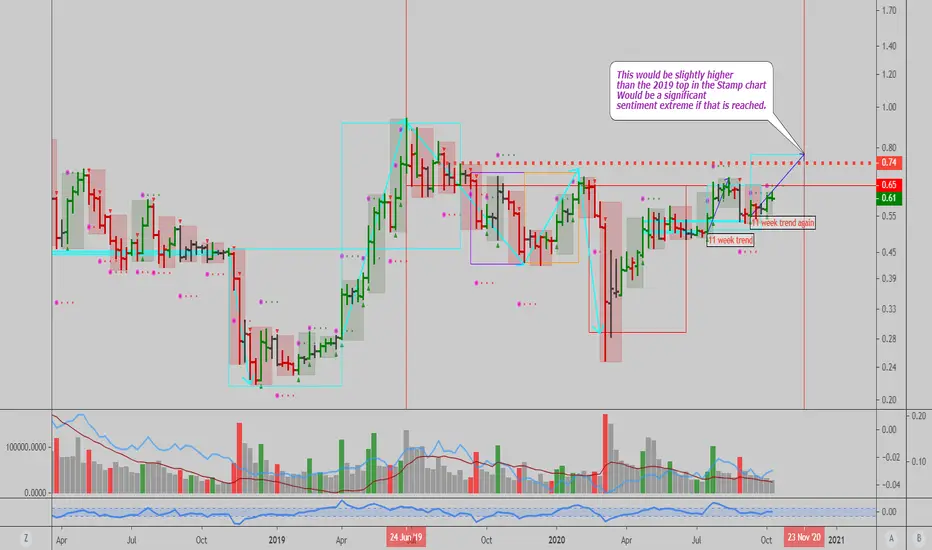
#BTCUSD: Bullish until the end of November...I suspect we are seeing a failure in the bearish signal we had recently, and yet another bullish trend in the weekly timeframe here. The M2 adjusted chart is highly interesting as it predicts we may see prices break the 2019 top briefly, I fear this might lead to an extreme in bullish sentiment a subsequent market crash towards lows not seen since the COVID bottom.
I remain cautiously bullish, and patiently waiting to short the top when it materializes as per this analysis.
Here's the spot chart for reference:
Note this is a bullish idea for now, potentially leading to a major market top by the time it peaks as anticipated.
The commitment of traders report shows that CME short sellers keep increasing their short position, and asset managers buying (over record levels). At some point short sellers are likely to win, as has been the case so far.
Disclaimer: We're long for the time being.
Best of luck!
Cheers,
Ivan Labrie.
Nothing Changes - The Next Mortgage CrisisWe all know it's going to happen, just a matter of when, it seems.
Day after day, I come across different traders who have their own narratives about when this debt crisis will finally rear its ugly face and we will be faced with a sober reckoning of decades of monetary irresponsibility and irresponsible allocation of scarce resources to state capitalist companies that veer further and further away from sensible business decisions. Some of us seem to think that it is right around the corner, and that we've got to stack gold, silver, and/or bitcoin to prepare ourselves. Others believe that it's just a deflationary downspiral from here. Most of us seem to be inbetween.
For me, I think it is pretty easy to see. And though my indications would otherwise be seen arbitrary or even nebulous, I think there are some important facts that we have to make clear so that the future isn't as unclear.
The first thing I want to bring to everyone's attention is the growing mortgage-backed securities (MBSs) owned by the Fed, and what this means, put simply, for the rest of the economy and our private banks.
After the pandemic scare, among everything else dropping, one thing didn't see a drop, but a stark, parabolic rise: MBSs owned outright by Federal Reserve Banks. We saw a nearly 30% rise since mid-march:
fred.stlouisfed.org
A rise, which had been seeing a gradual, but steepening, fall since February or March of 2018.
This means two things:
1. Creditors who owned these MBSs held little faith that they could make passive income from the interest off of these MBSs, and sold them to the highest bidder (always the good ole ' Fed).
2. Creditors, also, had little faith in the outlook for these MBSs since any hope for rising interest rates were put to an end, and the narrative that they will be higher doesn't seem to be coming back for a long time. In my opinion, these hopes will never come back.
So how does this affect the banking sector? There's no way they can compete with the Federal Reserve, at this point. If you are inflationary about the future, then you will understand that the Federal Reserve is very deadset on making sure no bubble pops. They will do this by buying up all the debt that they can to avoid default. Unfortunately, this doesn't last forever, and at some point, the Fed is guaranteeing the debt of the whole country, and banks cannot compete with the ultimate market maker and the ultimate currency-producer. For debt-ridden, irresponsible Americans, it will be a wolf in sheep's clothing that seems like a Godsend as every bit of their debt is turned into an asset by the Fed, and even further, as the dollar continues to be debased and "realligned", they will see a steep drop in the strength of their buying power. That's what happens when all of your manufacturing and resources have been imported for decades, and a majority of your skilled workers are foreignborn who have an easy ticket back home where it is much less zany.
I think it is a joke to be deflationary with facts like this. The one needle of deflation in the inflationary haystack is that GDP will slow, and the Fed and Congress will be powerless to stop Americans from saving and paying off their debt, which would be a fair point, if every bit of info was against this. Americans are still the worst savers, incredibly indebted, and will look to any handout that they can get. I think the inevitability that negative interest rates are coming will end up benefitting Americans in the mediumterm.
Negative interest rate policy, NIRP, will be a reckoning for Americans' lifestyle, that will whither down to look much similar to those in Cuba or Albania during communist rule. Debt will be basically turned inside out into credit, and your debt will be used as a backing to the currency. The more you spend, the better. Anyone who has read about government cryptos and NIRP/ZIRP will understand this. Our monetary system will be backed by debt, much like it already is, but the velocity will be kept up so high that in order to maintain your standard of living, you will have to keep purchasing. Put simply, every month you'll get however many dollars, and there will be a timer on it that will expire after however much time, and you will have to spend it all, or it will disappear. Much like vacation days at a lot of your jobs at the end of the year.
Now why would we take a step in this direction? It's only because the Fed and gov't have all interest to do so. Sure, all of our standard of living will diminish, but the Fed will be heroes and be seen as the saviors who helped uphold American lifestyle while the greedy companies tried to steal from us. Everything is in their favor - the government and government-owned media control the placement of the Overton Window.
So to clarify, the main reason the Fed will inevitably be the last bank standing will only be due to the fact that they will do everything they can to stop this Everything Bubble from popping, and will gradually, own every bit of debt out there, and have to rely on NIRP to keep anyone from defaulting. The average American, who can't even tell you where France is on a map, or who Robespierre was, will laud NIRP because it allows them to maintain whatever leveraged lifestyle they've been maintaining for decades, without any attempt at saving or financial planning.
www.cnbc.com
Americans raiding retirement savings to avoid defaults and to stay afloat.
www.marketwatch.com
"One-third of homeowners have less than $500."
"25% of Americans have no emergency savings... 16% have taken on more debt... nearly 1/3 report having lower income than at the start of the pandemic."
"Some 95% of workers in low-income households — making less than $36,000 per year — have either been laid off as a result of the coronavirus (37%) or have experienced a loss in income (58%). A quarter of workers earning between $90,000 and $180,000 a year saw an income loss."
This is a huge point that deflationists and inflationists alike will use to push their narrative, but only the inflationists are right when it comes to how the Fed will act. Sure, the initial onset of Americans jumping into the dollar is a magnificent tailwind for the DXY, but the Americans who have to endure a new loss of income who are extremely frustrated with how things are going, in tandem, with politicians who are steadfast in trying to bring whatever relief will not bide well for deflationists. We either see growing unemployment, growing social unrest, and everything under the sun that is perfect for a violent revolution and exponential drop in standard of living, or we see what we've been seeing for years - Fed and gov't action to maintain status quo and freebies for as long as their fake currency can stand it.
So as unemployment stays steady, standard of living sees a drop, and more Americans save, there will be more of a rush for the Fed to take action and prop up what corporations they can and back whatever debt possible to keep the rusted, empty freight-train rolling at mach speeds.
And in short, the markets see no signs of dropping. We might see another big drop soon as people draw from their pensions and 401ks, but technical indicators see further moves up for the major indexes. The time for a big drop is now, and it just hasn't happened - not as violently as many of us initially thought. Going short is a good way to get screwed super quick in a bubble that is everinflating.

Gold Vs m2 and SPX have more room to grow than u thinkPast week, gold only followed dxy moves, how many more days left?

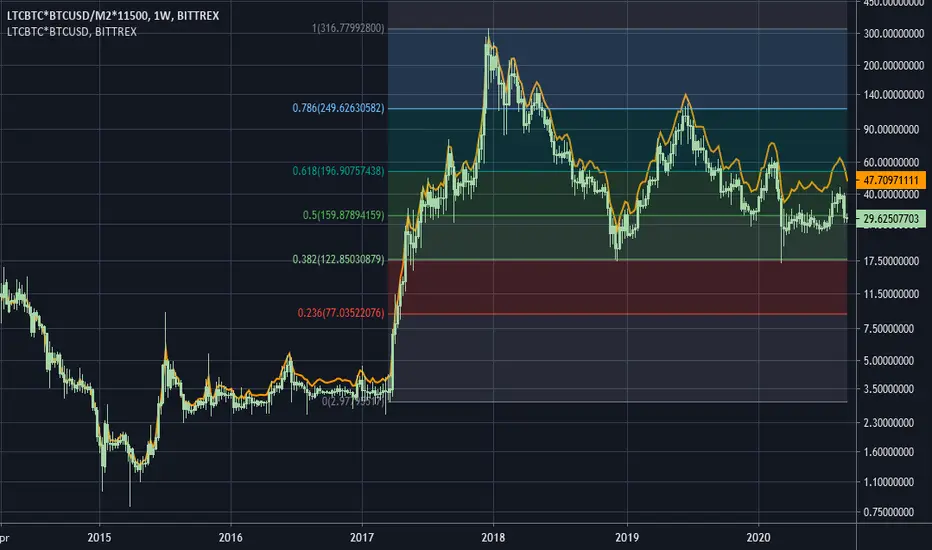
BTCUSDT/M2 - The Beginning of the End?BTC has had an extended bullish push up from the March 2020 "Black Swan" lows and by most metrics this recent sell-off looks like just another one of its large corrections the crypto is known for.
As many have noted, throughout the covid crisis most world economies have been printing money like there's no tomorrow nor consequences of doing so (insert "money printer go brrrr" meme here). So, we have hugely over-inflated fiat currencies (most notably the US dollar) and crypto currencies (USDT supply at ATH), and a surplus of money to be injecting in to the market following massive bailouts of corporations - pumping up prices and giving us all the illusion of safety. Looking at traditional markets' indices, the SPX500USD & NAS100USD have both recaptured and soared past their previous all-time-highs when not accounting for the M2 money supply.
However, what story do these charts tell us when we do take the M2 supply into account? Looking at BTCUSDT in particular, we can see that we had a clean break of the bearish market structure line in November last year and despite the 170% pump we've seen this year, we've failed to push above the weekly bullish market structure and have instead rejected the key resistance point of the quarterly premium taken from June '19 highs to March '20 lows. We are now creating a series of lower highs and lower-lows after having broken the 3-day bearish market structure at these key levels - indicating further long-term bearish price action if we fail to recapture above the 12060 level.
Could this year's pump have simply been a return to a key liquidity level for smart money to have taken their exit positions? It's certainly starting to look that way.

The myth of hyperinflation series #5- Velocity of moneyEven if the purchasing power is rising, without the increase of velocity of money, there will be no inflation and sustained economic growth.
Circulation/velocity of money measures the interval between money transactions, decline means less transaction is taking place and the interval between money transactions is getting longer.
According to the July 2020 Senior Loan Officer Opinion Survey on Bank Lending Practices, senior loan officers have tightened their standards and terms on commercial and industrial (C&I) loans to firms of all sizes. Furthermore, banks reported weaker demand for C&I (commercial & real estate) loans from firms of all sizes and weaker demand across all three major commercial real estate (CRE) loan categories- construction and land development loans, nonfarm/nonresidential loans, and multifamily loan over the second quarter of 2020.
Next, we will look at demand and consumption.

Every time M2/Silver RSI hit these levels S&P500 had a setbackEvery time the M2/Silver ratio RSI hit these levels S&P500 had a setback. Will this time be different?

So is the printing over?July seems to indicate the first monthly decline in M2 in many years. Is the Fed reigning things in?

Velocity of Money (M1 and M2)M1 = coins and currency in circulation + checkable (demand) deposit + traveler’s checks.
M2 = M1 + savings deposits + money market funds + certificates of deposit + other time deposits.
The velocity of money is the frequency at which one unit of currency is used to purchase domestically- produced goods and services within a given time period. In other words, it is the number of times one dollar is spent to buy goods and services per unit of time. If the velocity of money is increasing, then more transactions are occurring between individuals in an economy.

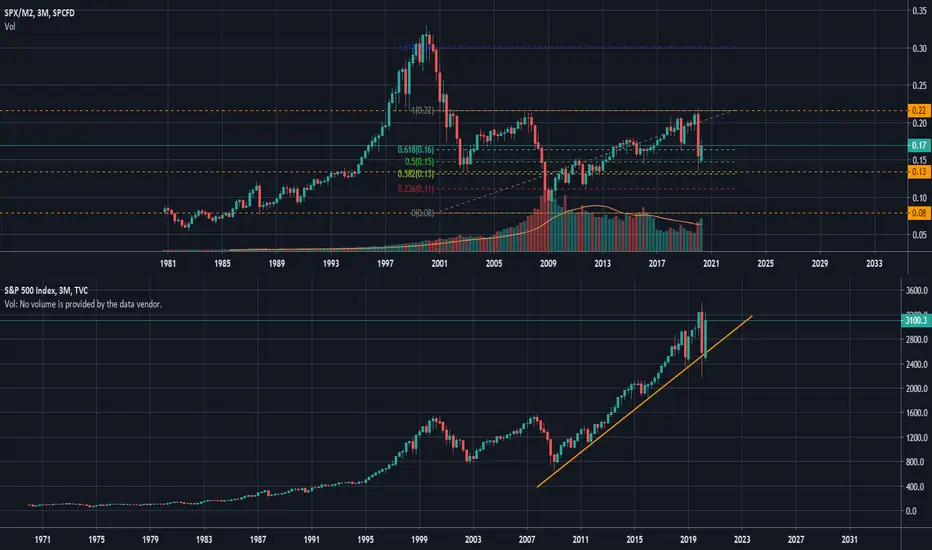
SPX / M2 paints a very different picture of the global marketThis chart shows the SPX/M2 and essentially paints a picture of the SPX when accounting for inflation.
All the "gains" made in the time following the 2008 crash, after factoring inflation in, simply put price or "value" back to where it peaked.
How interesting that the 2020 crash should occur at such a pivotal TA level, forming a near perfect sweep of highs and double top.
From this view, it looks as though the price action following the 2020 march lows is simply amounts to a bearish retest.
Will be an interesting one to watch as the money printer fires up yet another round of QE.
Brrrr, brrrr, brrrr.....

Gold vs M1 and M2 Money SupplyM1 = coins and currency in circulation + checkable (demand) deposit + traveler’s checks.
M2 = M1 + savings deposits + money market funds + certificates of deposit + other time deposits.
We are looking at the GC1! gold futures vs these money supplies
As we print more we expect these money supplies to increase, so we can start to see the 'real growth' in terms of how much $ is 'out there'
I examine lots of these 'composite' charts as I call them, but let me know your thoughts as well!
**NOTE** Because sometimes there are scaling issues; attempt to line the angles up with the black lines with same origin, thanks!
Manage your own risk
Much Love
GL HF
xoxo
snoop

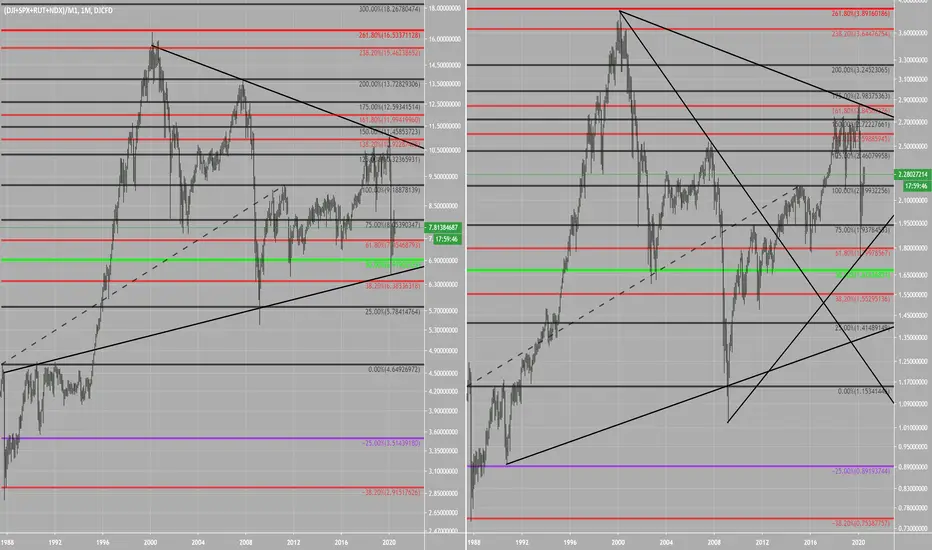
Indexes vs M1 & M2 Money SupplyM1 = coins and currency in circulation + checkable (demand) deposit + traveler’s checks.
M2 = M1 + savings deposits + money market funds + certificates of deposit + other time deposits.
We are looking at the major US Indexes Dow 30, SPX 500, Nasdaq 100, & Russell 2000 vs each of these types of money supplies
As we print more we expect these money supplies to increase, so we can start to see the 'real growth' in terms of how much $ is 'out there'
In the more liquid M1 Money supply it looks like we may have bottomed here on the indexes by testing the 'all time' trend line
But in the less liquid M2 Money supply we /could/ expect a fall further if things really go south here. We never tested the 'all time' trend line. No /need/ to but if we did it would be within reason.
I examine lots of these 'composite' charts as I call them, but let me know your thoughts as well!
Manage your own risk
Much Love
GL HF
xoxo
snoop
20% Increase in Currency Supply in 4 months!Just making an observation that the total amount of currency in circulation (Physical + Bank Credit) has increased an unprecedented 20% in the last 4 months. I believe, when we are looking at this chart, we are looking at a Credit Bubble.
Something that bothers me. Current National Debt is around $24.2T, however, we have $18.4T in total dollars in circulation. So even if you use every dollar in existence to pay off the National Debt, you still have $5.8T USD in debt remaining... how does that get paid off?? Need to dig more into this.

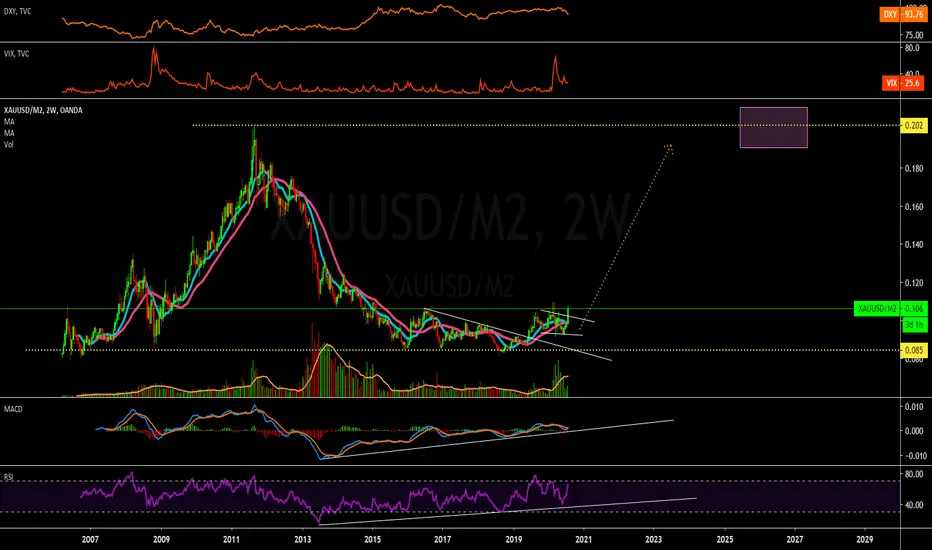
Commodities will continue to fly!This chart (XAUUSD/M2) is why I believe Commodities are going to rise in price for some time. I do not believe they have fully accounted for all the excess of currency supply we have accumulated in the last 4 months (from $15.4T to $18.4T USD), which has risen an unprecedented 20% from March until now according to the M2 chart. I believe we are now only at the start of seeing Commodities account for inflation due to excess Bond, Cash, and Bank Credit creation, partly fueled by the low lending rates. As you can see below, the last time this chart peaked was back in 2011. This seems to line up with when Gold reached its historic all time high (around $1920USD/oz) which held for the last 9 years. We are now back at this ATH and have gone beyond, however this chart is still does not seem to line up with this recent peaking of Gold. For this reason, I believe this chart has waaay more room to fly and take all Commodities up with it, and I can already see the patterns emerging indicating this. I believe you can park your cash in any Commodity for the time being and expect a return. The red flag for me to exit would be when the Fed decides to raise interest rates to curb inflation.
XAUUSD performance in recessionsWanted to show how Gold price performs during recessions. We are way out of scheme right now.

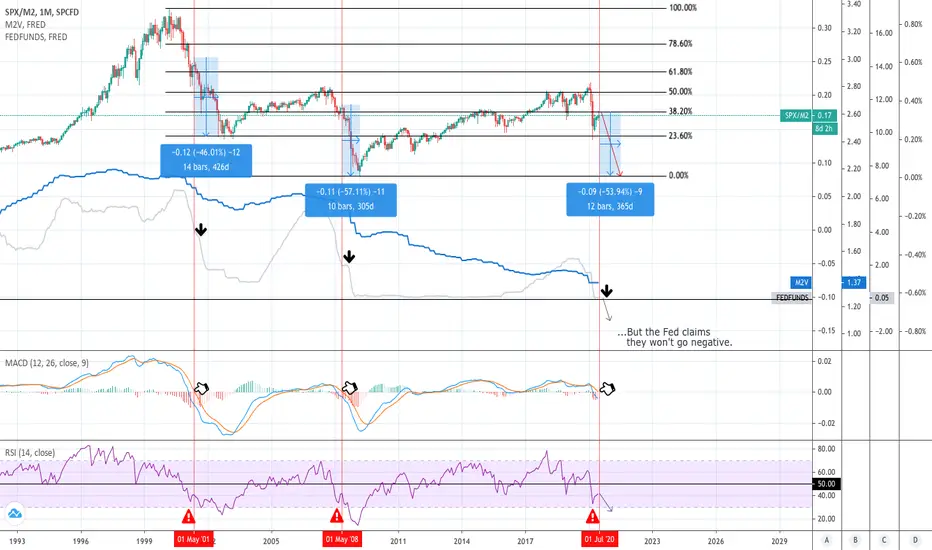
SPX Bear Market RallyJust like in May 2001 and May 2008, we appear to be in a bear rally. This is difficult to see by just looking at SPX because SPX is manipulated by the money supply; However, if you look at SPX/M2, this becomes more clear.
See the similarities on the RSI and MACD. This seems to suggest that some time before the end of July 2020, we will see a top in the market.
The Fed has stated they are not considering negative interests rates. However, if you notice during the previous two recessions at the top of the bear market rallies marked with the red vertical lines, the Fed had to continue lowering rates. Therefore, if the Fed stays true to their word and does not push rates into negative territory, it's possible that this 2020 Recession/Depression will be significantly worse.
If the Fed does not push rates negative, it's possible that some form of sustained "helicopter money" could be coming.
bullmarket or excess money supply?top is SPX/ money supply...
did we get richer in 10 years??
funny to see how we rejected the 2007 top and bounced back of the 2002 low...
I think the story is far from over...
Help me, FED Printer. You're my only hope.With S&P 500 closing on the 50 weekly MA. Markets are standing on the edge. All time highs are still totally possible if public sentiment allows for more printing. Months ago I suggested a possible crazy crash in DJI it's far for a certain reality though I found it eye opening to downside potential. I have linked it below. I am relatively neutral on market direction FED influence is to impact. Volatility is still high enough that stop positions could have a lot of downside risk. Looking at hedge strategies to cover those losses. Any suggestions welcome.

SPX vs M2 will it continueLooking at the M2 charts the the money printing seems to be slowing a bit still at a rate of over 8% per year. Comparing these to i'm considering 3 factors of what could be next.
1. Deflation stock market crashes and value floods into the dollar with another mass sell off. Looking for weakness in S&P as the printing slows.
If deflation happens having USD is ideal.
2.Back to normal M2 money levels off to normal's. The stock market maintains gradual growth, GDP increases. Velocity of money increases and exponential growth in cost of goods is not felt.
If back to normal happens having stocks might could be profitable. The biggest risk being the increase in cost of goods because of velocity of money increase.
3. Hyper Inflation this is least probable to happen next though still very much possible. In that case M2 would need to increase much more.
Cash would be worthless, stocks would be next to worthless though increasing in price daily in relation to uses currency. In this case gold, silver and cryptocurrencies would be ideal.
I think if this were to happen cryptocurrencies would have to compete with gold and silver to see which is better money.