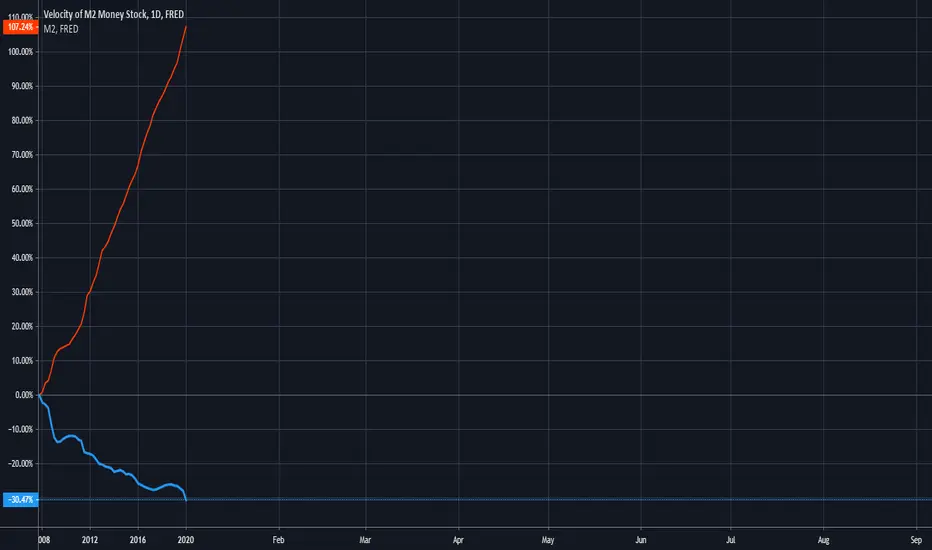
Can't feel inflation yetCan't feel the affects of inflation yet because the money that has been added to the financial system has not started to move yet. If we look at the comparison M2 money has increased by over 100% since 2008 yet the flow or velocity of money is down 30%. Keeping in mind that since the start of 2020 there has been an increase of M2 money around 16%. While many assets crashed against the dollar showing signs of deflation even though on paper money supply should be causing inflation. That is caused by money not moving and as a result there can be a steep devaluing of the currency once people start to spend again.
"What is M2?
M2 is a calculation of the money supply that includes all elements of M1 as well as "near money." M1 includes cash and checking deposits, while near money refers to savings deposits, money market securities, mutual funds, and other time deposits. These assets are less liquid than M1 and not as suitable as exchange mediums, but they can be quickly converted into cash or checking deposits."
www.investopedia.com
"What is Velocity of Money?
The velocity of money is a measurement of the rate at which money is exchanged in an economy. It is the number of times that money moves from one entity to another. It also refers to how much a unit of currency is used in a given period of time. Simply put, it's the rate at which consumers and businesses in an economy collectively spend money. The velocity of money is usually measured as a ratio of gross domestic product (GDP) to a country's M1 or M2 money supply."
www.investopedia.com
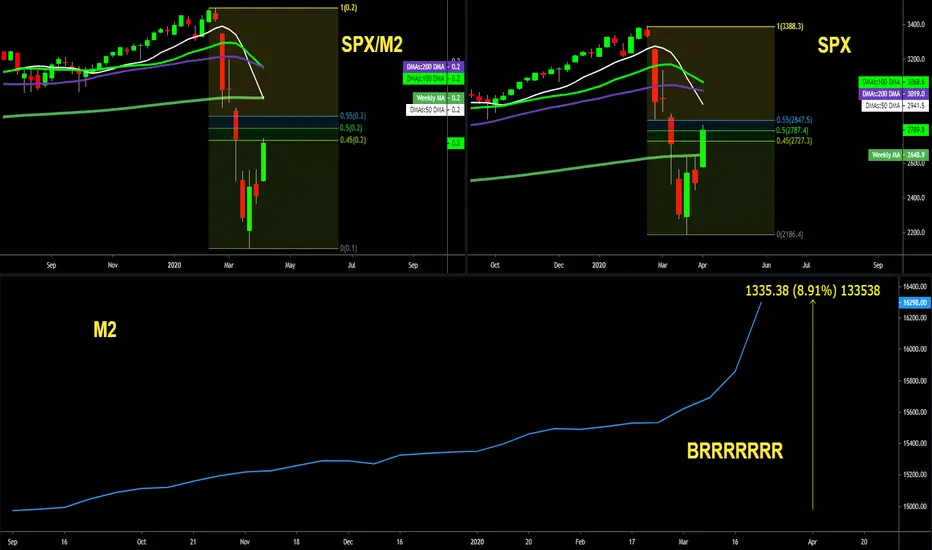
M2
Funny not funnyIt's funny how fast this is going up 16% in the since the start of the year. Sadly most people don't know anything about M2 money or Fed money printing. They will be the victims of this. Though I do believe it's best to not live the victim life. People should be educating themselves rather then blaming others. Regardless it's hard to watch people go rough times. Including the 120 Million people globally predicted by world food program to be at risk of starving due to lock down impacts on economics.

M2/GDP RatioThis ratio is indicating more pain to come from macro indicators such as the ISM Manufacturing PMI..

Fed Prints Money to Fight COVID19: M1 and M2The chart shows the sharp increase in US "money supply: upon Senate approval of a $2 trillion coronavirus stimulus package
Money Supply: There are two definitions of money: M1 and M2 money supply. M1 money supply includes those monies that are very liquid such as cash, checkable (demand) deposits, and traveler’s checks M2 money supply is less liquid in nature and includes M1 plus savings and time deposits, certificates of deposits, and money market funds.
The Federal Open Market Committee (FOMC) and associated economic advisers meet regularly to assess the U.S. money supply and general economic condition. If it is determined if, and how much, new money needs to be created.

Will M2 go above GDPLook at all the new money. With many people expecting GDP to decline will GDP be less then M2. We may see the velocity of money go below 1 for the first time. If then GDP picks up again people will be happy about jobs and GDP. What about the effects of all the money starting to move again causing inflation.

M2 Inverse HnS; Inflation rate increase - QuantRsi 1M From investopedia:
"Generally speaking, inflation occurs if M2 money supply expands faster than the rate of productive growth in the overall economy"
What I'm looking at here is a classical charting pattern painted by the QuantRsi:
With the QuantRsi applied to the Monthly M2 chart, a pattern is painted which can be used for technical analysis and classical charting.
Looking at the indicator as well as fibs drawn (log scale chart, correct fib tool used to prevent this issue:
getsatisfaction.com )
the M2 money stock looks like it is ready for a large increase sometime around 2020-2021.
This, coupled with slowed economic growth from rising interest rates, will result in increasing dollar inflation.
Because HnS patterns often have continuation when the neckline is broken, a QRsi value of +7 for M2 on the Monthly chart would confirm this idea.
Based solely on technicals, I believe that the inflation velocity will increase well in to 2025-2030. This coincides with fundamental analysis and other economic forecasts.

The 2020 OUTLOOK: Liquidity, Momentum and Stocks|Part (3/4)Short analysis on importance of ample liquidity ; Series on Equities and the 2020 Outlook: Part (3/4)- 28th Dec 19'
1. Naturally, there's a constant growth in money supply. Part of it ends up as investments in stocks. Hence, it is useful to look at the ratio between money supply and the returns on the market to assess the relative value of the market. This principle becomes especially important at the end of cycles, especially in a cycle that's driven by momentum . Comparatively, stocks aren't as overvalued as they were during the dot.com bubble, but at the same time the monetary base(purple line) has quadrupled.
In my last post I discussed the repo market and the balance sheet expansion.
2. Discussing the chart and starting with the cycle line at the bottom of the chart. It seems that, the market resets every 2.5 - 3 years . I n some ways, these intervals are influenced by liquidity crunches, and can be named liquidity cycles . Currently we are at a structural point, where the cycle ended in 2008 . This may be a short term resistance point. Thus far, the chart has been following the pitchfork trend-line quite well, and if this trend continues, I am expecting that the trend will touch the 0.618 fib retracement level in the next 2 years. Here's how rate cycles have developed since the 80's.
To sum up this idea. As I have discussed numerous times in my previous posts, expecting rise in volatility in 2020 until things settle after the election. This is just a noise . Most importantly in terms of growth and how equities will perform will be the outcome of the trade/cold war. China plays a major role in the liquidity cycle as the worlds biggest exporter. The cold war itself, at this point is here to stay . Phase I is completely unimportant in the grand scheme of things.
This is it for money supply and the SPX, thanks for the continuous support.
-Step_ahead_ofthemarket-
These are my two of my latest and most relatable ideas on the SPX and Investing.
The broad market outlook and guidance:
Investing Strategies, Value vs Momentum:
________________________________________________________________________________________
>>I do not share my ideas for the likes or the views. This channel is only dedicated to well informed research and other noteworthy and interesting market stories.>>
However, if you'd like to support me and get informed in the greatest of details, every thumbs up and follow is greatly appreciated!
Disclosure: This is just an opinion, you decide what to do with your own money. For any further references or use of my content- contact me through any of my social media channels.

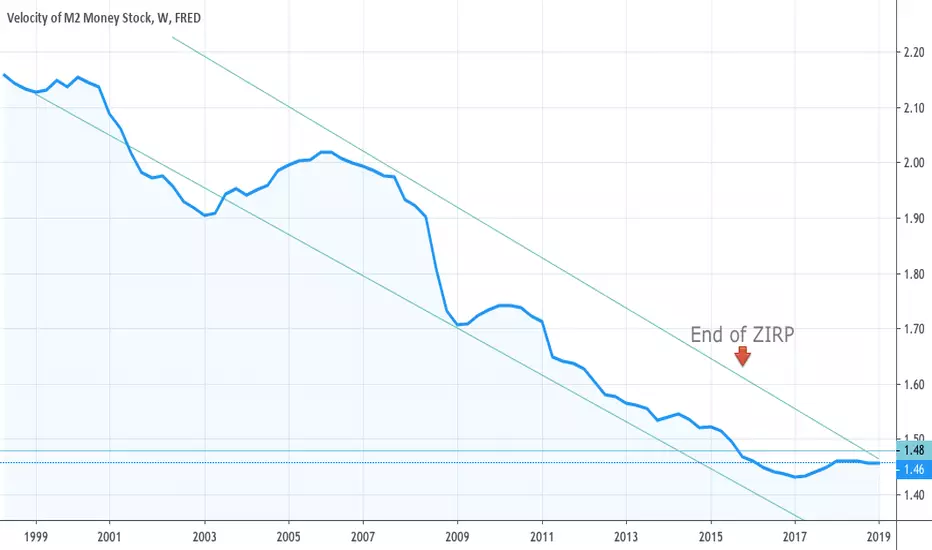
Velocity of money signaling economic depressionM2 money velocity is considered the pulse of an economy. This metric refers to the number of times a unit of currency changes hands between people and businesses.
As you can see, the velocity of money has been nosediving for decades. This is the story of the real economy, not the financially engineered stock market.
Notice that as interest rates began to normalize, the velocity of money saw some relief in its drastic fall. There's no doubt it will continue falling as interest rates move lower once again.
M1 vs M2 m1>m2 this is contango --- short(VXX) or long(svxy)
m1<m2 this is backwardation -----long(vxx) or short(svxy)

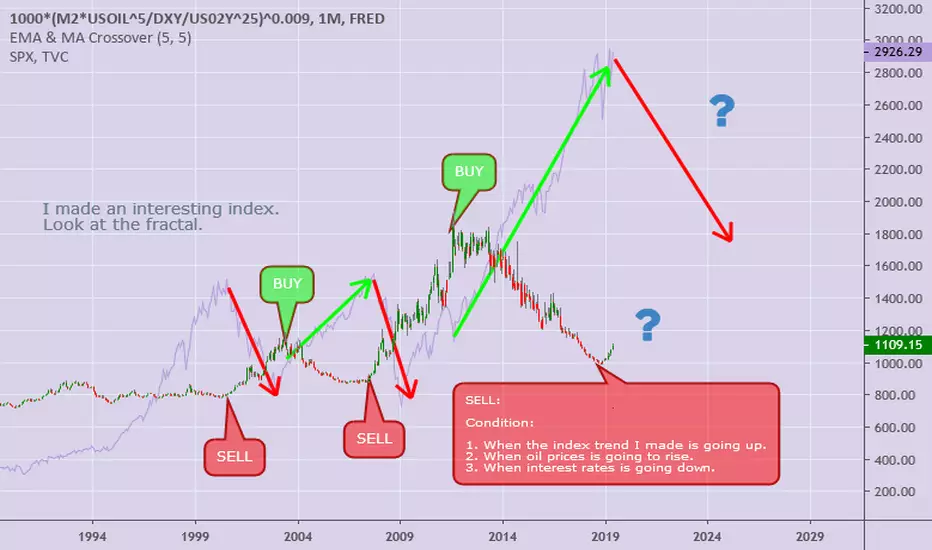
Look at the beautiful and powerful bubble index I made.Look at the beautiful and powerful bubble index I made.
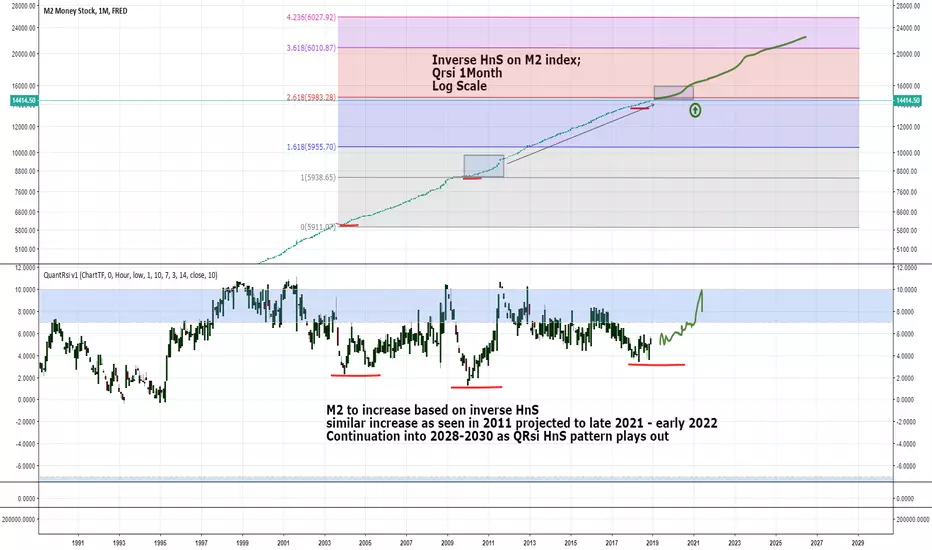
M2 Inverse HnS - Inflation Rate set to increase - 1M QuantRsiFrom investopedia:
"Generally speaking, inflation occurs if M2 money supply expands faster than the rate of productive growth in the overall economy"
what I'm looking at here is a classical charting pattern painted by the QuantRsi:
Applied to the Monthly M2 chart.
Looking at the indicator as well as the fibs (log scale chart, correct fib tool used to prevent this issue:
getsatisfaction.com )
the M2 money stock looks like it is ready for a large increase sometime around 2020-2021.
This, coupled with slowed economic growth from rising interest rates, will result in increasing dollar inflation.
Because HnS patterns often have continuation when the neckline is broken, a QRsi value of +7 for M2 on the Monthly chart would confirm this idea.
Based solely on technicals, I believe that the inflation velocity will increase well in to 2025-2030. This coincides with fundamental analysis and other economic forecasts.
DOW JONES INDUSTRIAL AVERAGE / M2 MONEY SUPPLYAs presented.
Interesting to see that we have regained 2008 value, net of money increase.. which is where we have run into resistance.

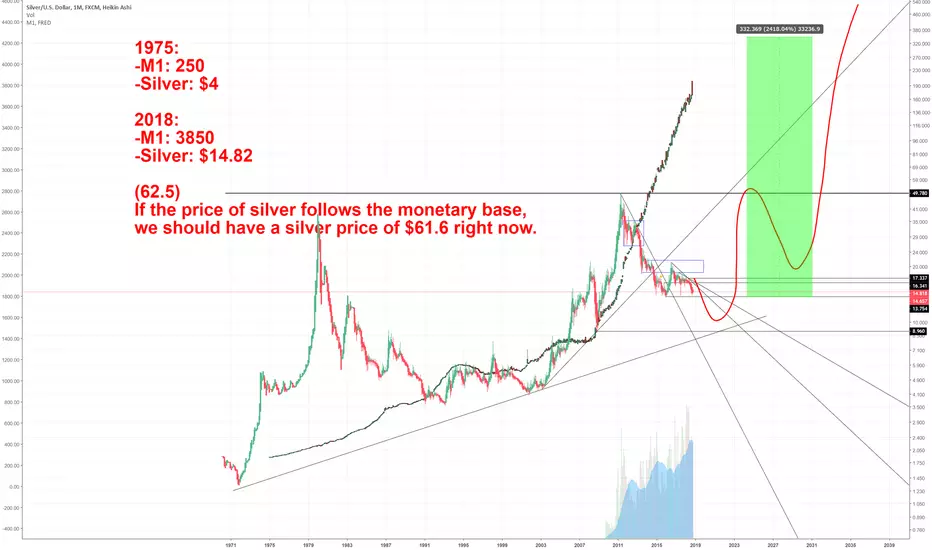
Silver vs M1just a dream~ continue stacking every month ;)
its a multi decade journey...
1975:
-M1: 250
-Silver: $4
2018:
-M1: 3850
-Silver: $14.82
(Ratio: 62.5)
If the price of silver follows the monetary base, we should have a silver price of $61.6 right now.
Gold silver ratio:
$DXY Forecast based on First 100 Days in OfficeA Trump victory would help support my bias toward A major market correction, caused by the fed raising rates far beyond the 50bp increments that has been talked up in the past.
I do believe A major correction is due. but the owners need a Scapegoat.
A Clinton victory, in my opinion, is already priced into the global marketplace.
Either way, on November 8th, I expect the DXY to clear out any liquidity at 88/100 figures


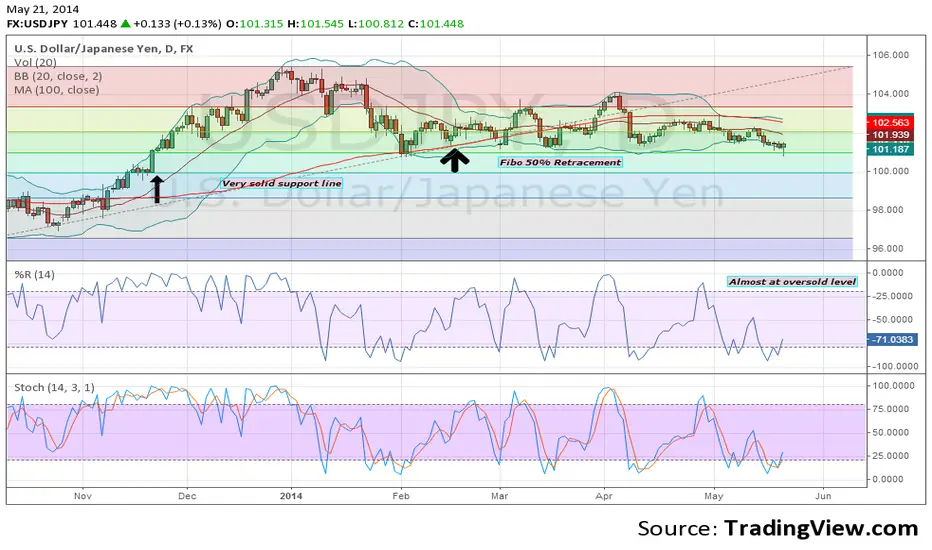
Short term Short, long term LongWell everything is said on the title, but if we do look carefully on the chart, the reversal pattern didn't end yet.
MA50 and MA100 are not crossing yet. We caliber MA on a faster period, we are not there yet.
USDJPY Pair arrived at a 50% Fibo retracement level. That support level is rather strong. Bellow, it's the 100YEN level which is quite strong as well and you would need a serious momentum to break it up.
Therefore, on a short term basis, there is still a romm for a downside, but I don't think that there is a lot of room left.
On macro economic terms, we should bare in mind many datas.
1- BoJ Has decided to end its monetary easing baring in mind the "positive" shape and the recovery of the Japanese economy.
2-FED is still keeping its schedule with regard Tappering. Which means that there won't be any more easy USD on the market.
3- FED's High level official are starting to talk about an eventual increase of interest rate which is something normal when you have printed that much money, in other words with de monetary supply made by FED that is rather normal no matter what is the shape of the economy.
4-On the Monetary Supply M1 + M2 in USD and with FED medium term policy, USD will strenghten against all major currencies.
Therefore there is still a romm between 101 and 100 but, on a medium to long term, USD should strengthen against JPY.