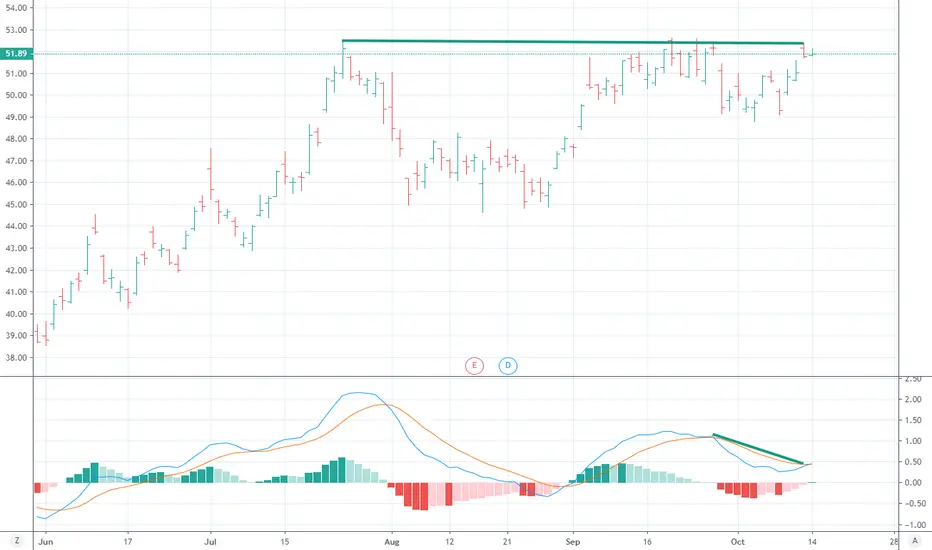
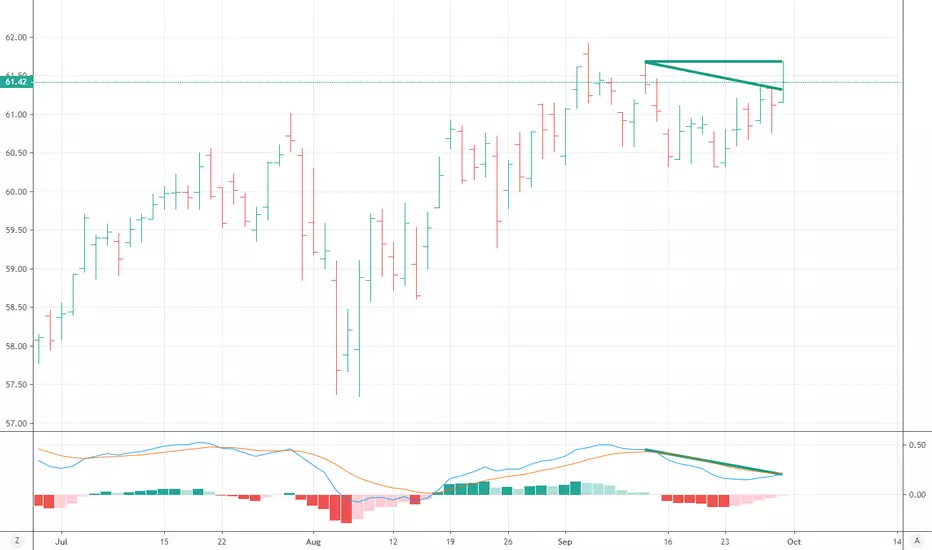
AMAT topping again with MACD diverging downAs AMAT has been moving away from the triple top the MACD has divergence down, prices look like theya re headed to the 49 level. Picked up osme October 25th weekly options the 49 puts at 32 c.
Macddivergence
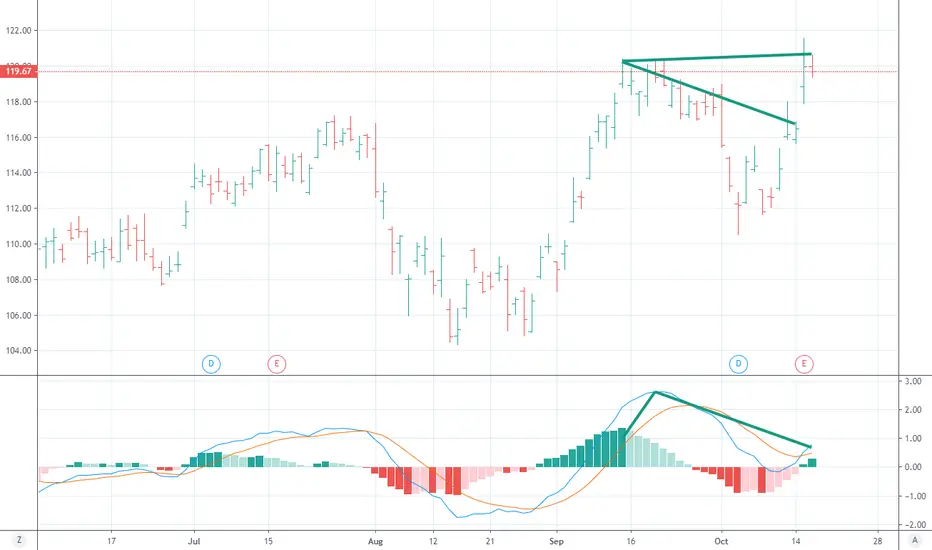
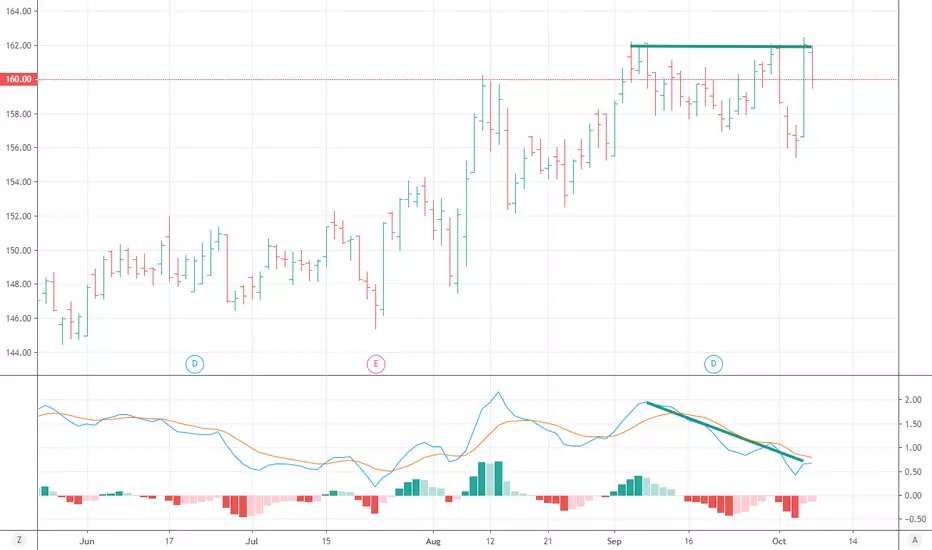
JPM and other banks double top and MACD divergenceJPM and other banks double top and MACD divergence looks to be rolling over and MACD seems to show we should be headed to $117. Picked up some Oct 25 expiration 117 puts for 51c
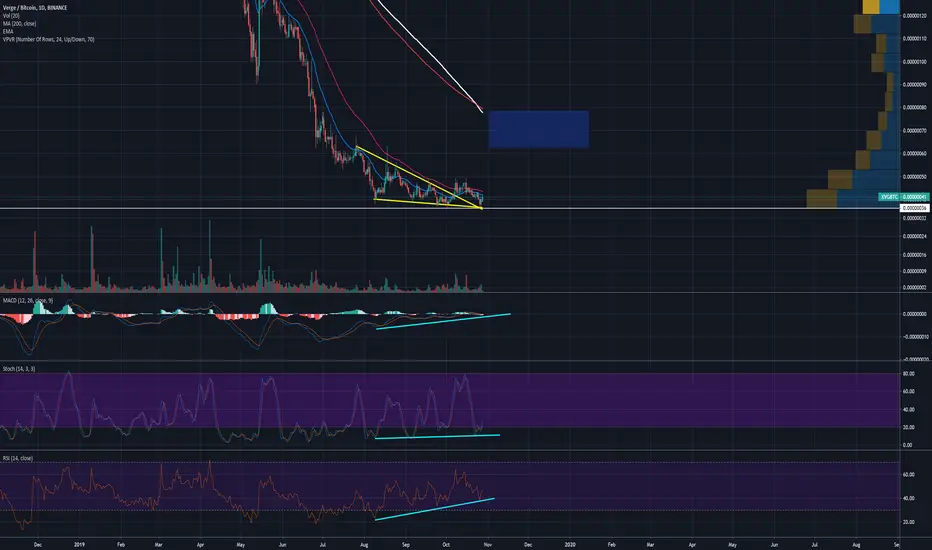
#XVG $XVG #VergeCurrency Bullish Divergences..Ready for takeoff?Coming out of the Falling Wedge we have Double Bottomed testing previous resistance as support.
MACD, RSI and Stoch Showing Bullish Divergences.
Near future incoming price at 62-78 SAT range as shown in blue box.
This is not Financial Advice.
Good Luck Traders!
BTC/USD – Significant Rally Creates Fresh DemandAs we can see the price creates a fresh demand at the end of the past week.
This demand is also a Quasimodo level.
In addition, we can see the MACD divergence.
That cofluence of MACD divergence and fresh demand (Quasimodo) creates a great setup for buy position.
The entry-level will be the demand below and the target will be the resistance above.

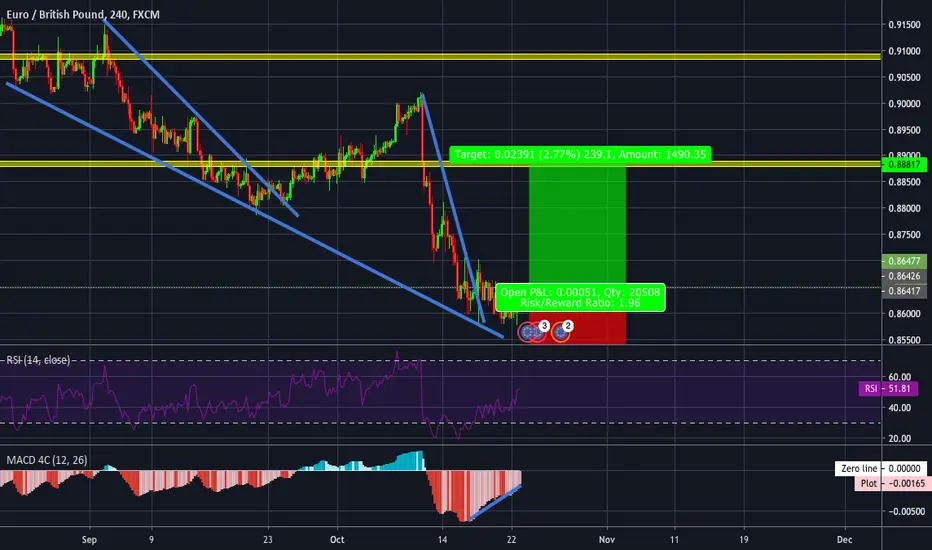
EURGBP for buyThe price is near a support zone and it is forming a divergence with the MACD indicator.
There is also a descending wedge that has been broken and confirmed the change of trend.
The trendline indicates us a bounce in the price and it is been respected
Comment your ideas!
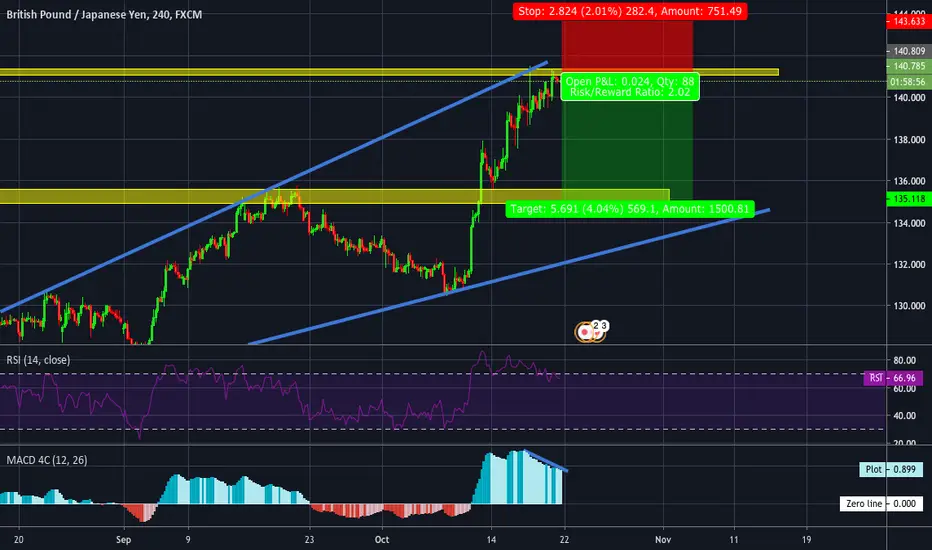
GBPJPY for sellThe price has touched the resistance zone and there is also the trendline in the same area
Also, it made a false break so we are expecting the price to head towards the support zone.
There is MACD divergence within the increasing expandable triangle.
Comment your thoughts!
Sorry for last week's absence
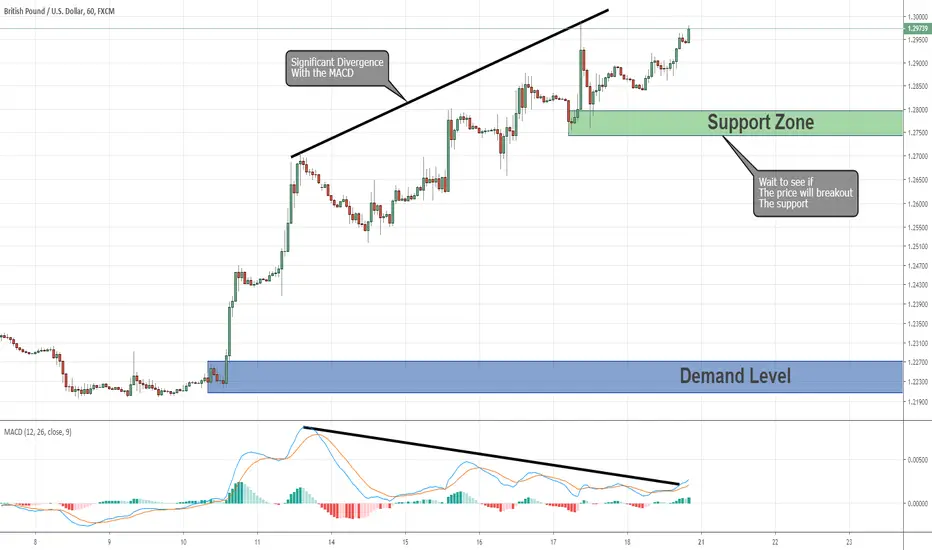
GBP/USD - What Will be The Signal For Reversal Opportunity.GBP/USD is in amazing rally for the last 10 days,
For now, I prefer to look for a reversal signal.
If the price will breakout the support below it will be the signal for changing momentum to bearish,
In that case, I'll look for a price action setup to sell GBP/USD.
In addition, there is a significant MACD divergence which indicates the buyers running out of power.
The target for the sell position will be the demand at the bottom.
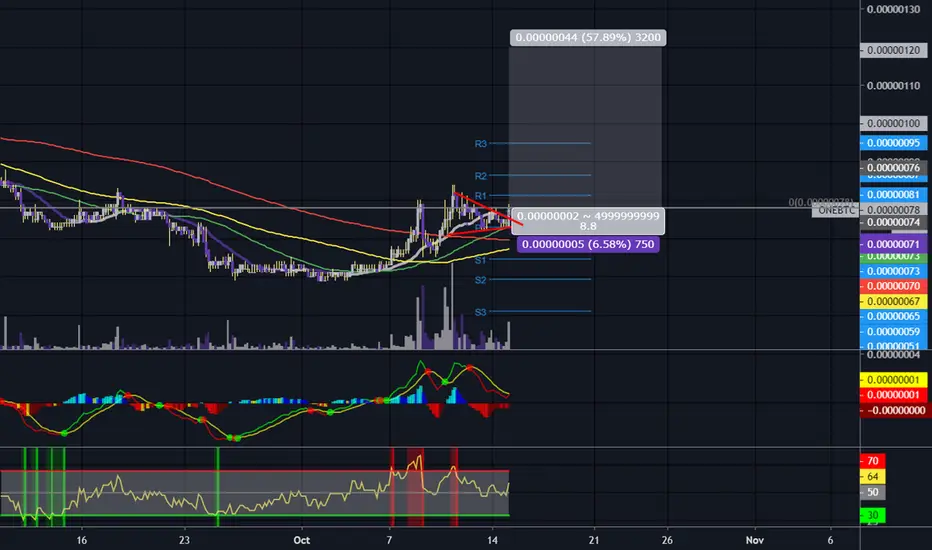
One and DoneI opened a position here on ONE. I like the potential macd bull cross, with upticking histogram, bull break of the pennant and declining dominance. I'm in!
#ONE/BTC
Exchanges: Binance
Signal Type: Regular (Long)
Entry Zone: 74-76
Take-Profit Targets: 80-90-100-110-120
Stop Targets: 71
Risk: 6.58%
Rate: 75
AUDUSD buy set upThe price has broken the down trendline and we are waiting for it to cross the resistance zone in order to enter the buy.
there was MACD divergence in the support zones so there is now forming a bullish momentum. Also, the price formed a double top.
Comment your opinions!

CB has a slightly untidy topping pattern but strong MACD downCB was already moving down this morning and the MACD seems to show prices should be down around 150 -155. Bought some October 18 155 puts at 60c
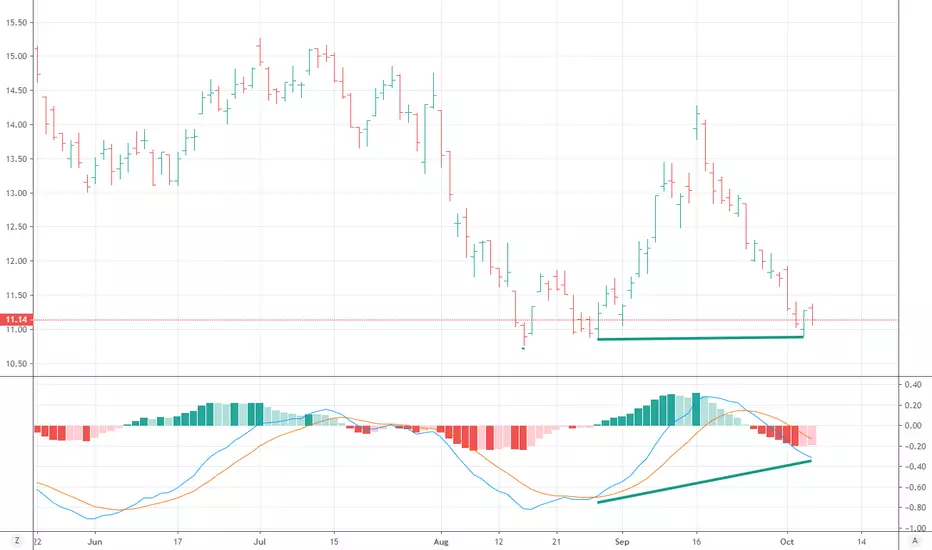
Modest double bottom with upside divergence on OIHModest double bottom with upside divergence on OIH bought some 11.5 puts that expire oct 11 for 11c.
SPDR energy sector double bottom and upside divergence XLE has a good double bottom and modest upside divergence. grabbing some oct 11 57.5 calls at 41c

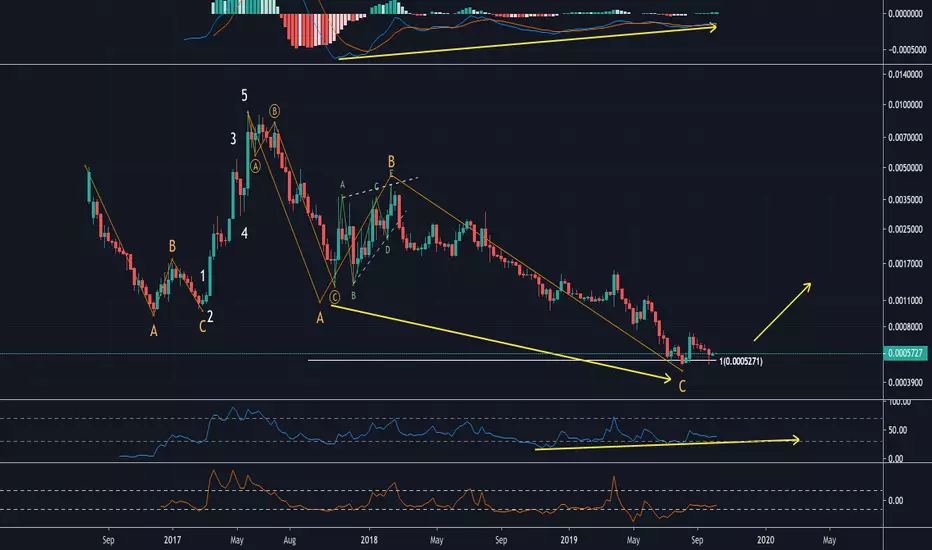
ETCBTC Bull scenarioConsidering oscillators are bullish showing a bullish divergence play along with Elliott Wave hitting at 100% Fibonacci ratio saying that correction phase is over. Likely ETCBTC correcting is done and we're on our way to an impulsive rally.
Bear scenario if it breaks support.
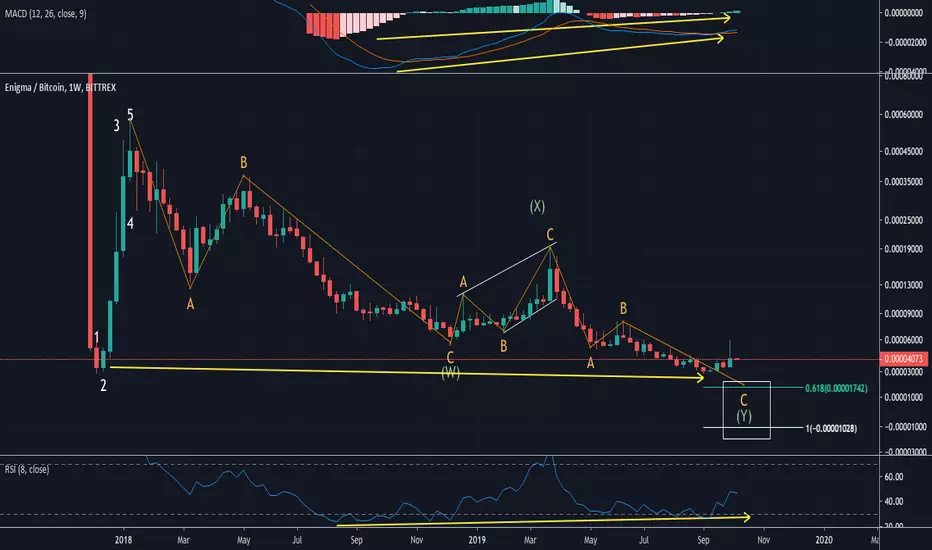
ENGBTC Bear scenarioConsidering the daily time frame showing possible bullish divergence.
If we're following Elliott wave theory it seems a long WXY correction is not yet over. As it must respect Fibonacci ratios which are most the golden ratio of 61.8.
The bull scenario here if it will break out from the trend line resistance. It's still possible since bullish divergence is already present.
Nice doubletop and downside divergence on XLP daily chartspicked up some Oct 11 60.5 puts for 21 c MACD says price sb around $60 or below.
Small MACD divergence down on homebuildersSmall downside on homebuilders XHB going to pickup some Oct 4 43.5 puts for 14c, expires Friday so a quick play on this daily chart

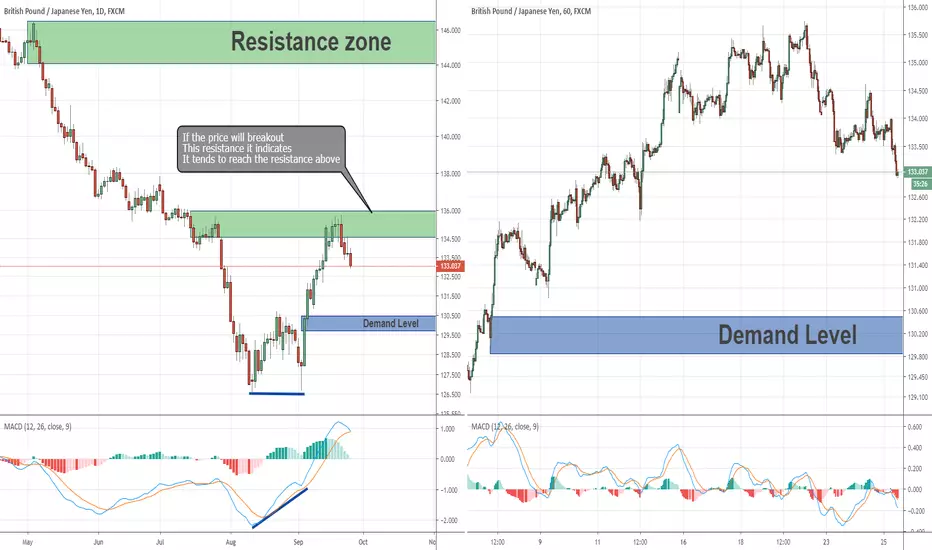
GBP/JPY Performed a Double Bottom After MACD Divergence.The price has performed a double bottom pattern on the D1 chart,
Also, while the price created the double bottom the MACD created a higher low, which's called MACD divergence.
The combination of double bottom and MACD divergence creates a great setup for buy position.
If the price will break the resistance above I'll look for a buy signal,
If the price will move down toward the demand below I'll buy at the demand,
For both options, the target will be the resistance at the top
GBPUSD sell set upThe price has broken the trendline and we are waiting for it to close below the first fibo level of .236. Once it closes it is a good opportunity to sell but to have another confirmation of the bearish trend you could wait to close below the support zone.
There is MACD divergence with RSI divergence as well.
Comment your opinions!

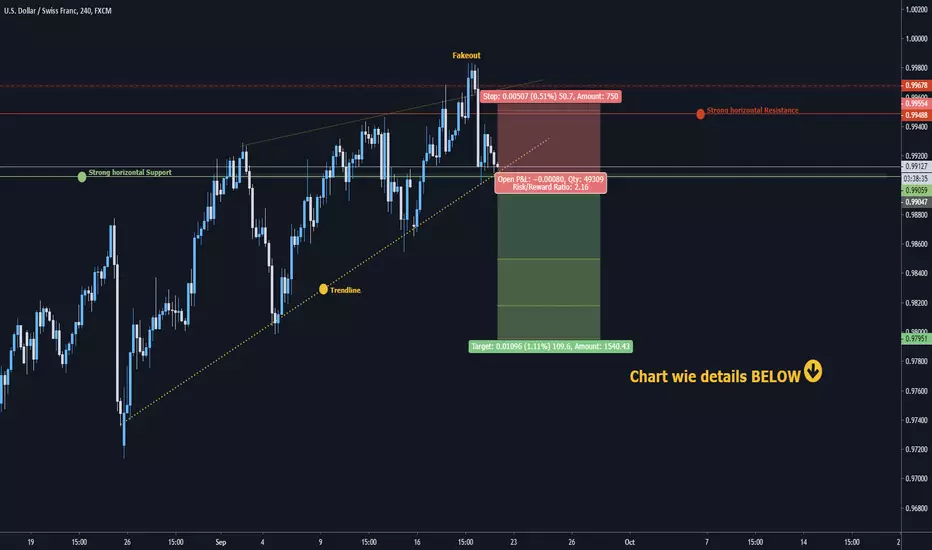
USD/CHF: Day-Swingtrade-OPPORTUNITYHey tradomaniacs,
welcome to another free signal of WEEK 38 NR. 13
How to trade: Wait for the breakout of the rising Wedge and the horizontal Support-Line!
We want to see an S&R-Flip before we sell!
-----------------------------
Type: Day-Swingtrade
Sell here: 0,99050
Stop-Loss: 0,99555
Target 1: 0,98500
Target 2: 0,98180
Target 3: 0,97950
-----------------------------
LEAVE A LIKE AND A COMMENT - I appreciate every support! =)
Peace and good trades
Irasor
Wanna see more? Don`t forget to follow me.
Any questions? PM me. :-)
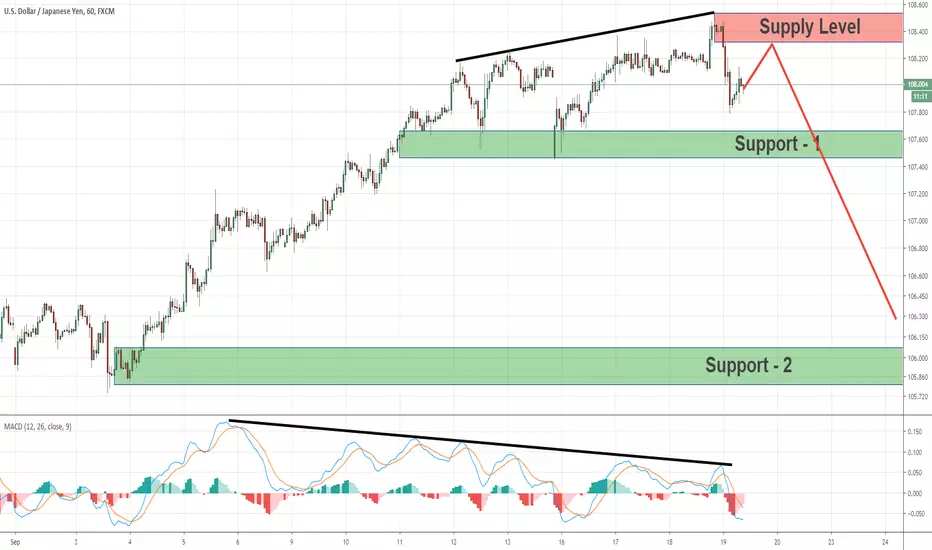
USD/JPY: Bearish Quasimodo After MACD DivergenceUSD/JPY is after a significant MACD divergence
The price creates a fresh supply above which formed a bearish Quasimodo pattern.
It's a great setup to sell USD/JPY,
Targets are the support levels 1 and 2 below.
USDMXN for buyThe price has broken the descending triangle near the support zone, making a double bottom and showing MACD divergence within the process.
We are expecting the price to make a bounce and head upwards. You could also set up a buy stop in the price of 19.6021
Comment your opinions!

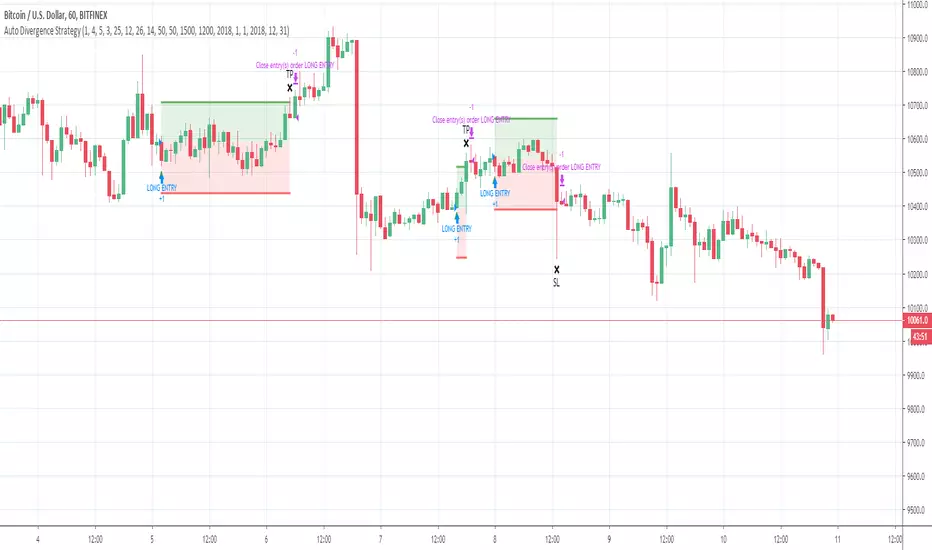
Huge BTCUSD gains by trading MACD DivergencesI've been playing around with the AutoDivergence Strategy on the 1H BTCUSD chart (Bitfinex) and tried some "unconventional" settings
As with a lot of other Crypto-Pairs, trading only longs seems to perform much better than going long AND short.
I configured AutoDivergence to use the MACD-histogram as an oscillator to find Divergences. I started to increase the oscillator length and the results kept getting better - "25" seems to be a perfect length.
By reducing the number of candles that need to diverge to 4, I got more signals while still maintaining a high profitability.
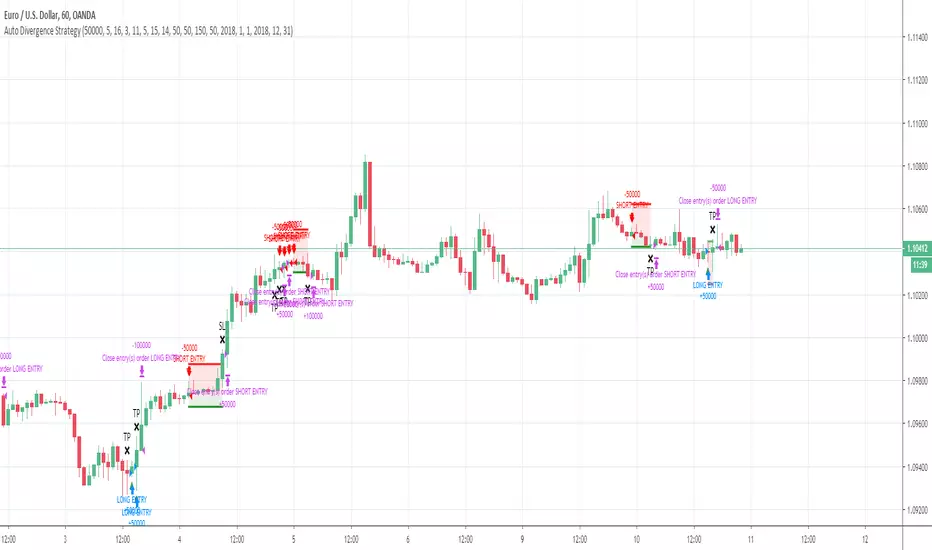
Find MACD Divergences on the EURUSD 1H ChartHere are the settings that can be used to find divergences of MACD vs. Price on the 1H EURUSD chart:
AutoDivergence Settings
To automate this strategy you would need to apply the AutoDivergence Study to the chart - check that the properties are set to the same values as for the strategy.
Luckily OANDA is supported by autoview, so you can automate the strategy. Or if you prefer a more manual approach - just use the Email-Alerts to get notified if you need to enter or exit a trade.